Characterization of lung nodules/masses as benign or malignant
Imaging in confirmed lung cancer
Assessment of tumor vitality and therapy response
Nodal staging
Imaging pulmonary embolism in cancer patients
Pulmonary perfusion imaging
Pulmonary ventilation imaging
Optimization of image contrast
Monoenergetic extrapolation
Nonlinear blending techniques
4.2 Assessment of Lung Nodules and Thoracic Malignancies
4.2.1 Acquisition Technique
DECT of the thorax can be performed using either single-source CT systems equipped with a rapid kV switching X-ray tube or dual source CT systems. With dual source CT systems, DECT is performed analogous to a conventional contrast-enhanced chest CT except that the tube current is distributed over both tubes, which are operated at different photon energies. The recommended spectral combination differs between the various generations of CT systems with the lower energy spectrum ranging from 80 to 100 kVp and the higher energy spectrum ranging from 140 to 150 kVp. In the more recent generations of dual source CT systems, the higher energy spectrum can be hardened by means of a tin filter in order to decrease the overlap in photon energies between both spectra. If the goal of performing DECT is the assessment of lung nodules, masses or lymph nodes, the examination is typically acquired in a venous phase to ensure adequate contrast enhancement of these structures although an arterial phase may be added depending on the clinical indication. In the delayed phase, the enhancement of the pulmonary parenchyma is minimal. If an assessment of pulmonary perfusion is desired, an additional dual energy CT pulmonary angiography (DE-CTPA) needs to be acquired, as described in more detail below.
4.2.2 Characterization of Pulmonary Nodules/Masses as Benign or Malignant
Pulmonary nodules are frequently detected in chest CT. This includes CT staging examinations in patients with extra-thoracic malignancies, incidentally detected nodules in patients without an underlying oncologic diagnosis or nodules detected at lung cancer screening. The latter two scenarios are particularly challenging, since the pre-test probability of malignancy is relatively low. Several clinical risk factors as well as nodule size and characteristics have been shown to predict the likelihood of malignancy [1, 2]. Nevertheless, for an individual patient, these clues are often not sufficient to classify a nodule as either clearly benign or malignant. In this context, the ability of DECT to visualize and quantify the iodine uptake of pulmonary nodules has been explored as a means to differentiate benign from malignant pulmonary nodules [3]. DECT examples of malignant and benign pulmonary masses are shown in Figs. 4.1, 4.2, 4.3, 4.4, and 4.5, respectively. Chae and colleagues [4] evaluated the clinical utility of DECT for the classification of 45 solitary pulmonary nodules, which were confirmed as benign or malignant on the basis of percutaneous needle aspiration histology. In their study, the diagnostic accuracy for malignancy by using CT numbers on iodine-enhanced image series with a cutoff of 20 HU was comparable to that achieved by using the degree of enhancement. More recently, Hou and colleagues [5] compared the dual energy CT characteristics of 35 patients with lung cancers to those of 25 patients with inflammatory masses using a dual phase (arterial and venous phase) CT acquisition protocol. They found significant differences in iodine uptake between both groups. The iodine content in the center of masses in the venous acquisition phase (normalized to the aorta) had the highest discriminatory power with lower central iodine content in lung cancers compared to inflammatory masses. Kawai and colleagues [6] evaluated the feasibility of measuring iodine uptake of ground glass lesions by DECT. This study provided preliminary data that iodine uptake may be useful for the characterization of ground glass opacities as they found an increased iodine-related attenuation in adenocarcinomas compared to pulmonary hemorrhage or inflammatory changes. The presence and pattern of calcifications of lung nodules is another important feature that can suggest a benign or malignant entity. Virtual noncontrast images can be reconstructed from DECT data and have been found useful in differentiating iodine enhancement from calcifications in lung nodules (Figs. 4.2 and 4.3) [7].
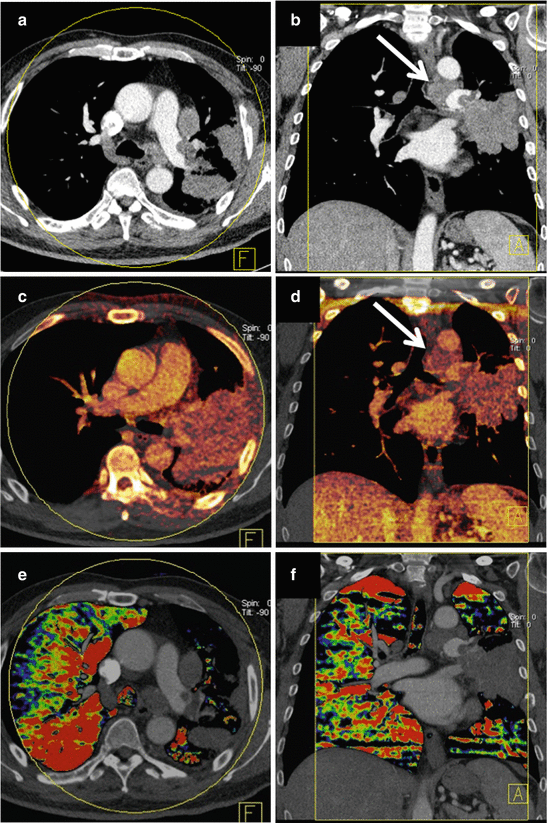
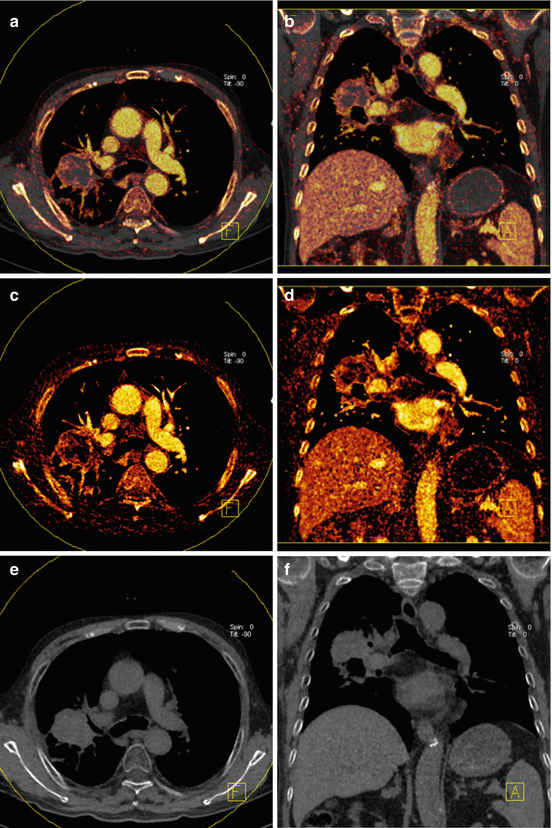
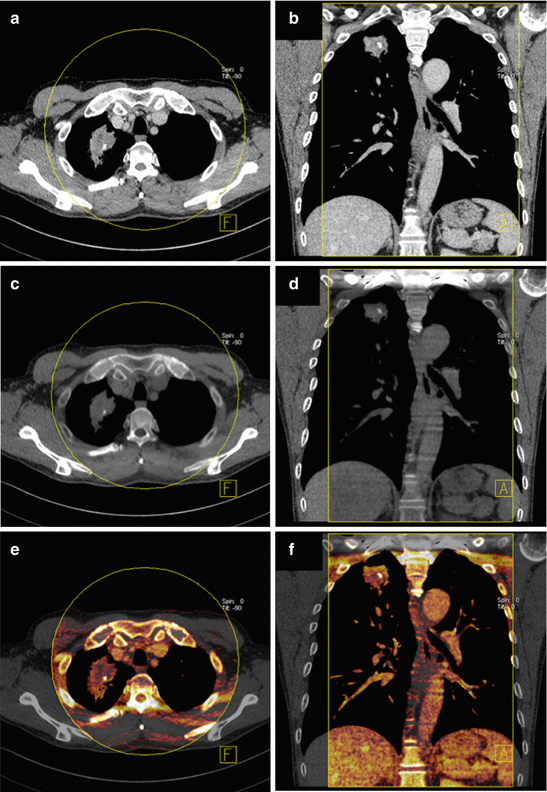
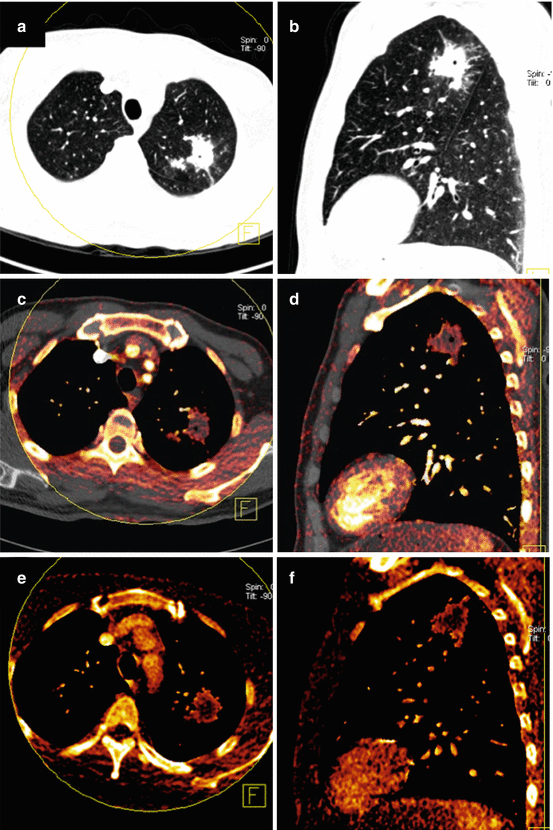
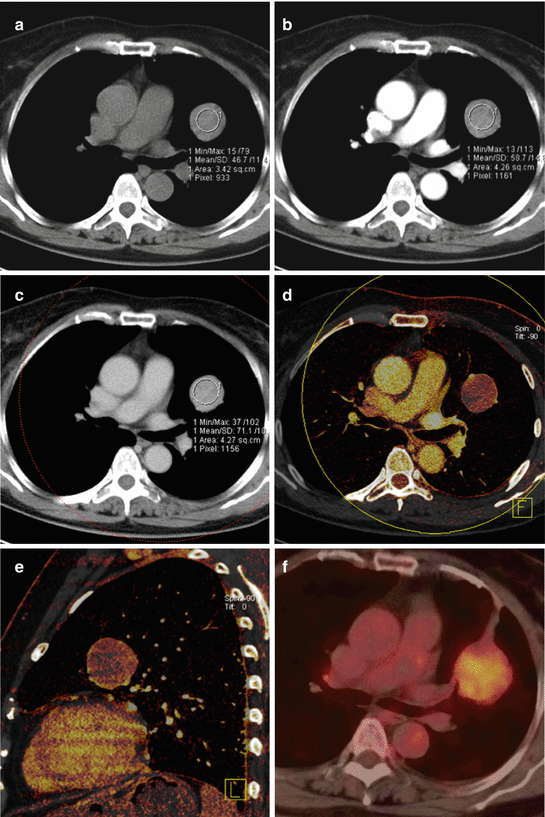

Fig. 4.1
Dual energy CT in a 56-year-old male patient with squamous cell lung cancer. Average weighted reconstructions in the arterial phase in axial and coronal orientation (a, b) demonstrate a large, left-sided pulmonary mass with infiltration of the left main pulmonary artery. The iodine overlay images from the venous acquisition phase (c, d) demonstrate strong, relatively homogeneous perfusion of the tumor. Iodine uptake of mediastinal lymph node metastasis is also noted. Iodine distribution maps derived from dual energy CT pulmonary angiography (e, f) demonstrate substantially decreased perfusion to the entire left lung due to obstruction of the left main pulmonary artery

Fig. 4.2
Dual energy CT in an 83-year-old male patient with non-small cell lung cancer. Iodine overlay images (a, b) and pure iodine images (c, d) demonstrate strong perfusion in the periphery of the tumor and low perfusion in its necrotic center. Virtual noncontrast images (e, f) demonstrate absence of calcification within the mass

Fig. 4.3
Dual energy CT in a 63-year-old male patient with adenocarcinoma in the right upper lobe. Average weighted reconstructions in the venous phase in axial and coronal orientation (a, b) demonstrate a mass in the right upper lobe. Virtual noncontrast reconstructions (c, d) demonstrate a small calcification within the mass. Iodine overlay images (e, f) demonstrate strong iodine uptake, particularly in the periphery of the mass

Fig. 4.4
Dual energy CT in a 52-year-old male patient with tuberculosis. Average weighted reconstructions displayed in a lung window in axial and sagittal orientation (a, b) demonstrate a large mass with spiculated margins in the left upper lobe. Iodine overlay images in the arterial phase (c, d) and pure iodine images in the venous phase (e, f) demonstrate rim-like iodine uptake in the periphery of the mass

Fig. 4.5
Dual energy CT in a 61-year-old female patient with a sclerosing hemangioma of the lung. The mass is shown on axial average weighted CTPA reconstructions in noncontrast (a), arterial (b) and venous phase (c). The perfusion of the mass is assessed using dual energy iodine distribution maps in the venous acquisition phase shown in axial and sagittal orientation (d, e). The corresponding 18 F-FDG-PET/CT image is shown in panel (f). Sclerosing hemangioma of the lung is an uncommon neoplasm. Although lymph node metastasis has been reported, sclerosing hemangioma is generally considered a benign lesion and surgical excision is curative [47]
4.2.3 Lung Cancer: Assessment of Tumor Perfusion, Therapy Response, and Staging
The assessment of patients with a confirmed diagnosis of lung cancer represents a very different scenario. Here, the potential utility of DECT could be to assess tumor vitality and response to therapy. In addition, visualization of iodine uptake has been explored as a tool for the visualization and characterization of mediastinal lymph nodes in the nodal staging of lung cancer (Fig. 4.1). Schmid-Bindert and colleagues [8] have demonstrated that the iodine uptake of non-small cell lung cancers measured by DECT correlates with metabolic activity on FDG-PET. The correlation between metabolic activity at PET and the iodine-related attenuation at DECT was lower for thoracic lymph nodes compared to the primary tumor [8]. In a pilot study of ten patients with non-small cell lung cancer treated with the anti-angiogenic agent Bevacizumab, Kim and colleagues used DECT-derived tumor enhancement to assess therapy response [9]. In their study, the spectral information from DECT was considered particularly useful to discriminate between tumor enhancement and intratumor hemorrhage. Baxa and colleagues [10] retrospectively analyzed the DECT characteristics of mediastinal lymph nodes in patients with non-small cell lung cancer who underwent dual phase (arterial and venous phase) DECT before and after chemotherapy. They noticed that enlarged lymph nodes showed a higher arterial enhancement fraction compared to nonenlarged lymph nodes. In lymph nodes shrinking under chemotherapy, a significant decrease in arterial enhancement fraction was observed.
4.2.4 Lung Cancer: Assessment of Pulmonary Perfusion and/or Ventilation
In patients with lung cancer, particular those with a centrally located tumor compromising the hilar vessels or bronchi, preoperative DECT has been used to predict postoperative pulmonary perfusion and ventilation. Chae and colleagues [11] found that DECT can predict postoperative lung function more accurately than scintigraphy. In their study, DECT was superior to scintigraphy for the depiction of perfusion and ventilation defects and assessing collateral ventilation in patients with centrally located lung cancers.
4.3 Lung Perfusion Imaging in Pulmonary Embolism
Dual energy CT pulmonary angiography (DE-CTPA) can visualize the iodine distribution within the pulmonary parenchyma as a surrogate for pulmonary perfusion [12–17]. The resulting iodine distribution maps have been validated against scintigraphy [18] and SPECT [19] images in clinical studies and against dynamic CT measurements of pulmonary perfusion in animal models [20]. The main application of dual energy lung perfusion imaging has been the diagnosis and assessment of pulmonary embolism (Figs. 4.6 and 4.7). As such, the technique is highly relevant to oncologic imaging, considering that malignancy is one the major risk factors for pulmonary embolism [21].
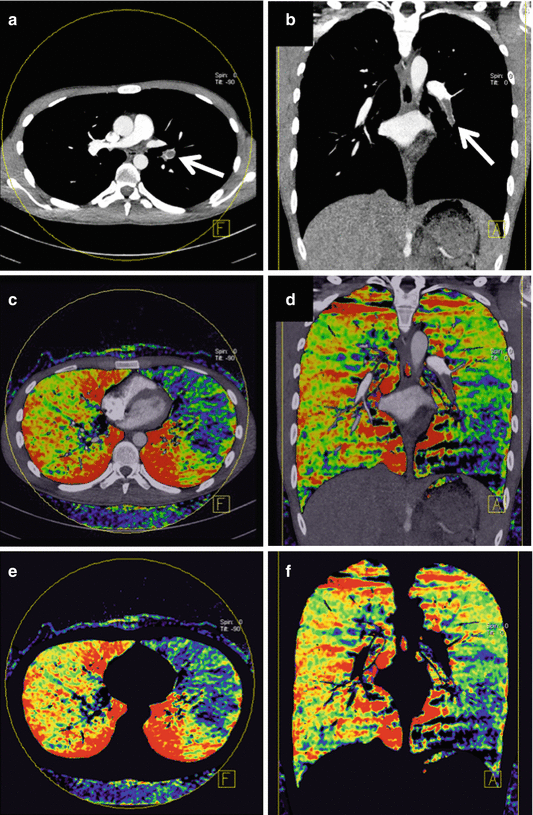
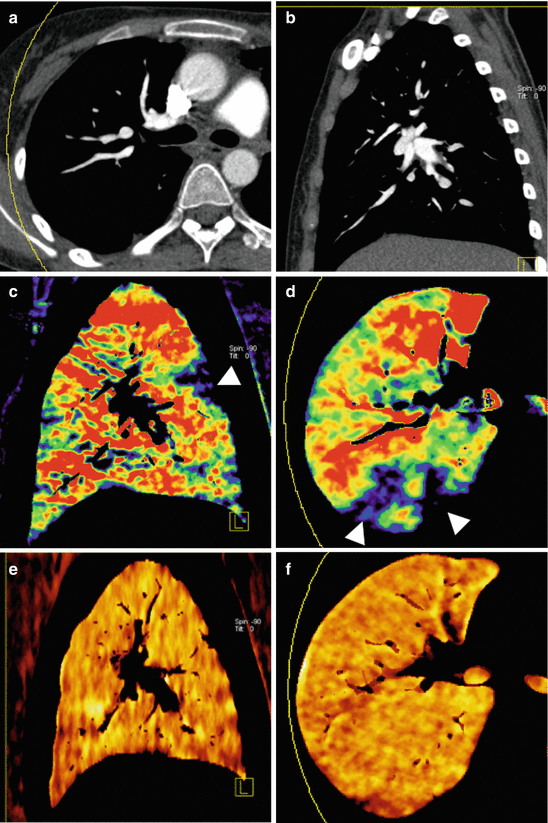

Fig. 4.6
Dual energy CTPA in a 28-year-old male patient with pulmonary embolism. CTPA in axial (a) and coronal (b) orientation demonstrates a filling defect in the left inferior pulmonary artery (arrows). Iodine overlay images (c, d) as well as pure iodine distribution maps (e, f) demonstrate a corresponding perfusion defect in the left lower lobe

Fig. 4.7
Dual energy CTPA in a 19-year-old female patient with pulmonary embolism. Average weighted CTPA reconstructions in axial (a) and sagittal (b) orientation do not conclusively demonstrate pulmonary emboli. However, dual energy iodine distribution maps (c, d) demonstrate multiple peripheral wedge-shaped perfusion defects (arrowheads) suggesting subsegmental pulmonary embolism. Xenon distribution maps (e, f) demonstrate homogeneous ventilation and thus mismatch of ventilation and perfusion findings
4.3.1 Acquisition Technique
System-specific recommendations for DE-CTPA acquisition parameters have been proposed in the literature [22]. Both test bolus or bolus tracking techniques can be used. A slightly longer delay (5–7 s) than for conventional CTPA is typically chosen to allow for the contrast material to reach the pulmonary capillary system. An iodine delivery rate of approximately 1.6 g I/s has been found to result in optimal image quality for both morphological CTPA reconstructions and dual energy perfusion maps [15]. In order to minimize streak artifacts originating from dense contrast material in the superior vena cava, some institutions prefer a triphasic injection protocol in which the contrast agent bolus is followed by 30 mL of a mixture of saline and contrast agent, followed by a 50 mL saline chaser [23]. Choosing a caudocranial direction of acquisition further helps minimize artifacts from dense contrast material in the superior vena cava. As with conventional CTPA, deep inspiration prior to breathhold should be avoided, since the inflow of nonopacified blood from the inferior vena cava during deep inspiration can lead to an interruption of the contrast bolus and inadequate opacification of the pulmonary circulation. From the acquired low- and high-energy datasets, anatomical image series similar to a conventional CTPA can be reconstructed by mixing the data from both energy levels. In addition, specific postprocessing software is used to segment the pulmonary parenchyma and then display pulmonary iodine content as a color-coded parametric map (Figs. 4.6 and 4.7). By means of a different postprocessing algorithm, DE-CTPA data can also be used to visualize the iodine content within the pulmonary vessels to increase the conspicuity of emboli [24].
Stay updated, free articles. Join our Telegram channel

Full access? Get Clinical Tree


