(20.1)
In this formalism, the distribution of square displacements of free water molecules is Gaussian, with the probability of displacing at a given distance from the origin being the same, independent of the direction in which it is measured. In biological tissues the diffusion of water molecules is hindered by intracellular and extracellular microstructures, such as cell membranes, myelin sheets and organelles. Thus, the mean square displacement per unit time is lower than in free water, and the distribution of molecular displacements deviates from the Gaussian law described in Einstein’s equation. The apparent diffusion coefficient (ADC) was introduced to describe this deviation, and take into account the interaction of water molecules with the microstructures that restrict or hinder diffusion [2]. The calculation of ADC values in different brain tissues provides an indirect characterization of the underlying architecture of the brain at the microscopic level.
20.1.2 Measuring Diffusion Properties of Brain Tissue with MRI
Diffusion MRI combines the physics of diffusion and the physics of MRI to enable the measurement of the displacement of water molecules in the brain. The spin echo effect discovered by Rewin Hanhn in 1950 and the subsequent mathematical and physical framework introduced by Carr and Purcell in 1954 opened up the possibility of measuring the diffusion coefficient of spin-labeled molecules. A few years later, Stejskal and Tanner introduced the pulsed gradient spin echo (PGSE) sequence based on the addition of a pair of bipolar magnetic field gradients to a spin echo sequence, to sensitize the MR signal to the diffusion of water molecules [173]. In this formalism, the diffusion coefficient D in a given direction  can be measured using two MR acquisitions: a diffusion-weighted acquisition with a pair of diffusion-encoding gradients oriented in the direction
  and a baseline acquisition with the diffusion-encoding gradients set to zero. The signal intensity attenuation
  resulting from the application of the diffusion-encoding gradients is given by the equation:
![$$ {S}_k={S}_o \exp \left[- bD\right] $$](http://oncohemakey.com/wp-content/uploads/2017/10/A272046_2_En_20_Chapter_Equ2.gif)
where S 0 is the signal intensity of the baseline acquisition, b is the diffusion-weighting factor, and D is the diffusion coefficient. The diffusion-weighting factor, or so-called b-value, is calculated based on the amplitude of the magnetic field gradient pulses G, their duration δ and temporal separation ∆, and the gyromagnetic ratio of hydrogen γ:

 can be measured using two MR acquisitions: a diffusion-weighted acquisition with a pair of diffusion-encoding gradients oriented in the direction
  and a baseline acquisition with the diffusion-encoding gradients set to zero. The signal intensity attenuation
  resulting from the application of the diffusion-encoding gradients is given by the equation:
![$$ {S}_k={S}_o \exp \left[- bD\right] $$](http://oncohemakey.com/wp-content/uploads/2017/10/A272046_2_En_20_Chapter_Equ2.gif)
(20.2)

(20.3)
From Eq. (20.2), the apparent diffusion coefficient in the encoding direction  is expressed as:

 is expressed as:
(20.4)
Since ADC values depend on the direction , diffusion-weighted imaging data are usually acquired sequentially using three or more orthogonal diffusion-encoding gradient directions and the measurements are averaged to obtain mean ADC values at each voxel.
 , diffusion-weighted imaging data are usually acquired sequentially using three or more orthogonal diffusion-encoding gradient directions and the measurements are averaged to obtain mean ADC values at each voxel.
In neuro-oncology imaging, ADC maps can be used to investigate pathological changes and monitor treatment [3]. The quantitative information provided by ADC maps can be complementary to invasive histopathology of tissue biopsy samples, which is the current gold standard for distinguishing among gliomas subtypes. However, ADC measurements cannot be used to diagnose a particular tumor due to the overlap between the tumor-specific ranges of diffusion values [4]. During treatment monitoring, the evaluation of changes in tumor ADC values before and after initiation of chemotherapy and radiation therapy has been investigated as a potential indicator of early tumor response [5, 6]. Such non-invasive quantitative imaging biomarker could aid physicians individualize treatment, minimize unnecessary systemic toxicity associated with ineffective therapies, and gain precious time [7, 8].
20.1.3 Quality Control of Diffusion MRI Data
Diffusion MRI pulse sequences use long and strong diffusion-encoding gradients that make the acquisitions very sensitive to involuntary patient movement, respiratory motion, and cardiac pulsation. Motion-corrupted diffusion weighted imaging (DWI) datasets can present ghosting artifacts and heterogeneous misregistration errors. A second major source of artifacts arises from eddy currents induced by the rapid switching of the diffusion-encoding gradient pulses. Eddy currents generate local magnetic field gradients that get combined with the diffusion-encoding gradients and result in ghosting artifacts that can lead to misinterpretation of the DWI scans. Finally, Echo Planar Imaging (EPI) sequences, the most commonly used diffusion MRI sequences in the clinics, are very sensitive to inhomogeneities of the static magnetic field B 0. These inhomogeneities produce EPI geometric distortion that can be important at the interface between bones and air-filled cavities, such as the sinuses and the auditory canal, as well as at the interface between brain tissues and air during intra-operative MRI acquisition.
Numerous techniques exist to prevent the apparition of image artifacts during the acquisition of DWI scans. These techniques include cardiac gating and head holders for motion-related artifacts, self-shielded gradient coils and proper calibration for eddy-current artifacts, as well as maps of the static magnetic fields and blip-up blip-down acquisitions for EPI distortion [9, 10]. Once a DWI scan is acquired, quality control of the raw images is an essential step before starting any post-processing pipeline. While visual inspection of each diffusion-weighted image can provide a quick detection of acquisition artifacts, the process is time-consuming and operator-dependent. In addition, image misalignment caused by patient motion across scans can be difficult to detect [11]. To overcome these limitations, several tools for quality control and automated artifacts correction of DWI data have been developed by the diffusion MRI research community. Most of these tools are available as open-source software packages, and provide useful resources to minimize the impact of artifacts encountered during clinical diffusion MRI acquisition [9, 12–14].
20.1.4 Diffusion Tensor Imaging
The diffusion of water molecules in the brain is sensitive to the underlying tissue microstructures [1]. In gray matter and cerebrospinal fluid, the displacement of water molecules is identical in all directions and the diffusion is isotropic. In white matter fibers, as myelin sheets and axonal membranes act as barriers, the displacement of water molecules is less hindered in the direction parallel to the fibers than in the direction perpendicular to their axis, and thus the diffusion is anisotropic [15]. Diffusion Tensor Imaging (DTI) was the first mathematical framework introduced to model the anisotropic diffusion of water molecules in the brain [174]. In the tensor model, the signal attenuation S k resulting from the application of the diffusion-encoding gradient in the direction is expressed at each voxel as:

where S 0 is the signal intensity of the baseline acquisition, b is the diffusion-weighting factor, D is the diffusion tensor and  is the unit vector describing the diffusion-encoding direction
 . The diffusion tensor D is a 3 × 3 symmetric matrix defined by six elements. Thus, a minimum of six diffusion-weighted acquisitions with six diffusion-encoding gradients oriented in non-colinear and non-coplanar directions is necessary to compute the tensor elements at each voxel. The diffusion tensor is then diagonalized to compute the three principal directions (
 ), called eigenvectors, and the three diffusion coefficients (λ 1, λ 2, λ 3), called eigenvalues. The eigenvalues correspond to the apparent diffusivities along the eigenvectors, and the eigenvector associated with the largest eigenvalue corresponds to the direction of maximum diffusion. The eigenvectors and eigenvalues are rotationally independent, thereby DTI volumes are intrinsic to the brain structures being imaged, and are independent of both the orientation of the diffusion-encoding gradients used for the acquisition and the orientation of the patient in the MR scanner coordinate system.
 is expressed at each voxel as:
(20.5)
 is the unit vector describing the diffusion-encoding direction
 . The diffusion tensor D is a 3 × 3 symmetric matrix defined by six elements. Thus, a minimum of six diffusion-weighted acquisitions with six diffusion-encoding gradients oriented in non-colinear and non-coplanar directions is necessary to compute the tensor elements at each voxel. The diffusion tensor is then diagonalized to compute the three principal directions (
 ), called eigenvectors, and the three diffusion coefficients (λ 1, λ 2, λ 3), called eigenvalues. The eigenvalues correspond to the apparent diffusivities along the eigenvectors, and the eigenvector associated with the largest eigenvalue corresponds to the direction of maximum diffusion. The eigenvectors and eigenvalues are rotationally independent, thereby DTI volumes are intrinsic to the brain structures being imaged, and are independent of both the orientation of the diffusion-encoding gradients used for the acquisition and the orientation of the patient in the MR scanner coordinate system.
Diffusion tensors can be represented using small graphical objects called glyphs in the shape of an ellipsoid. The diffusion tensor ellipsoid represents the isoprobability surface where a molecule of water placed at its center will diffuse [16, 17]. The axes of the diffusion tensor ellipsoid correspond to the eigenvectors and the length of the axes are proportional to the square root of the eigenvalues. The shape of the ellipsoid provides an intuitive visualization of the diffusion properties of different tissues: in anisotropic media, the diffusion tensor glyphs are either cigar-shaped or disk-shaped, while in isotropic media the glyphs are spherical. Color schemes were subsequently introduced to represent fiber direction from DTI data [18]. In directionally encoded color (DEC) images, white matter fibers oriented in the left-right direction appear red; fibers oriented in the anterior-posterior direction appear green; and fibers oriented in the superior-inferior direction appear blue. Through this representation, DEC maps derived from DTI data enable an intuitive identification of all major white matter association, commissural and projection pathways of the human brain.
In addition to the visual display of white matter fiber orientation, quantitative scalar parameters that measure different intrinsic features of anisotropic tissues can be computed from DTI data [17]. The most commonly used metrics are the mean diffusivity (MD), which is a measure of the amplitude of water diffusion, and the fractional anisotropy (FA), which quantifies the degree of anisotropy of diffusion, with values ranging between FA = 0.0 in isotropic media and FA = 1.0 in highly anisotropic tissue. Figure 20.1 shows an example of FA map, DEC map and diffusion tensor glyphs.
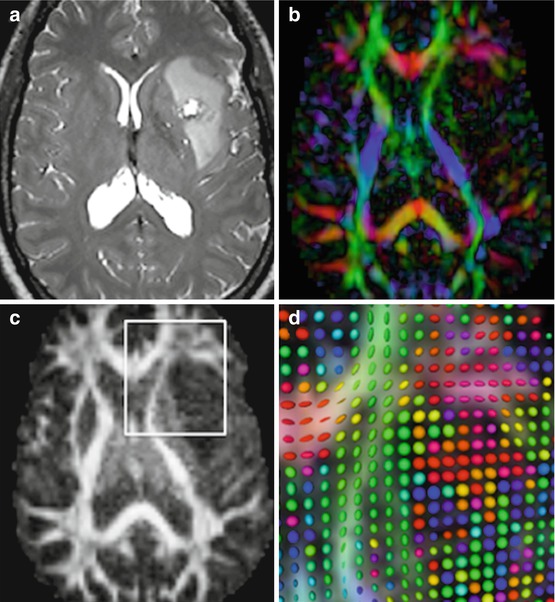

Fig. 20.1
Pre-operative structural and diffusion MRI data in an astrocytoma grade II. (a) T2-weighted image; (b) Directionally encoded color (DEC) map; (c) Fractional Anisotropy (FA) map; (d) zoomed-in view of DTI glyphs superimposed on FA and DEC map. The view presented in (d) corresponds to the region of interest (white) outlined in (c).
Quantitative DTI data enable non-invasive evaluation of microstructural and physiological features of tissues [19]. Exploratory studies have investigated the use of DTI-derived metrics for the detection of peritumoral white matter infiltration in low-grade and high-grade gliomas [20–23] and the characterization of microstructural integrity in meningiomas and low-grade gliomas [24]. These preliminary findings suggest a potential role for quantitative DTI in the detection of tumor infiltration in regions that appear normal on conventional MR imaging, which could provide neurosurgeons clinically relevant information on tumor margins of DLGG as tumor cells extend beyond radiological borders on FLAIR and T2-weighted images [25].
20.1.5 From DTI to HARDI: New Mathematical Models of Diffusion
Diffusion Tensor Imaging provides an unprecedented opportunity to gain insights into the architecture of the human brain in vivo. While the tensor model provides a good estimate of fiber orientation in voxels where a single population of fibers exists, the model fails to characterize the diffusion in areas where fibers cross, bend, or fan. Modeling the diffusion of water in regions with complex fiber patterns is an active area of research, and numerous approaches have been developed in the past decade. These approaches can be broadly divided into two categories: model-based approaches and non-parametric algorithms [26].
Model-based approaches operate on a mathematical representation of the diffusion-weighted MR signal. Among these approaches are the multi-tensor models that represent the diffusion using a mixture of Gaussians, each representing a fiber population described by a single tensor model [26]. A constrained version of the multi-compartment model is the ball-and-stick model that decomposes the diffusion signal into an isotropic “ball” compartment and a number of completely anisotropic “stick” compartments [27]. Figure 20.2 shows examples of fiber crossings identified by the ball-and-stick model at the intersection between the pyramidal pathway and cerebellar tracts, and between the corona radiata and the superior longitudinal fasciculus. While the ball-and-stick model provides an elegant depiction of crossing fibers, the approach considers only a discrete set of fibers orientations and does not represent the orientation dispersion within the fiber bundles. The ball-and-rackets model was subsequently introduced to overcome this limitation and represent fanning geometries [28]. Other models such as the composite hindered and restricted model of diffusion (CHARMED) attempt at providing a physical description of the diffusion process in terms of hindered diffusion in the extra-axonal volume and restricted diffusion in the intra-axonal volume [29].
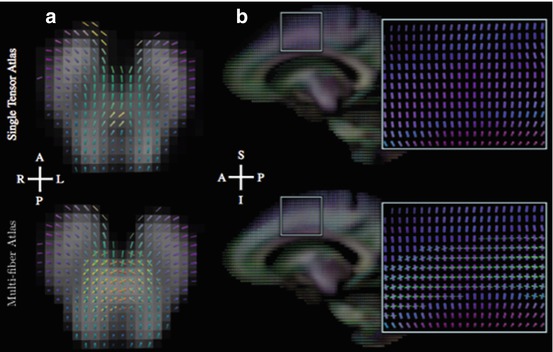

Fig. 20.2
Single tensor and multi-tensor model of diffusion. The top row shows glyphs computed using a single tensor model. The bottom row shows ball-and-sticks glyphs computed using a multi-compartment model. The left column (a) shows an axial slice of the brainstem, demonstrating crossing fibers of cerebellar and pyramidal tracts. The right column (b) shows a sagittal slice demonstrating crossing fibers of the corona radiata and superior longitudinal fasciculus. (Source: [175])
Non-parametric methods make no prior assumption on the molecular diffusion in a given voxel, and proceed by estimating the diffusion function directly. Such approaches include diffusion spectrum imaging (DSI) and q-ball imaging. DSI measures the diffusion function directly by sampling the diffusion signal on a three-dimensional Cartesian lattice [30]. In practice, DSI requires the acquisition of several hundred images and time-intensive sampling which are not compatible with clinical constraints. High angular resolution diffusion imaging (HARDI) sequences have been introduced as an alternative approach based on sampling in a spherical shell instead of a three-dimensional Cartesian volume [31]. The subsequent development of q-ball imaging, a model-independent reconstruction scheme for HARDI data, has enabled the depiction of fiber crossings both in deep white matter pathways and at the subcortical margin [32]. Q-ball imaging computes a probability distribution on the sphere known as the diffusion orientation distribution function (dODF), and peaks in dODF are assumed to correspond to fiber orientations [32]. The computation of ODF initially performed using the Funk-Radon transform has been simplified using spherical harmonics [33]. Other approaches include spherical deconvolution methods that recover an estimate of the fiber orientation distribution function (fODF) [34], diffusion orientation transform (DOT) that calculates a variant of the dODF [35], and persistent angular structure MRI (PAS-MRI) that models the relative mobility of water molecules in each direction [36].
In addition to the multitude of sophisticated model-based methods and non-parametric algorithms for recovering multiple fiber orientations from diffusion-weighted images, novel approaches have recently been developed to estimate the microstructural complexity of dendrites and axons from clinical data. These approaches include neurite orientation dispersion and density imaging (NODDI) and multi-compartment microscopic diffusion imaging based on the spherical mean technique (SMT). NODDI use a tissue model that distinguishes three types of microstructural environment: intra-cellular, extra-cellular, and cerebrospinal fluid compartments [37, 38]. Multi-compartment microscopic diffusion imaging maps the neurite density and compartment-specific microscopic diffusivities unconfounded by the effects of fiber crossings and orientation dispersion [39]. Such novel tools have the potential for providing new quantitative imaging biomarkers for the evaluation of complex tissues compositions associated with the progression of DLGG. A preliminary study on the feasibility of using multi-band diffusion weighted imaging data acquired at 7.0 Tesla to characterize gliomas has demonstrated the potential role of NODDI maps to provide a unique contrast within the tumor that is not visible in anatomical and DTI data [40].
20.1.6 Diffusion MRI Tractography Methods
Diffusion MRI tractography provides a geometrical representation of the trajectory of white matter pathways in the human brain. The first tractography algorithms introduced in the late nineties reconstructed the trajectory of water molecules based on the assumption that the main eigenvector of the diffusion tensor is parallel to the principal fiber orientation at each voxel [42, 176]. Numerous fiber tracking techniques have since been developed and tractography algorithms can be divided into four categories: deterministic, probabilistic, global, and filtered. Deterministic tractography propagates a streamline until a termination criteria is reached. The initial fiber assignment by continuous tracking (FACT) algorithm uses a linear propagation approach [41]. Starting from a seed point, the technique consists in propagating a line by following the orientation of the main eigenvector of the diffusion tensor until a termination criteria based on an anisotropy threshold or a local tract curvature is reached [42]. The FACT approach has demonstrated anatomically faithful reconstructions of white matter pathways in voxels containing anisotropic fibrous tissues presenting with a single fiber orientation. However, in areas containing two or more distinct fiber populations, the diffusion tensor fails to accurately represent the orientation of the underlying white matter anatomy, leading to inaccurate tractography reconstructions. While the subsequent development of the tensor deflection (TEND) approach using the entire diffusion tensor has shown improved performance in fiber crossing regions, the algorithm underestimates the trajectory curvature for curved pathways [43]. In addition, both FACT and TEND algorithms propagate of a streamline based solely on the local diffusion information. Thus, a single error in the estimation of the principal direction of diffusion can propagate along the trajectory during the tracking process and lead to inaccurate tract reconstructions. The limitations of deterministic tractography algorithms have led to the development of probabilistic methods that introduced the notion of uncertainty in the tractography reconstructions [44].
Probabilistic tractography algorithms use the same tract tracing technique as deterministic methods, but propagate a large number of streamlines chosen from the distribution of possible fiber orientations from a given seed point. Each voxel is then assigned a probability that corresponds to the percentage of streamlines launched from the seed point that pass through that voxel [45–48]. Probability maps provide useful information on the reproducibility of the tracking process, and give an indication of the level of confidence that can be assigned to the existence of a connection between two voxels given the data [27]. The combination of q-ball diffusion models and probabilistic fiber tracking has demonstrated improved sensitivity and predictive power to determine the course of white matter fibers when compared to deterministic approaches [49]. Building on whole-brain probabilistic tractography maps, super-resolution tract density imaging (TDI) can provide elegant depictions of white matter structures beyond the resolution of the diffusion weighted images [50]. However, probabilistic tractography images represent the percentage of tracts that reach a given voxel from the seed point, providing information on the repeatability of the tracking process, but not on the anatomical accuracy of identified pathways. As a result, probabilistic tractography results can be difficult to interpret since a reconstructed tract can be highly reproducible without being anatomically correct [51]. In addition, the choice of the threshold on the percentage of streamlines displayed to select between tract and non-tract voxels remains empirical and is a potential source of variability of the identified pathways.
Both deterministic and probabilistic tractography methods propagate streamlines by considering only directional information at the local level. Numerous ambiguities can occur in regions where multiple fiber populations cross, kiss, or bend, as well as in voxels close to grey matter or within tumoral tissue. Global tractography algorithms have been developed to overcome these limitations by solving a global energy minimization problem [52]. Global tractography methods aim at reconstructing the whole-brain fiber configuration that best explains the measured diffusion-weighted imaging data [53–56]. These sophisticated methods are gaining increasing popularity in the neuroscience community, but their long computation time and the difficulty in specifying prior knowledge criteria have hindered their rapid transfer to the clinics. Recent efforts to make global tractography more practical have demonstrated promising results for clinical applications [57]. Finally, novel filtered tractography algorithms have been introduced to simultaneously estimate a local fiber orientation and perform multi-fiber tractography [58]. These methods have been shown to reduce the diffusion model estimation error and improve the anatomical accuracy of the reconstructed tracts in complex fanning and branching fiber configurations [59]. Studies using a two-tensor filtered tractography technique have demonstrated the feasibility of reconstructing white matter pathways in peritumoral edematous regions [60].
The wide range and diversity of diffusion models and tractography methods developed by the medical image computing community in the last two decades represent a wealth of technical resources to advance knowledge on the architecture of white matter. The path of scientific discovery is likely to be accelerated through neuroscience research efforts such as the Human Connectome Project funded by the U.S. National Institutes of Health, which provides optimized high angular resolution diffusion-weighted imaging acquisition sequences and sophisticated brain mapping tools [61, 177]. New insights on the connectivity of the human brain hold great promise to help advance clinical treatment of low-grade gliomas. Nevertheless, the numerous factors that influence tractography results, such as the choice of diffusion model, fiber tracking algorithm and parameters, and regions of interest for seeding, can make the interpretation of tractography results challenging. While diffusion MRI tractography enables unprecedented visualization of the location and trajectory of white matter fascicles at the individual patient scale, the tracts remain an indirect representation of the underlying white matter anatomy. A solid knowledge of neuroanatomy and an understanding of the current technical limitations of the different methods are essential for the correct interpretation of diffusion MRI tractography reconstructions.
20.2 Part 2: White Matter Mapping for the Individual Management of Diffuse Low-Grade Gliomas
The goal of brain tumor surgery is to maximize tumor resection while preserving eloquent cortical structures and associated subcortical white matter pathways. The extent of surgical resection of diffuse low-grade gliomas (DLGG) has a direct impact on progression free survival, malignant transformation and overall survival [178, 179]. Knowledge of the spatial relationship between the tumor and white matter pathways is critical for two reasons: first, any injury to white matter pathways can lead to permanent neurological deficit of the patient; and second, studies have shown that white matter bundles define the functional limits of surgical resection [62].
Pre-operative T1-weighted, T2-weighted and FLAIR MRI scans are an essential components of neurosurgical planning of brain tumor resection. However, conventional MRI presents some limitations in the depiction of the tumor margins and the relationship between the brain and the disease. Studies have shown that conventional MRI underestimates the extent of DLGG as the tumor cells invade beyond the margins visible on the scans [25, 63]. In addition, tumor cells migrate along white matter pathways, and conventional MRI data lack sufficient contrast to infer the architecture of the brain white matter. In that context, diffusion-weighted MRI and tractography reconstruction are promising tools to help infer the relationship between DLGG and white matter pathways.
Tractography reconstructions can provide three-dimensional visualization of the trajectory and integrity of white matter pathways involved in motor, vision and language function. When combined with functional information from pre-operative functional MRI (fMRI) and intra-operative direct electrical stimulation (DES), tractography has the potential to help understand the anatomo-functional connectivity of the brain at the individual patient scale. The following section introduces the current capabilities and limitations of tractography tools for delineating pathways associated with essential function for the individual management of DLGG.
20.2.1 Tractography Reconstruction of Motor, Language and Vision Pathways
20.2.1.1 Motor Pathways
The pyramidal tract is the principal white matter pathway that mediates voluntary movement in humans. Pyramidal fibers includes the corticospinal tract that controls the movement of the leg, torso, and arms, and the corticobulbar tract that controls the movement of the face and tongue [180]. Corticospinal fibers originate in the primary motor cortex, premotor cortex and supplementary motor areas and travel through the posterior limb of the internal capsule, cerebral peduncles, basilar pons, and medullary pyramid, before reaching the upper cervical spinal cord. Corticobulbar fibers arise in the lateral aspect of the pre-central gyrus, travel through the genu of the internal capsule and terminate in the nuclei of the pons and medulla.
Several DTI studies using single tensor deterministic tractography have shown the potential of the technique to depict the infiltration of the corticospinal tract in patients presenting low-grade gliomas near the motor and somatosensory motor areas [64–67] (Fig. 20.3). The detection of the presence of infiltrated or displaced corticospinal fibers based on the comparison of tractography reconstructions on the tumor side and on the contralateral side has been explored as a potential predictor of the extent of resection in glioma surgery [68]. Additional developments include the integration of pre-operative tractography reconstruction of the pyramidal pathway into neuronavigation systems for intraoperative visualization during glioma surgery [65, 69–71]. A prospective randomized controlled trial demonstrated the positive impact of using DTI-based neuronavigation in surgical resection of gliomas involving the pyramidal tract [181]. Other intraoperative use of tractography includes the generation of the trajectory of the pyramidal pathway from intra-operative DTI data, and the depiction of the displacement and deformation of the tract following tumor removal [72–74].
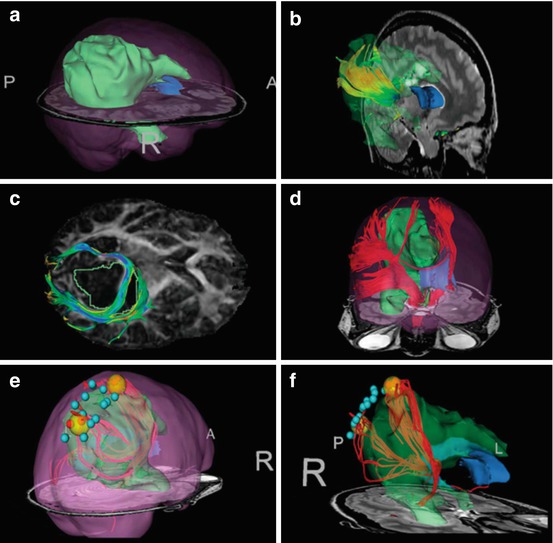

Fig. 20.3
Multi-modal neurosurgical planning data on a large right fronto-parieto-occipital oligoastrocytoma WHO grade II. (a) 3D surface model of the tumor (green) with brain outline rendering (pink). (b) Tractography seeding within high-intensity T2-bright area demonstrates tracts within tumor region. (c) Manually seeded infiltrating and displaced tracts against the diffusion tensor imaging (DTI) fractional anisotropy map. (d) Region of interest seeding from cerebral peduncle to identify corticospinal tract. Seeding region was outlined on several T2-weighted slices, and tractography was seeded within this volume. (e) and (f), offline, postoperative tract seeding from intraoperative cortical stimulation locations (red spheres, positive). The yellow spheres represent enlarged seeding area around positive sites to seed DTI tracts that do not reach the cortical surface. (Source: [66])
However, the reconstruction of the whole course of corticospinal and corticobulbar fibers from their origin to their termination is a challenge for most tractography algorithms. Standardized evaluation of deterministic, probabilistic, and global tractography approaches on patients presenting with a glioma near the motor cortex area have demonstrated that, while motor fibers projecting from the foot area can be easily identified, most methods fail to trace fibers arising from the hand and face area [75]. In particular, the intersection of the lateral portion of the pyramidal pathway with crossing fibers of the superior longitudinal fasciculus (SLF) that courses anteroposteriorly through the centrum semi-ovale poses a major difficulty to tractography methods [76]. Tractography seeding from intra-operative electrical stimulation sites corresponding to the wrist, forearm, and hand motor site showed an anterior and posterior diversion of the reconstructed tracts along the SLF [69]. A practical approach to solve this issue has been proposed based on the virtual removal of the SLF and tensor field replacement [77]. The approach demonstrated the feasibility of reconstructing the lateral projections of the corticospinal and corticobulbar tract from clinical DTI data [77]. Other attempts at overcoming fiber crossing issues in the centrum semi-ovale included the use of probabilistic tractography for the depiction of corticobulbar fibers from the face and tongue region [78], and two-tensor streamline tractography that showed improved performance when compared to single-tensor deterministic and probabilistic tractography methods [79, 80]. With the development of HARDI acquisition sequences, probabilistic q-ball tractography has demonstrated better sensitivity than deterministic and probabilistic DTI methods for the delineation of the lateral aspects of the corticospinal tract [81].
20.2.1.2 Language Pathways
Language is one of the most complex functions of the human brain. The production, perception, and understanding of speech remains an active area of research in neuroscience. In this context, study of the connectivity of the human white matter using diffusion MRI tractography has the potential to provide critical insights into the language function [82]. In the modern model of language organization, the language network is composed of a dorsal stream for mapping acoustic speech sound to articulation and a ventral stream for speech comprehension and processing [83–86].
The phonological dorsal stream is composed of long white matter fibers running around the Sylvian fissure and connecting the frontal lobe to the temporal and parietal lobe. The dorsal pathway includes the arcuate fasciculus (AF) and the superior longitudinal fasciculus (SLF). The AF connects the pars opercularis and the ventral premotor cortex to the posterior superior and middle temporal gyrus. The SLF includes five subcomponents: the first three segments SLF-I, II, and III are horizontal fibers that connect the frontal region to the parietal lobe; the fourth subdivision corresponds to the AF and the fifth segment SLF-tp connects the inferior parietal lobe to the posterior temporal lobe [87]. The subcomponents SLF II, SLF III, AF and SLF-tp are involved in language processing [88].
The semantic ventral stream is composed of white matter fibers connecting the frontal lobe with the occipital lobe and posterior temporal lobe. The ventral pathway is divided between a direct pathway corresponding to the inferior fronto-occipital fasciculus (IFOF) and an indirect pathway formed by the uncinate fasciculus (UF) and the anterior inferior longitudinal fasciculus (ILF) [89, 90]. The IFOF is an associative white matter bundle that connects the orbitofrontal cortex and the dorsolateral prefrontal cortex with the parietal, posterior temporal and occipital lobes. The UF is an associative C-shaped bundle that connects the anterior temporal lobe with the medial and lateral orbitofrontal cortex. The ILF is an associative bundle that connects the temporal lobe to the occipital cortex. Recently, two white matter pathways have been investigated as additional white matter structures involved in language function: the middle longitudinal fasciculus (MdLF) connecting the inferior parietal lobule and the superior temporal gyrus [91, 92] and the frontal aslant tract connecting the superior frontal gyrus to the pars opercularis and pars triangularis in the inferior frontal gyrus [93, 94].
Tractography reconstructions of fibers of the ventral and dorsal route have the potential to provide clinically relevant information for planning the resection of gliomas in language areas [65, 95–99]. Figure 20.4 shows an example of tractography reconstructions of IFOF, ILF, UF, AF and horizontal and vertical portion of the SLF. Pre-operative tractography reconstructions of language pathways have been integrated to neuronavigational systems to provide intraoperative visualization of the tracts [98, 101]. During surgery, visualization of the trajectory of language tracts can be used to help guide intraoperative direct electrical stimulation (DES) [65, 95, 182] and reduce the number of DES needed to locate subcortical functional sites [98]. Visual display of language tracts overlaid on the operating microscope combined with intra-operative MRI data could help maximize the extent of tumor resection with minimum postoperative morbidity [99, 101] (Fig. 20.5). In addition to depicting the trajectory of the language pathways, tractography reconstructions might provide clinically relevant information on white matter integrity based on the depiction of morphological changes, such tract displacement, partial infiltration or destruction [65, 67, 68, 102]. Finally, following surgery, tractography reconstructions of language pathways from post-operative dMRI data can be used to predict language recovery after tumor resection [103, 104]. A rating of disturbance based on altered fiber tractography (AFTD) has recently been proposed to evaluate the degree of white matter pathway injury in patients with gliomas [95]. Preliminary results on a small cohort of high-grade gliomas patients presenting with postoperative language deficit showed that AFTD ratings of post-operative tractography reconstructions of the SLF-t and AF have the potential to predict recovery of language function [95].
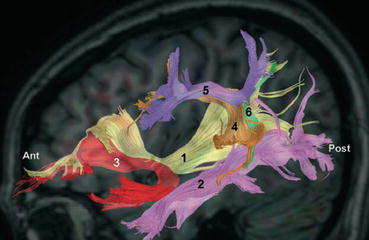
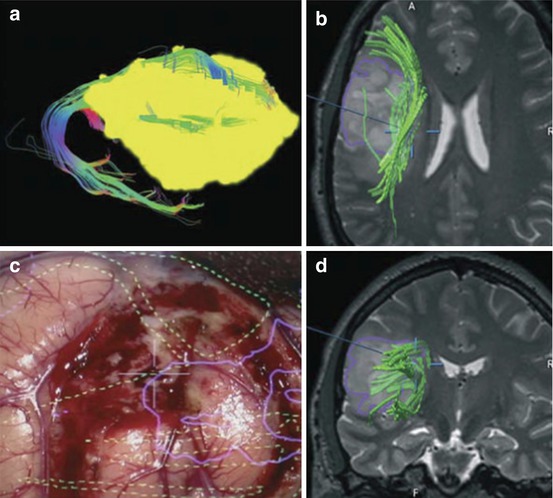

Fig. 20.4
DTI tractography reconstructions of white matter pathways of the language network. The figure shows a 3D sagittal view of (1) Inferior Fronto-Occipital Fasciculus (yellow), (2) Inferior Longitudinal Fasciculus (pink), (3) Uncinate Fasciculus (red), (4) Arcuate Fasciculus (orange), (5) horizontal segment of the Superior Longitudinal Fasciculus (purple), (6) vertical segment of the Superior Longitudinal Fasciculus (green). The tracts are overlaid on a sagittal T1-weighted image for anatomical reference. (Source: [100])

Fig. 20.5
Intra-operative visualization of tractography results in diffuse low-grade astrocytoma. (a) Lateral right view of 3D surface model of tumor (yellow) and tractography reconstruction of language fibers (multi-color). (c) microscope view with outlines in heads-up display (tumor: purple, subjacent language pathways: yellow). (b) and (d) intra-operative axial and coronal T2-weighted image with segmented tumor (purple) and DTI tractography reconstructions (green). (Source: [183])
The majority of tractography reconstructions of language pathways for the resection of low-grade gliomas used deterministic streamline fiber tracking, with seed regions defined in anatomical scans or diffusion-encoded color maps. Several groups have investigated advanced tractography methods to overcome the technical limitations of single tensor deterministic tractography for mapping the complex topography of language pathways. These sophisticated approaches include global search approaches for reconstructing the trajectory of the AF and IFOF [105], two-tensor unscented Kalman filter tractography for tracing the AF through peritumoral edema [60], and a high-definition fiber tractography approach based generalized q-ball modeling, multiple intravoxel sampling, and multi-directional fiber tracking [106]. In addition, the use of HARDI data for white matter mapping of language pathways in neurosurgery clinics has recently been explored. Multidirectional fiber tracking from compressed sensing-based reconstruction of HARDI data demonstrated the feasibility to accurately reconstruct language tracts within clinical time constraints [107, 108]. An innovative tractography workflow based on residual bootstrap probabilistic q-ball tractography of the dorsal and ventral language pathways from HARDI data enabled the reconstruction of the multiple components of the AF/SLF complex as well as the MdLF and ILF on a large cohort of brain tumor patients [95].
20.2.1.3 Visual Pathways
The optic radiation is composed of three bundles that connect the lateral geniculate body (LGN) to the primary visual cortex [180]. The posterior bundle has a straight course from the LGN to the occipital cortex. The central bundle makes an anterior curve and courses along the wall of the atrium and the occipital horn of the lateral ventricle. The anterior bundle, or so-called Meyer’s loop, makes a curve around the tip of the temporal horn, passes posteriorly around the lateral ventricles and converges on the lower lip of the calcarine fissure.
DTI tractography studies on healthy subjects have demonstrated the feasibility of tracking the optic radiation [109–112]. However, tractography reconstruction of the Meyer’s loop presents technical challenges due the curved course and sharp turn of the bundle, as well as its close proximity to the uncinate fasciculus, inferior longitudinal fasciculus, and inferior occipito-temporal fasciculus. In addition, the high intersubject variability of the anterior extent of the Meyer’s loop makes the prediction of its precise location in an individual patient difficult [113].
Studies have reported the added value of tractography reconstructions for gliomas near the optic radiation and optic [66, 114–116]. Exploratory approaches have been proposed for tracing the optic radiation, including increasing the number of diffusion sensitizing gradient directions [117], reducing the voxel size to 0.9 mm [118], and seeding from multiple fiducial volumes [119, 120]. A pilot study combining HARDI-based tractography with compressed-sensing techniques on patients presenting with a low-grade glioma in the left temporal lobe showed significant improvements of the reconstruction of the optic radiation when compared with DTI-based fiber tracking [107, 108].
20.2.2 Combining Tractography Reconstructions and Functional Data
A challenge in DLGG resection is the preservation of cortical structures and subcortical white matter pathways associated with essential function. While diffusion MRI tractography provides a unique window on the architecture of the brain white matter, the information is purely anatomical. Tractography reconstructions depict the trajectory of a tract associated with motor, language, or vision, but they do not indicate to the surgeon whether the tract is still functional or not. Current techniques for mapping brain function include functional Magnetic Resonance Imaging and direct electrical stimulation. The following section examines how these techniques can be combined to the anatomical information derived from diffusion MRI tractography.
Functional Magnetic Resonance Imaging (fMRI) enables non-invasive localization of regions of the brain that are activated when a subject performs a task. The technique uses the blood oxygenation level dependent (BOLD) change as a surrogate marker for neuronal activity. BOLD maps can be superimposed on a high-resolution T1-weighted image to enable depiction of brain regions activated during motor, language, and visual tasks. Pre-operative fMRI activation maps have been used to identify eloquent cortex in the vicinity of gliomas [121, 122, 184]. The integration of fMRI and diffusion MRI has been performed using fMRI activation maps and subjacent white matter regions as seed regions for tractography reconstruction [64, 66, 123, 124]. Such integration could provide clinically relevant information on the spatial relationship between functional cortical areas and their associated tracts. Since fMRI is non-invasive, data acquisition and analysis can be repeated at several time points for patient follow-up. However, the technique is sensitive to motion-related artifacts and signals from large draining veins [122]. In addition, both fMRI and tractography techniques provide only indirect surrogate markers of the location of eloquent tracts: activation maps derived from fMRI data represent blood flow and tractography maps derived from diffusion MRI data represent anisotropic water diffusion. The difficulty in validating fMRI and dMRI findings prevents the techniques from being used as stand-alone tools for clinical decision-making. Nevertheless, the integration of fMRI and dMRI data enables the evaluation of one technique against the other.
Intraoperative direct electrical stimulation (DES) is the gold standard to identify the location of cortical regions and subcortical white matter pathways associated with critical function prior to gliomas resection [62, 125–130, 185]. Cortical positive DES sites can be used as tractography seeds for the reconstruction of motor and language tracts [69, 131]. Visualization of the location and trajectory of white matter pathways provided by pre-operative tractography reconstructions might help guide to the location of subcortical DES sites during awake surgery [70, 98]. The comparison of pre-operative tractography reconstructions of language and motor pathways with intraoperative cortical and subcortical stimulation sites during awake mapping showed an acceptable, although not optimal, correlation between the tracts depicted as intact on tractography maps and the sites eliciting positive motor or language response during stimulation [65, 68, 81, 97, 132]. Similarly, studies in low-grade insular gliomas have reported an acceptable correspondence between the complete disruption of the IFOF, as displayed by pre-operative DTI tractography reconstructions, and the absence of eloquent function identified by intraoperative subcortical stimulation [133]. Thus, the depiction of tract integrity could help predict the presence or absence of response during intraoperative DES of subcortical areas. From a neuroscientific point of view, combining language disturbance elicited by electrical stimulation with anatomical information provided by DTI represents a unique opportunity to study the anatomo-functional connectivity of language [62, 94, 131]. Neurosurgical findings in patients presenting with a glioma in the frontal lobe have contributed to advance knowledge on the role the frontal-striatal tract and fronto-aslant tract in language function [94, 103, 104, 134].
20.2.3 Current Challenges and Limitations of Tractography
Tractography is gaining increasing interest in the neurosurgical community due to the availability of diffusion MRI pulse sequences on most clinical scanners in Radiology departments, and the dissemination of fiber tracking tools integrated into commercial neuronavigation systems or available as open-source software. However, converting the neuroanatomical information contained in diffusion MRI data into individualized patient maps remains a difficult task. The following section presents the current challenges and limitations of using tractography for neurosurgical decision-making.
As described in the first part of the chapter, anatomical regions where fibers cross, bend or fan pose a challenge to tractography techniques. While advanced diffusion models developed by academic centers have demonstrated improvement in the depiction of complex fiber configurations, most commercial tractography packages use the single tensor model, which cannot resolve fiber crossings in voxels with multiple fiber populations. The difference between the size of DWI voxels, in the order of a few millimeters, and the diameter of axons, in the order of a few microns, results in partial volume effects which can corrupt tractography results [135]. Diffuse low-grade gliomas pose an additional level of difficulty for fiber tracking as tumor infiltration can induce changes in the diffusion anisotropy properties of tissues that can confound tractography algorithms. As a result, some intact tracts within or at the periphery of gliomas can remain undetected by tractography algorithms.
Stay updated, free articles. Join our Telegram channel

Full access? Get Clinical Tree


