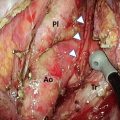
Fig. 3.1
Normal CT anatomy of the hypopharynx and cervical esophagus. (a) Contrast-enhanced axial CT image obtained at the level of the hypopharynx. The ossified cricoid cartilage (Cr) is identified as a “U-shaped” structure at this level because the anterior arch is lower than the posterior lamina of cricoid cartilage. A posterior aspect of the subglottic laryngeal airway (Sg) is convex along the internal surface of the lamina of cricoid cartilage. The hypopharynx is a flattened ellipsoid structure on axial image as the inferior pharyngeal constrictor partly arises from the inferior cornu (I) of thyroid cartilage on both sides. The hypopharynx at this level consists of anterior “postcricoid portion (open circle)” and “posterior pharyngeal wall (asterisk).” C common carotid artery, J internal jugular vein, Th (superior pole of) thyroid gland. (b) Contrast-enhanced axial CT image of the cervical esophagus. The cervical esophagus identified as an oval structure posterior to the trachea (Tr) shows a circumferential zonal anatomy. It seemingly consists of three layers: an inner enhancing layer representing the mucosa (asterisk), outer soft tissue attenuation layer (open cirlce) representing the muscularis propria, and low-attenuation submucosal fat between them. A posterior aspect of the trachea is concave because of indentation of the cervical esophagus upon the membranous portion (arrows) of the trachea. C common carotid artery, J internal jugular vein, Th thyroid gland
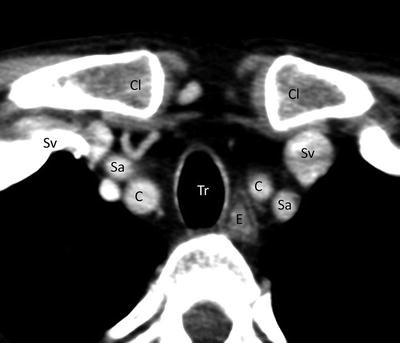
Fig. 3.2
Normal CT anatomy of the thoracic inlet. Contrast-enhanced axial CT image. The esophagus (E) deviates to the left, whereas the trachea (Tr) stays in the middle. C common carotid artery, Cl clavicle (sternal end), Sa subclavian artery, Sv subclavian vein
3.2.2 Zonal Anatomy of the Esophageal Wall
The esophageal wall consists of mucosa, muscularis mucosae, submucosa, muscularis propria, and adventitia. EUS can differentiate such layers to determine the depth of tumor invasion into the esophageal wall (Fig. 3.3) [3]. Mucosal enhancement may be visible on contrast-enhanced CT (Figs. 3.1b and 3.2) and contrast-enhanced MRI.
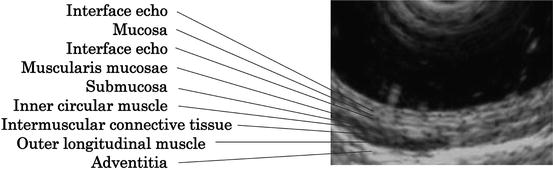
Fig. 3.3
EUS of the normal esophagus (by courtesy of Dr. Gohda, Department of Endoscopy, The Jikei University School of Medicine). EUS differentiates nine layers of the esophageal wall
3.3 T Staging by Imaging
T staging of the esophageal cancer is principally defined by depth of invasion. Because the esophagus lacks a serosa, there is no anatomic barrier to prevent rapid local invasion of the tumor into the mediastinum. As a result, esophageal cancer can easily spread to adjacent structures in the neck or thorax, including the trachea, thyroid gland, larynx, bronchi, aorta, lung, pericardium, and diaphragm [4]. Involvement of the adjacent structures in the mediastinum is classified as T4 disease which is further divided into two: resectable disease (T4a) and unresectable disease (T4b) [1].
An important goal of clinical T staging is the identification of tumor invasion of mediastinal structures, since affected patients may not be suitable candidates for surgical resection [5]. Depth of tumor invasion is one of the criteria used to select multimodality therapy instead of primary surgery [5].
Imaging modalities should be complementary to stage the primary lesion; EUS precisely shows tumor invasion mainly localized in the esophageal wall (defined as T1-3). On the other hand, cross-sectional imaging such as CT and MRI is useful to detect tumor invasion to the adjacent structures beyond the adventitia (defined as T4). This chapter mainly focuses on CT and MRI.
3.3.1 Barium Esophagography
Barium esophagography is commonly performed as an initial examination to evaluate patients with dysphagia/odynophagia which may be the first manifestation of esophageal cancer.
Single-contrast technique is suitable to assess passage and wall rigidity and characterize strictures. Double-contrast technique allows the assessment of mucosal irregularity such as elevated and ulcerative lesions although double-contrast images of good quality may not be obtained distal to high-grade obstructive disease.
Barium esophagography is very helpful to determine longitudinal extent and location of the disease relative to anatomical landmarks such as the tracheal bifurcation; to which esophageal division does the lesion belong? This is necessary to set an appropriate field of radiotherapy (RT).
On esophagograms, early esophageal cancers manifest as small polypoid or plaquelike lesions or superficial spreading lesions, whereas advanced esophageal cancers manifest as infiltrating, polypoid, ulcerative, or varicoid lesions (Figs. 3.4 and 3.5) [6]. Typical findings of advanced diseases include an irregular stricture (Figs. 3.4, 3.5, and 3.6a), mass-like filling defect (Fig. 3.7a), or ulcer (Fig. 3.4) on single-contrast images, and an abrupt change in caliber and contour (Fig. 3.6b) or irregularly shaped mass on double-contrast images. The Japan Esophageal Society uses a classification system based on the macroscopic appearance of esophageal cancer [7].
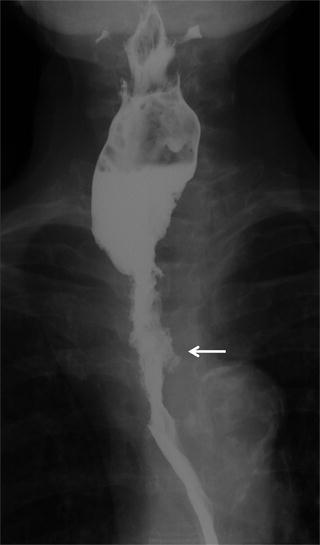
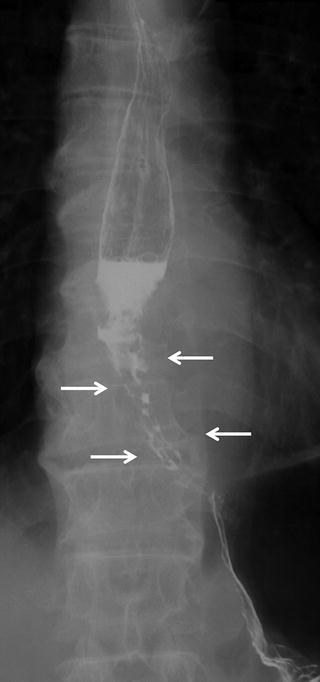
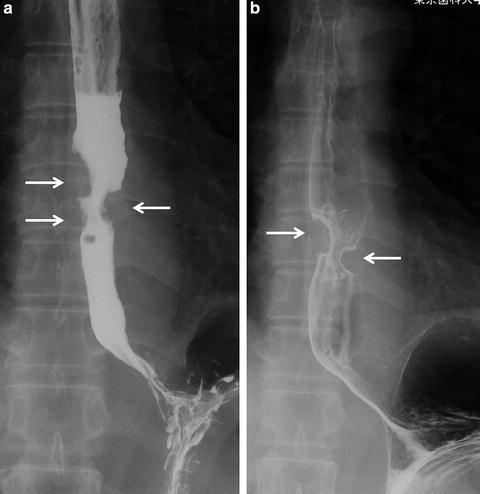
Fig. 3.4
Esophageal cancer (upper thoracic esophagus). On single-contrast barium esophagography there is an irregular stricture of the esophagus (Ut) associated with ulceration (arrow)
Fig. 3.5
Esophageal cancer (lower thoracic esophagus). Barium esophagography shows an irregular stenosis and varicoid appearance of the lower thoracic esophagus (arrows)
Fig. 3.6
Esophageal cancer (middle thoracic esophagus). Single-contrast image (a) and double-contrast image (b) of barium esophagography reveal an irregular stricture and abrupt caliber change of the middle thoracic esophagus (arrows)
Double-contrast esophagography has a sensitivity of greater than 95 % in the detection of esophageal cancer [8]. When malignancy suggested on barium esophagogram, a positive predictive value is approximately 40 %. And endoscopically proven esophageal cancers were found on barium esophagogram in 98 % [8, 9].
The synchronous second primary lesion must be carefully inspected. Tracheoesophageal fistula may be demonstrated when resulting from the tumor invasion (Fig. 3.8a).
3.3.2 EUS
EUS allowing visualization of the distinct layers of the esophageal wall (Fig. 3.3) can accurately demonstrate the depth of tumor invasion. It is useful in distinguishing T1 and T2 lesions.
However, EUS has several limitations in T staging: one is that the accuracy is highly operator dependent and another is evaluation of non-traversable, stenotic tumors. There is a known failure rate of 14–25 % because of stenotic lesions that prevent the passage of the endoscope [10, 11], EUS and CT should be used as complementary methods for TNM staging of esophageal cancer [12].
EUS is also useful to determine regional lymph node involvement. Combined use of fine-needle aspiration and EUS can improve assessment of lymph node involvement [5].
3.3.3 CT
Patients with esophageal cancer are best staged by CT, despite recognizing difficulties in determining local irresectability and mediastinal node involvement [13–15]. With the advent of multi-detector CT, it allows more accurate staging of the disease [5]. CT has been the mainstay for staging newly diagnosed esophageal cancer. The increasing use of EUS and PET has improved the staging algorithm for it. Currently, combined use of CT, EUS, and PET is advocated to determine whether a patient should be treated with surgery, chemotherapy, or a chemoradiation therapy [5].
In practice, CT is recommended for initial imaging following confirmation of esophageal cancer at pathologic analysis. The N and M status can be evaluated by CT at the same time.
CT is limited in determining the exact depth of tumor infiltration of the esophageal wall and considered to be unable to adequately help differentiate between T1, T2, and T3 disease. However, CT is useful to distinguish between T3 and T4 lesions and to rule out unresectable (T4a) or distant metastatic disease (Figs. 3.7b and 3.9a).
3.3.3.1 CT Study Protocol and Optimal Phase for the Evaluation
CT examination should be inclusive from the neck through the entire upper abdomen to evaluate T, N, and M factors. Intravenous administration of contrast material is necessary. Optimal timing of image acquisition is a little bit controversial, depending on what should be evaluated by CT. Pre-contrast and post-contrast of delayed phase images are sufficient to evaluate N and M factors. On the other hand, some investigators recommend an arterial phase (on dynamic study) to detect the primary lesion (T factor) which may be better evaluated by EUS.
Umeoka et al. reported that the 2nd arterial phase of dynamic CT (35 sec after attenuation of 200HU was obtained at the descending aorta) is the optimal phase for visualization of esophageal cancer [16]. In their other report early esophageal rim enhancement on arterial phase of dynamic CT that was identified only in T3/T4 diseases could improve preoperative differentiation between T1/T2 and T3/T4 diseases [17].
Holsher et al. reported that the sensitivity values of the T staging in the arterial phase were 0 % in T1a, 71.4 % in T1b, 12.5 % in T2, 89.5 % in T3, and 100 % in T4. The sensitivity values in the venous phase were 0 % in T1a, 14.3 % in T1b, 0 % inT2, 94.7 % in T3, and 100 % in T4 [12].
Venous phase images are necessary to evaluate mediastinal adenopathies and metastatic liver tumors. Yoon et al. reported that 80 % of esophageal cancers were detectable on post-contrast CT in the venous phase although nearly 70 % of T1 lesions were missed [18].
3.3.3.2 Diagnostic Criteria of the Esophageal Cancer
Esophageal Wall Thickness
In general, CT is considered incapable of distinguishing the layers of the esophageal wall. Wall thickening of the esophagus is the most important CT feature to detect the esophageal cancer and its (mainly, longitudinal) extent. Precise localization of the esophageal cancers is helpful for planning radiation therapy.
Generally, any esophageal wall thicker than 5 mm is considered abnormal (Figs. 3.7b, 3.8b, and 3.9a) [19]. Wall thickness more than 5 mm is the criterion for abnormal wall thickening of the esophagus, suggested by an M.D. Anderson study without consideration of the status of the esophagus [20, 21]. Moss et al. proposed criteria as follows: the esophageal wall thicker than 5 mm is abnormal on CT images (Moss stages II); thickness of the esophageal wall between 3 and 5 mm indicated early lesions that did not make the wall apparently thickened (Moss stages I) [22].
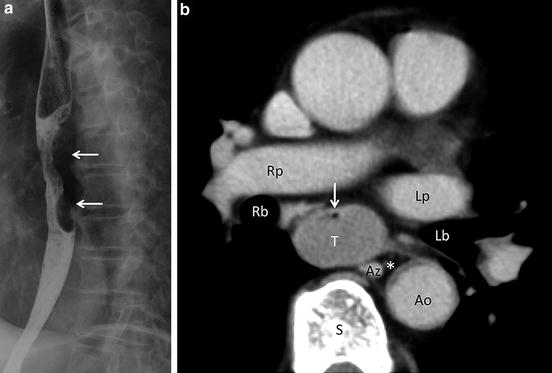
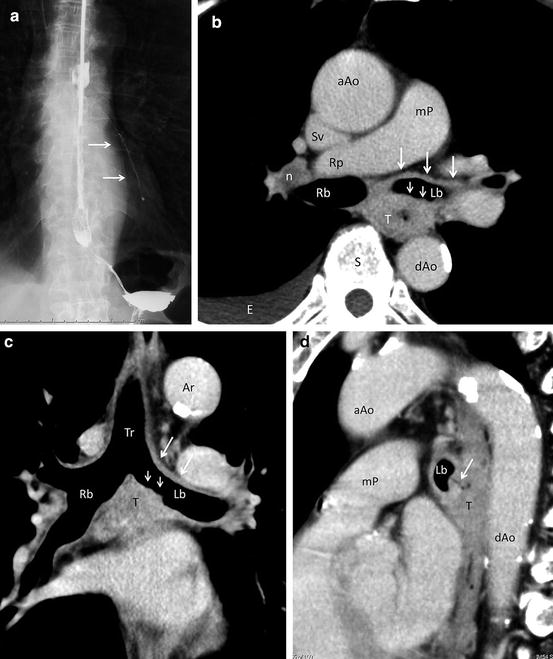
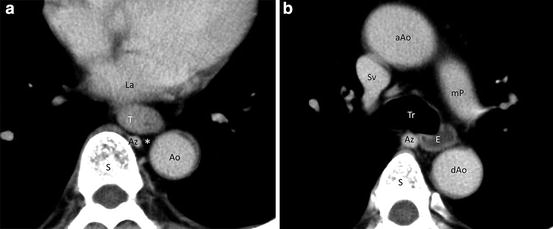
Fig. 3.7
Esophageal cancer (middle thoracic esophagus). (a) Barium esophagography shows an irregularly shaped, mass-like filling defect (arrows) in the lower thoracic esophagus. (b) Contrast-enhanced axial CT image at the level of the middle thoracic esophagus. Asymmetrical wall thickening forms a soft tissue mass (T) in the distended middle thoracic esophagus. Narrowing esophageal lumen is identified as an eccentric area of air density (arrow). A fat plane around the esophagus is entirely preserved, and a triangular fat space (asterisk) among the esophagus, aorta (Ao), and spine (S) is also maintained. Such findings exclude T4 disease with high degree of confidence. Az azygos vein, Lb left main bronchus, Lp left pulmonary artery, Rb right main bronchus, Rp right pulmonary artery
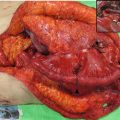
Fig. 3.8
Esophageal cancer (middle thoracic esophagus). Esophagography (a) shows contrast material leaking into the left main bronchus and lower lobe bronchi (arrows). Contrast-enhanced axial CT image at the level just below the tracheal bifurcation (b) and coronal image at the level of the tracheal bifurcation (c) show an irregular and circumferential wall thickening of the esophagus representing esophageal cancer (T). An irregular interface (small arrows) between the tumor (T) and air density within the left main bronchus (Lb) and diffusely infiltrative change (large arrows) along the left main bronchus strongly suggest bronchial invasion. Metastatic hilar adenopathy (n) and right pleural effusion (E) are also noted (b). Reformatted sagittal image (d) well depicts a fistula (arrow) between the tumor (T) and a posterior aspect of left main bronchus (Lb). aAo ascending aorta, Ar arotic arch, dAo descending aorta, mP main pulmonary artery, Rb right main bronchus, Rp right pulmonary artery, S spine, Sv superior vena cava
Fig. 3.9
Esophageal cancer (lower thoracic esophagus). (a) Contrast-enhanced axial CT image at the level of Lt shows asymmetrical wall thickening of the lower thoracic esophagus (T). Integrity both of an entire fat plane around the esophagus and of a triangular fat space (asterisk) among the esophagus, aorta (Ao), and spine (S) is maintained, excluding T4 disease. Az azygos vein, La left atrium. (b) Contrast-enhanced axial CT image at the level of the tracheal bifurcation. The esophagus (E) proximal to the esophageal cancer (a) is distended with fluid attenuation. The esophagus at this level has even thin wall measuring approximately 2 mm. aAo ascending aorta, Az azygos vein, dAo descending aorta, mP main pulmonary artery, S spine, Sv superior vena cava, Tr trachea
The esophageal wall thickness seems to largely depend on the status of the esophagus. The esophageal wall thicker than 3 mm is abnormal when the esophagus is distended [22, 23]. Xia et al. reported that normal esophagus has a wall thickness around 5 mm in contraction status, 3 mm in dilatation (Fig. 3.9b) and roughly no more than 5.5 mm in any status [20]. In their study the largest wall thickness of the esophagus was 4.70 mm in contraction and 2.11 mm in dilatation. When dilating, the esophageal wall thickness was between 1.87 and 2.70 mm and the cervical esophageal wall was the thickest. When contracting, wall of the abdominal esophagus is thicker than the cervical and thoracic esophagus. They also reported that average of esophageal wall thickness was about 1 mm larger in males than females. Age and the thickness of subcutaneous fat had no significant impact on the esophageal wall thickness [20].
Other Features
High-resolution, post-contrast CT of good quality may differentiate three layers of the esophageal wall; a well-enhancing inner layer, fat-attenuation middle layer, and poorly enhancing outer layer representing the mucosa, submucosal fat, and muscularis propria, respectively (Figs. 3.1b, 3.2, and 3.10). An external contour of the outer layer should be surrounded by the adventitia. Theoretically, understanding of such zonal anatomy helps estimating depth of tumor invasion for T staging of the esophageal cancer. When the outer layer (muscularis propria) is preserved, the disease is assigned as T1 (Fig. 3.11). When the outer layer is partly encroached by a moderately enhancing tumor, the disease is assigned as T2. The transmural tumor invasion of the outer layer (muscularis propria) suggests T3 disease (Figs. 3.12 and 3.13) when the external contour of the esophagus is smooth and/or fat planes around the esophagus are preserved and T4 disease when the external contour of the esophagus is irregular and fat planes between the esophagus and adjacent structures are obliterated (Figs. 3.8 and 3.14). However, such differentiation of each layer of the esophageal wall is not always possible.
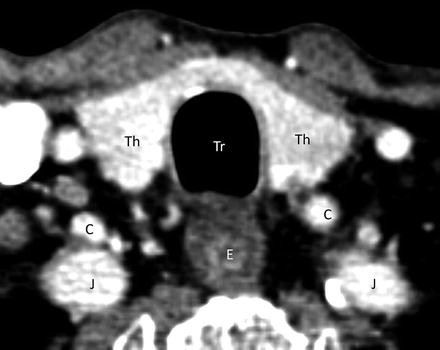
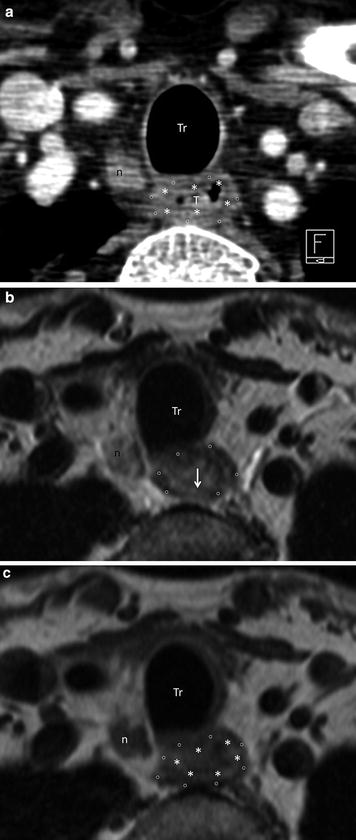
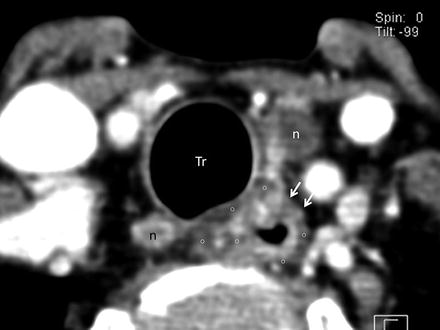
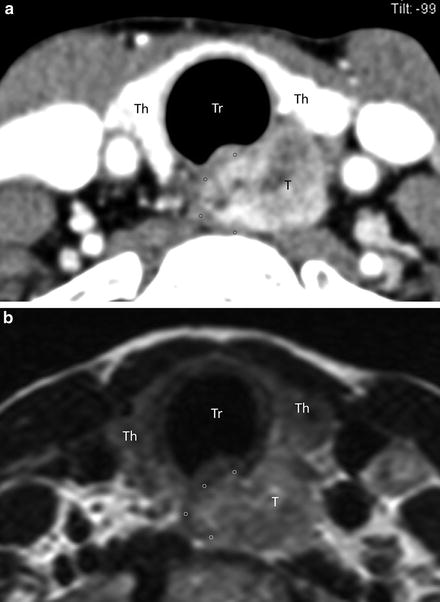
Fig. 3.10
Zonal anatomy of the esophageal wall on CT. Contrast-enhanced axial CT image of the cervical esophagus reveals three different layers of the esophageal (E) wall: the inner enhancing layer, middle fatty layer, and outer soft tissue density layer representing the mucosa, submucosal fat, and muscularis propria, respectively. C common carotid artery, J internal jugular vein, Th thyroid gland, Tr trachea
Fig. 3.11
Esophageal cancer (cervical esophagus; T1). Contrast-enhanced axial CT image of the level of the cervical esophagus (a) shows a nodular lesion (T) arising from the posterior aspect of esophageal wall. A fatty submucosal layer (asterisk) and soft tissue muscular layer (open circle) are entirely maintained. Metastatic adenopathy of the right paratracheal node (n) is noted. On T2-weighted axial image (b) the indistinct low-intensity muscular layer (open circle) at the posterior aspect (arrow) raises possibility of partial invasion of the muscularis propria (T2 disease). However, both the high-intensity submucosal fat (asterisk) and tissue-intensity muscular layer (open circle) are well preserved on T1-weighted image (c). Findings on T1-weighted axial image (c) exclude deep invasion to the muscularis propria and radiologically suggest T1 disease. n enlarged paratracheal node, Tr trachea
Fig. 3.12
Esophageal cancer (cervical esophagus; T3). Contrast-enhanced axial CT image at the level of the cervical esophagus differentiates the inner enhancing mucosal layer and outer poorly enhancing muscular layer (open circle). The relatively thickened inner layer at the anterior aspect represents the primary lesion. A combination of a focal encroachment of the muscular layer (arrows) and smooth external contour of the esophagus suggests T3 disease. There are metastatic paratracheal nodes (n) on both sides. Tr Trachea
Fig. 3.13


Esophageal cancer (cervical esophagus; T3). Contrast-enhanced axial CT image (a) and T2-weighted axial image (b) at the level of the cervical esophagus show an infiltrative tumor (T). No detectable muscular layer (open circle) on the left side without loss of tissue planes among the esophagus and adjacent structures is suggestive of T3 disease. Th thyroid gland, Tr trachea
Related posts:
Stay updated, free articles. Join our Telegram channel
Full access? Get Clinical Tree
