FIGURE 2.1
The level of 1.2 g/l was adopted as the level separating those with definitely elevated levels of apoB (i.e. ≥ 1.2 g/l) from those without definitely elevated levels because at that time it corresponded to the 75th percentile of apoB in the American population and also to the value that allowed the best diagnosis of patients with familial combined dyslipidemia. Subsequently, at least in the United States, the average levels of lipids and apoB have decreased and a level of apoB of 1.2 g/l now corresponds to the 90th percentile of the American population. However, we have maintained our original definitions and this will, of course, reduce the number classified as HyperapoB.
Nevertheless, the critical point, the point that must not be obscured by any classification, is that the actual level of risk attributable to apoB depends on the actual level of apoB. Risk increases exponentially as apoB increases. The risk attributable to an apoB of 1.15 g/l is not materially different from an apoB of 1.20 g/l.
2.2.1.2 NormoapoB: NormoTG < 1.5 mmol/l versus HyperTG ≥ 1.5 mmol/l
Next, each of these categories – NormoapoB and HyperapoB – is subdivided into two groups on the basis of plasma triglyceride. A plasma triglyceride ≥ 1.5 mmol/l was chosen as the cut point because this is the level at which small cholesterol-depleted LDL particles become common. We will start with NormoapoB, which is divided into NormoTG NormoapoB and HyperTG NormoapoB.
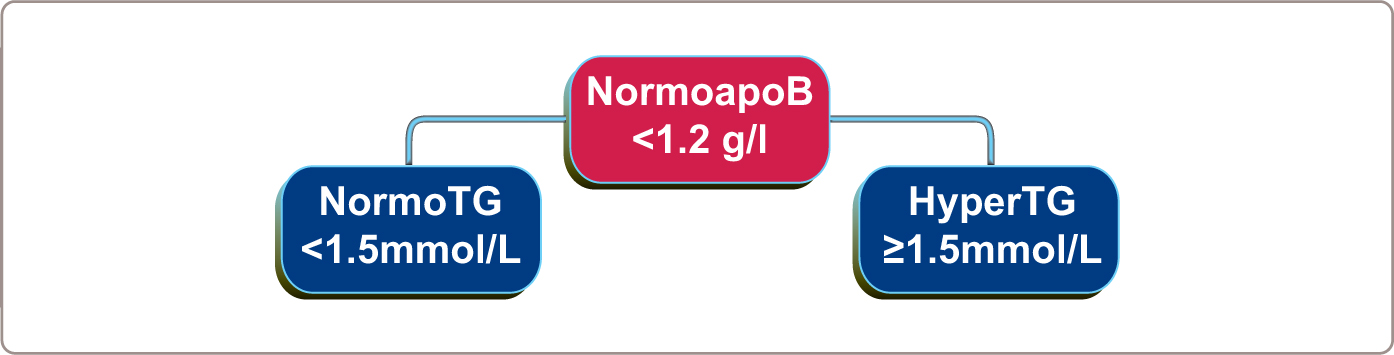
FIGURE 2.2
2.2.1.3 NormoTG NormoapoB
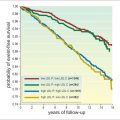
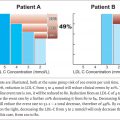
NormoTG NormoapoB includes normal – those with normal lipids and normal apoB and two other phenotypes. First, an important variant of normal is an increased LDL-C ≥ 3.5 mmol/l (> 130 mg/dl) with a normal apoB ( < 1.2 g/l), a phenotype that corresponds to a normal number of cholesterol-enriched particles. This phenotype is present in between 5-10% of the American population and is not associated with any increased cardiovascular risk over a 20-year follow-up period. Unless apoB is measured, these patients cannot be distinguished from those with elevated LDL-C and elevated apoB, who are at increased cardiovascular risk. Unless the correct diagnosis is made, unnecessary concern and treatment may well ensue. Second, an increased cholesterol, also without elevated apoB, can be due to increased LpX, the abnormal lipoprotein particles that are present in biliary cirrhosis and cholestasis and do not appear to convey any increased cardiovascular risk.
2.2.1.4 HyperTG NormoapoB: TG/ApoB ≥ 10
The first step to separate the NormoapoB phenotypes with hypertriglyceridemia is to separate them based on TG/apoB ratio. Those with a TG/apoB ratio ≥ 10 (TG in mmol/l and apoB in g/l) are then subdivided into those with an apoB ≥ 0.75 g/l and those with an apoB < 0.75 g/l.
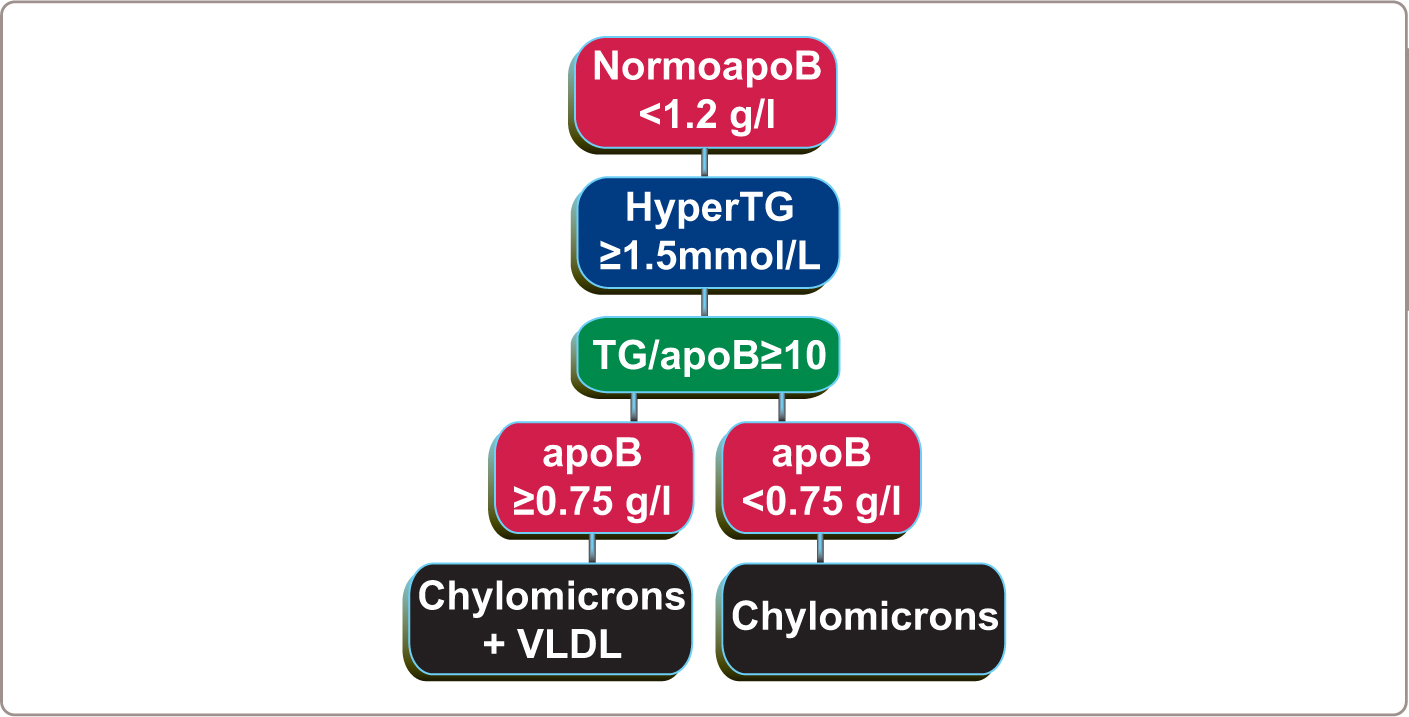
FIGURE 2.3
2.2.1.5 HyperTG NormoapoB: TG/apoB ≥ 10 and apoB ≥ 0.75 g/l
Patients with a TG/apoB ≥ 10 and an apoB ≥ 0.75 g/l are characterized by an increased number of chylomicron and VLDL particles. Most commonly, this phenotype is present in those with a partial deficiency of lipoprotein lipase (LPL) plus a secondary factor such as diabetes mellitus, glucocorticoids, or estrogen therapy (further reading in Chapter 3 and 4 ). Typical values for this phenotype compared with normal are presented in Table 2.1 . Plasma total cholesterol is dramatically elevated as are plasma triglycerides. Plasma total cholesterol is elevated due to cholesterol in chylomicron and VLDL particles, whereas cholesterol in LDL and HDL particles is low. Plasma triglyceride levels are elevated due to the presence of an increased number of chylomicron and VLDL particles. Plasma apoB and LDL apoB are normal although VLDL apoB is twice normal. Given that cardiovascular risk is not substantially elevated in these patients, this argues against normal VLDL particles markedly increasing cardiovascular risk. In this and the other hypertriglyceridemic states LDL particles will be cholesterol depleted and triglyceride enriched whereas VLDL particles are cholesterol and triglyceride enriched.
In table 2.1 to 2.6 average composition of all apoB and apoA lipoprotein particles in the six apoB dyslipoproteinemias are presented. A set of normal values has been compiled by the Lipid Clinic at Laval University and these are compared to those that are typical for the apoB dyslipoproteinemias.75,88,204 The lipoproteins classes were separated by ultra cen – trifugation allowing composition to be determined for each.
Table 2.1
Average composition of all apoB and apoA1 lipoprotein particles in patients with hyperTG normoapoB due to the presence of VLDL and chylomicron particles.
HyperTG normoapoB due to VLDL and chylomicrons (n = 101) | NormoTG NormoApoB (n = 440) | |
|---|---|---|
Age (yrs) | 38.9±13.3 | 29.8±19.7 |
Gender (M/F) | 81/20 | 240/200 |
Plasma Total Cholesterol mmol/l | 8.23±4.17 | 4.99±0.84 |
Chylomicron-Cholesterol | 4.75±3.39 | — |
VLDL-Cholesterol | 1.66±1.20 | 0.34±0.16 |
LDL-Cholesterol | 1.56±1.19 | 3.37±0.71 |
HDL-Cholesterol | 0.61±0.18 | 1.28±0.36 |
Non-HDL Cholesterol | 7.62±4.18 | 3.71±0.73 |
Plasma Triglycerides (TG) mmol/l | 17.35±14.74 | 0.99±0.28 |
Chylomicron-TG | 13.34±14.50 | 0.27 |
VLDL-TG | 2.92±1.88 | 0.54±0.24 |
LDL-TG | 0.50±0.23 | 0.23±0.07 |
HDL-TG | 0.48±0.21 | 0.22±0.05 |
Plasma-apoB g/l | 0.96±0.41 | 0.97±0.17 |
VLDL-apoB | 0.26±0.17 | 0.097±0.04 |
LDL-apoB | 0.70±0.32 | 0.87±0.16 |
HDL-apoAI g/l | 1.04±0.27 | 1.25±0.23 |
2.2.1.6 HyperTG NormoapoB: TG/apoB ≥ 10 and apoB < 0.75 g/l
Patients with a TG/apoB ≥ 10 and an apoB < 0.75 g/l are characterized by an increased number of chylomicron particles. The primary causes of this phenotype, which markedly increases the risk of pancreatitis, are complete deficiency of LPL or apoCII, the essential cofactor for lipoprotein lipase (LPL). Very unusual causes of this phenotype include systemic lupus erythematosus, due to antibodies which interfere with the action of LPL and defect in GPI-anchored HDL binding protein and apoAV deficiency (further reading in Chapter 3 and 4 ). Average values for affected patients compared with normal are given in Table 2.2 . Whereas plasma triglyceride is profoundly elevated, indices of plasma cholesterol are not and apoB is frankly low. Plasma total cholesterol is the consequence of the cholesterol in an increased number of chylomicrons whereas the mass of cholesterol in LDL and HDL particles is profoundly low. Plasma triglycerides are elevated due to presence of the increased number of chylomicron particles, whereas the contribution of LDL and VLDL particles to plasma triglyceride levels is nil. Plasma apoB is low due to the very low number of LDL particles. These create the diagnostic features of the disorder.
Table 2.2
Average composition of all apoB and apoA1 lipoprotein particles in patients with hyperTG normoapoB due to the presence of chylomicron particles.
HyperTG normoapoB due to chylomicrons (n = 16) | NormoTG NormoApoB (n = 440) | |
|---|---|---|
Age (yrs) | 33.5 ± 14.3 | 29.8 ± 19.7 |
Gender (M/F) | 10/6 | 240/200 |
Plasma Total Cholesterol mmol/l | 4.88 ± 2.29 | 4.99 ± 0.84 |
Chylomicron Cholesterol | 3.36 ± 2.90 | — |
VLDL-Cholesterol | 0.23 ± 0.13 | 0.34 ± 0.16 |
LDL-Cholesterol | 0.73 ± 0.58 | 3.37 ± 0.71 |
HDL-Cholesterol | 0.41 ± 0.17 | 1.28 ± 0.36 |
Non-HDL Cholesterol | 4.47 ± 2.32 | 3.71 ± 0.73 |
Plasma Triglycerides (TG) mmol/l | 19.04 ± 12.95 | 0.99 ± 0.28
Related posts: ApoB Lipoprotein Particles: the preferred Treatment Target in Primary and Secondary Prevention ApoB Lipoprotein Particles: the preferred Treatment Target in Primary and Secondary Prevention
 Secondary ApoB Dyslipoproteinemias Secondary ApoB Dyslipoproteinemias
 ApoB in Cardiovascular Risk Prediction ApoB in Cardiovascular Risk Prediction
 The Future of ApoB: Moving from the Risk Prediction Paradigm to the Causal Exposure Paradigm The Future of ApoB: Moving from the Risk Prediction Paradigm to the Causal Exposure Paradigm
 The Primary ApoB Dyslipoproteinemias The Primary ApoB Dyslipoproteinemias
 The Life History of ApoB Lipoprotein Particles The Life History of ApoB Lipoprotein Particles
Stay updated, free articles. Join our Telegram channel
Full access? Get Clinical Tree
 Get Clinical Tree app for offline access

|