Diagnosis of osteosarcopenia—Quantitative imaging
Introduction
The prevalence, importance, and impact of osteosarcopenia and its constituent syndromes (osteoporosis and sarcopenia) have been covered in previous chapters. Here, we briefly focus on the role of imaging in osteosarcopenia diagnosis. The science of quantitative imaging of all tissues, including the musculoskeletal system, is still an evolving field. However, due to the bone architecture complexity, including heterogeneity pattern of materials, in addition to imaging challenges such as beam hardening and edge effects, imaging and image analyses of musculoskeletal tissues becomes a complex task. In addition, gradual deposition of fat into muscle fibers creates an intermediate tissue between fat and muscle, that to our knowledge, no in vivo imaging technique is still capable of differentiating.
Regarding the above limitations and several others, we briefly review the current in vivo imaging-based techniques of osteosarcopenia diagnosis.
Learning outcomes
After reading the chapter, you may
- ●
know the imaging-based current methods for diagnosis of osteosarcopenia
- ●
understand the usefulness and potential of the common imaging tools in diagnosing osteosarcopenia
- ●
know the major limitations of the existing imaging tools in diagnosing osteosarcopenia
- ●
understand the possible roles of fat infiltration into bone and muscle in driving their decline by age
Nonimaging techniques
Bioelectrical impedance analysis (BIA) and bioelectrical impedance spectroscopy (BIS), although not imaging techniques, deserve a brief discussion in this chapter. The indirect quantification of bone, muscle, and fat masses by BIA is based on the electric conductivity of the tissues, which is dependent on their water and electrolyte content . Therefore, the hydration status of the subjects significantly impacts the estimation of tissue masses . Also, the presence of metals that are very common in older adults (e.g., large orthopedic prostheses, surgical staples, etc.) can significantly impact the estimation of tissue masses. As BIA scales require the person to stand for a few seconds, the technique can prove to be a challenge in older adults with severe weakness and balance problems.
Nevertheless, where imaging modalities are not available, after considering the limitations, BIA can prove helpful in the primary care setting, especially in remote areas where direct imaging is not available. Both BIA and BIS show a reasonable correlation with muscle function in uncomplicated cases . However, BIA has not been standardized on a large scale for the diagnosis of sarcopenia .
Two-dimensional imaging techniques
Quantitative ultrasonography (QUS) : Ultrasound imaging is a well-established modality to assess soft tissue . Also, ultrasound wave velocity in bone (usually the calcaneal bone) has been used to evaluate bone mineral density (BMD) and fracture risk prediction .
The issue with all quantitative ultrasound techniques is low sensitivity and specificity. For example, flexor and extensor muscles of the knee have a very low association with muscle volume determined by magnetic resonance imaging (MRI) . In the authors’ hands, the repeatability of the ultrasound measurements has been proven low. This might be the reason for the contradiction in the validity for muscle mass quantification by the technique , as the operator seems to be a critical factor in the measurements. There is also a lack of agreement on the regions of interest for the assessment of sarcopenia using QUS. Currently, two major protocols that include 9-site and 5-site are not considered practical in the clinical setting due to their complexity . At best, the bone mineral density (BMD) measured by OUS shows a modest association with dual-energy X-ray absorptiometry (DXA) (as a gold standard) and very low sensitivity for the assessment of bone density; therefore, QUS is not recommended for the evaluation of bone fragility . Considering the lack of sensitivity and specificity for both osteoporosis and sarcopenia, QUS is consequently also not recommended as a standard tool to diagnose osteosarcopenia.
Dual-energy X-ray absorptiometry (DXA) : DXA (two-dimensional quantitative imaging that has been partly standardized) uses two X-ray beams with different energies to differentiate soft tissue (including fat and lean mass) from the bone . As per definition, any subject with a T-score of − 1 and below (osteopenic or osteoporotic) and sarcopenic (irrespective of the definition used) is osteosarcopenic. Currently, the most common tool used to measure bone and muscle mass is DXA. Below, we discuss the drawbacks and advantages of the technique and the current status of the research and clinical use of DXA in diagnosing osteosarcopenia.
DXA technology is half a century old, and assessing BMD has poor sensitivity and moderate specificity for predicting fragility fractures . As a consequence, the majority (up to 82%) of people with fractures do not have osteoporosis according to their BMD and, therefore, are not classified at risk of fractures, nor treated for osteoporosis. In addition, BMD improvement due to osteoporosis treatment only explains 16%–25% of reductions in fracture risk ; thus, BMD does not explain the remaining 75%–84% reduction in fractures secondary to treatment. Consequently, DXA is not recommended as an osteoporosis screening tool . In other words, additional factors such as family history, clinical conditions such as specific diseases, fall history, personal habits (smoking and alcohol intake), and medications can all impact prediction of adverse outcomes . Therefore, sensitive, specific, and noninvasive alternative methods for the diagnosis of osteoporosis, sarcopenia, and osteosarcopenia are imperative.
In the absence of better tools, DXA has been nominated as the gold standard for the diagnosis of osteoporosis by estimating BMD . Due to its wider availability compared to other techniques, high repeatability, and being relatively less costly, it is still very popular—as there is effectively no competitive technology. As per the World Health Organization guidelines, BMD T-scores below − 1 and − 2.5 at the hip and/or lumbar spine, or forearm in the absence, or marginality of the previous two are considered osteopenic and osteoporotic. T-scores are the number of standard variations from the mean BMD of young adults at peak bone mass (30- to 35-year-old people) .
DXA technology also does an acceptable job in estimating the lean mass (the tissue mass excluding bone and fat). However, blood, vasculature, tendons and ligaments, gut, and most of its contents have similar X-ray absorption coefficients to muscle. Also, since other connective tissues, as well as most of the intramuscular fat, are included in the calculation of lean mass, the DXA-derived lean mass does not essentially always reflect the muscle properties, including mass and strength, performance, and clinical outcomes. Hence, appendicular lean muscle mass corrected for height or body mass index (BMI) is commonly used to partially remove other tissues’ masses as much as possible. Separate studies show that adjusting appendicular lean mass for BMI is superior to adjusting for height squared in predicting main outcomes like strength and muscle performance and balance in older adults .
Nevertheless, appendicular lean mass shows high correlations with MRI-derived muscle mass . Currently, the American (FNIH) , European (EWGSOP2) , and Asian consensuses use DXA-derived appendicular mass corrected for BMI and height, respectively, to determine sarcopenia. For the diagnostic algorithms and thresholds, please see Table 1 .
| Cut-points for men | Cut-points for women | |
|---|---|---|
| American consensus (FNIH; ALM/BMI) | < 0.789 | < 0.512 |
| European consensus (ALM/height 2 ) | < 7 kg/m 2 | < 6 kg/m 2 |
| Asian consensus (AWGS; ALM/height 2 ) | < 7.0 kg/m 2 | < 5.4 kg/m 2 |
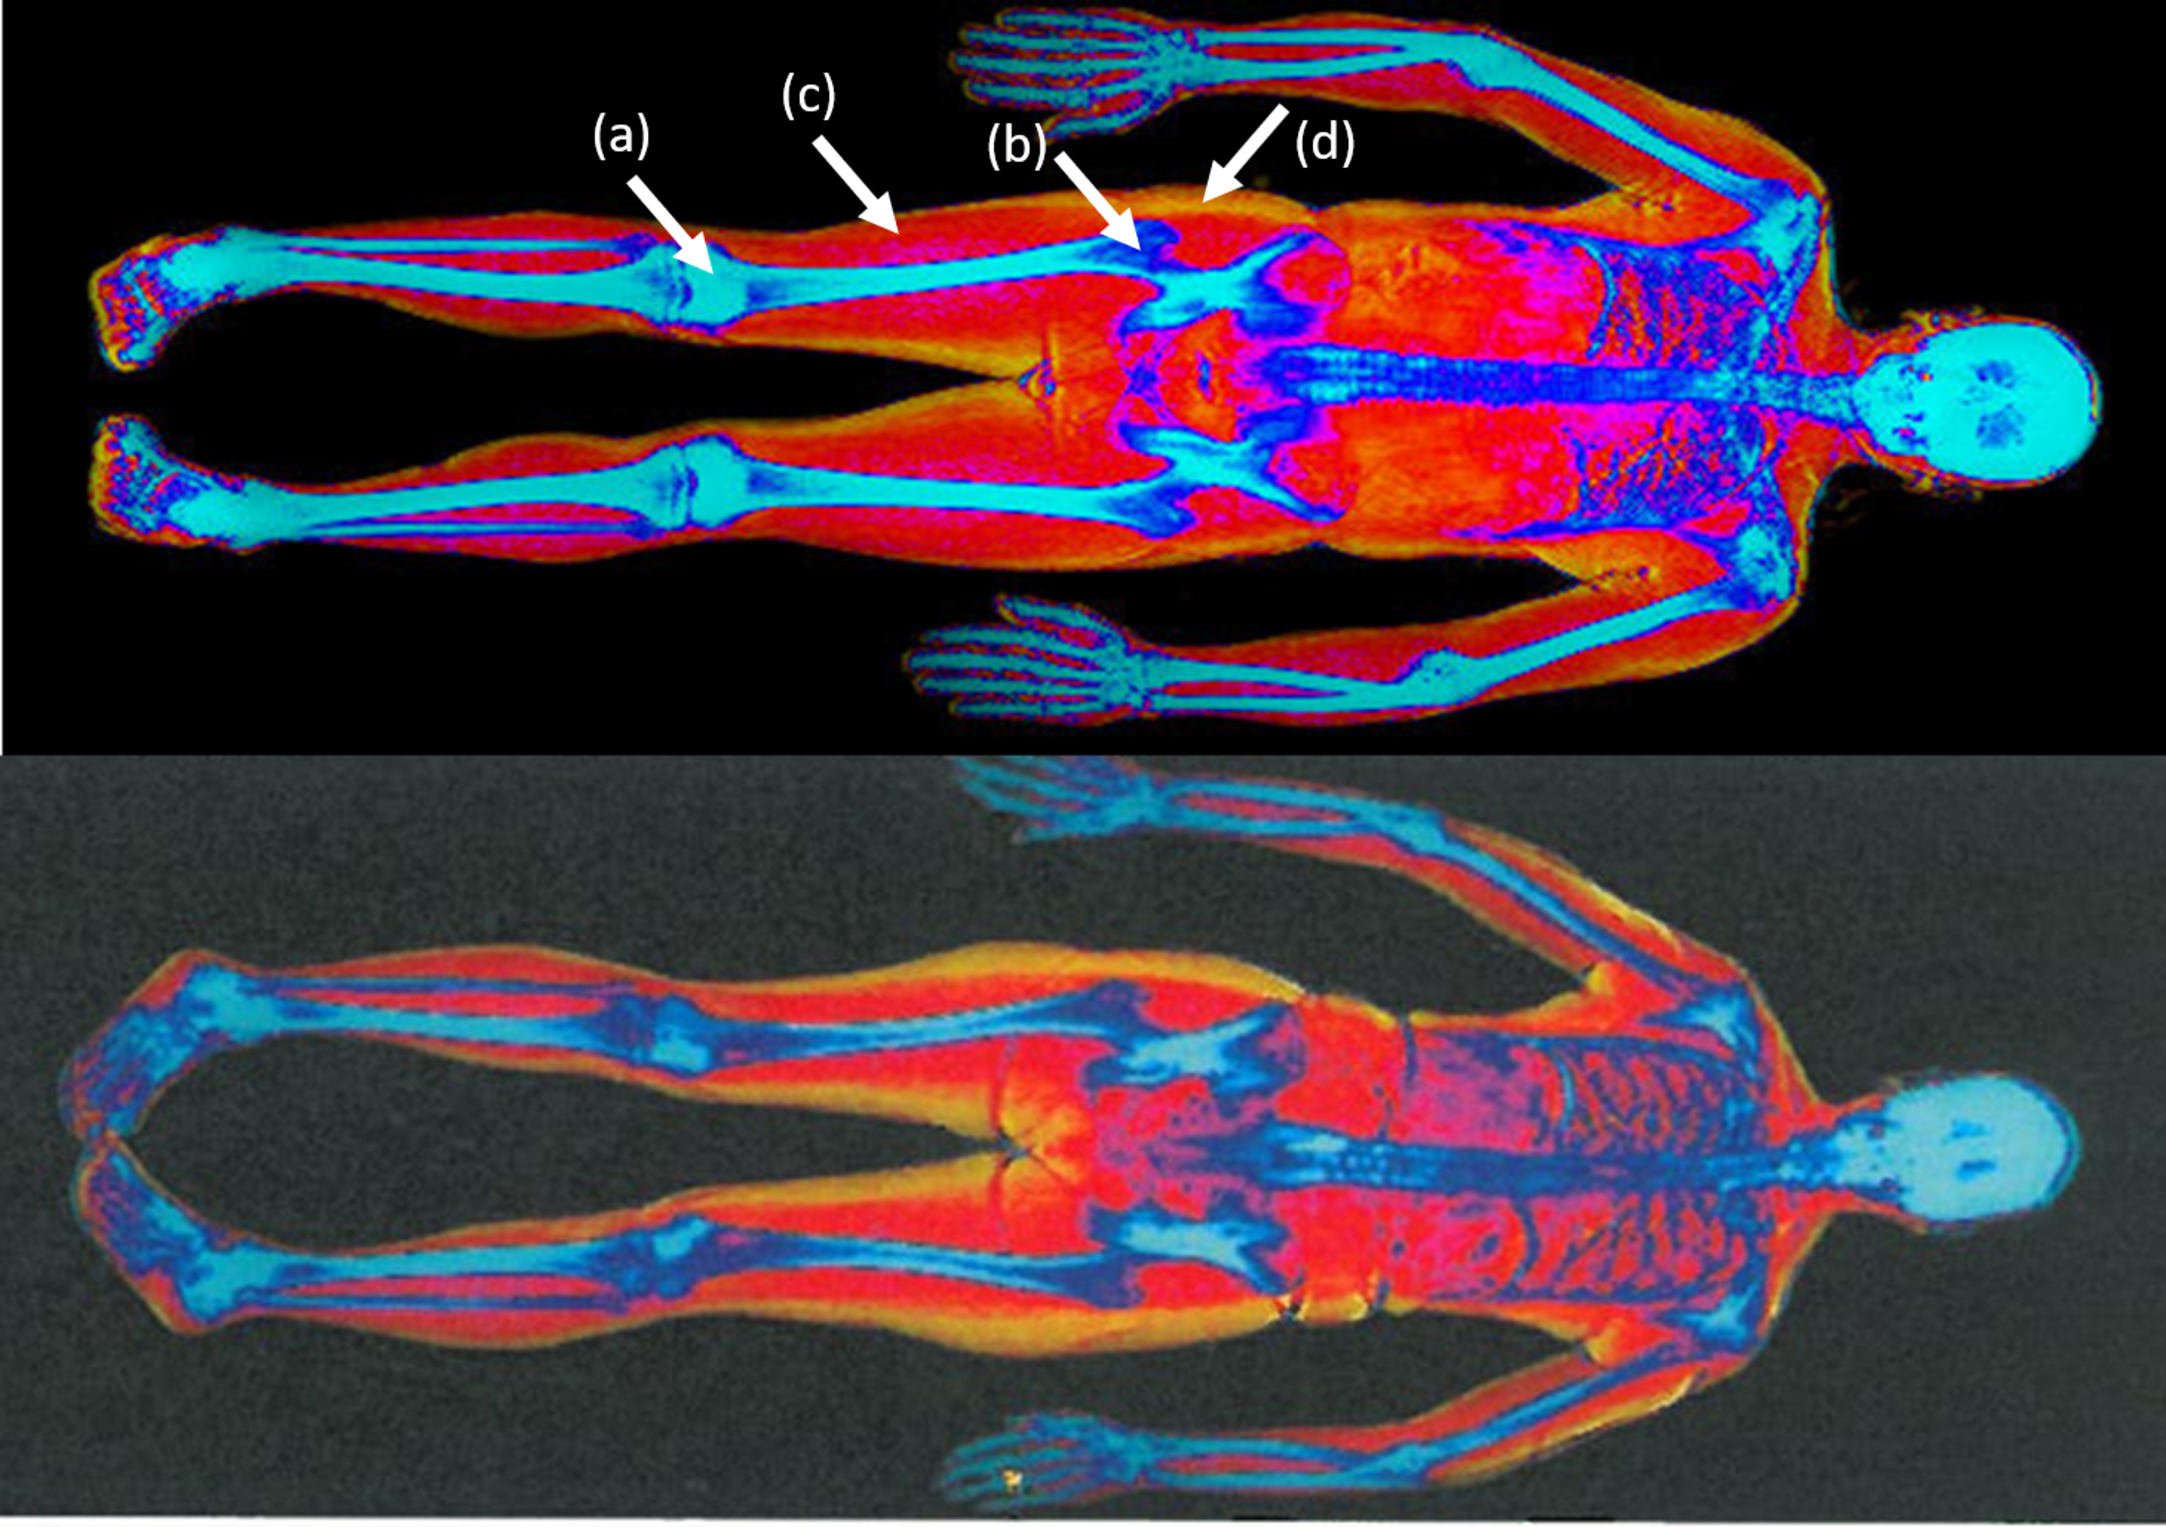
Recently, research has shown that measurements of BMD, lean mass, and fat mass in the mid-thigh region using DXA technology or other techniques – such as CT and MR scanning are moderate to very highly correlated with the hip, spine, and forearm BMD, appendicular lean mass and total/android/gynoid fat mass. In addition, the tissue masses in the mid-thigh region are generally a potential predictor of muscle function, strength, balance, falls, and fractures . Mid-thigh contains most of the major muscles responsible for weight-bearing with relatively less connective tissue (tendons and ligaments). Also, mid-thigh is at or close to the femur’s center of bending (bone is preserved maximally due to Wolff’s law), and largely overlaps with gynoid fat ( Fig. 1 ). The above makes the mid-thigh almost ideal for lean and fat mass assessment by DXA.
Three-dimensional imaging techniques
X-ray based imaging
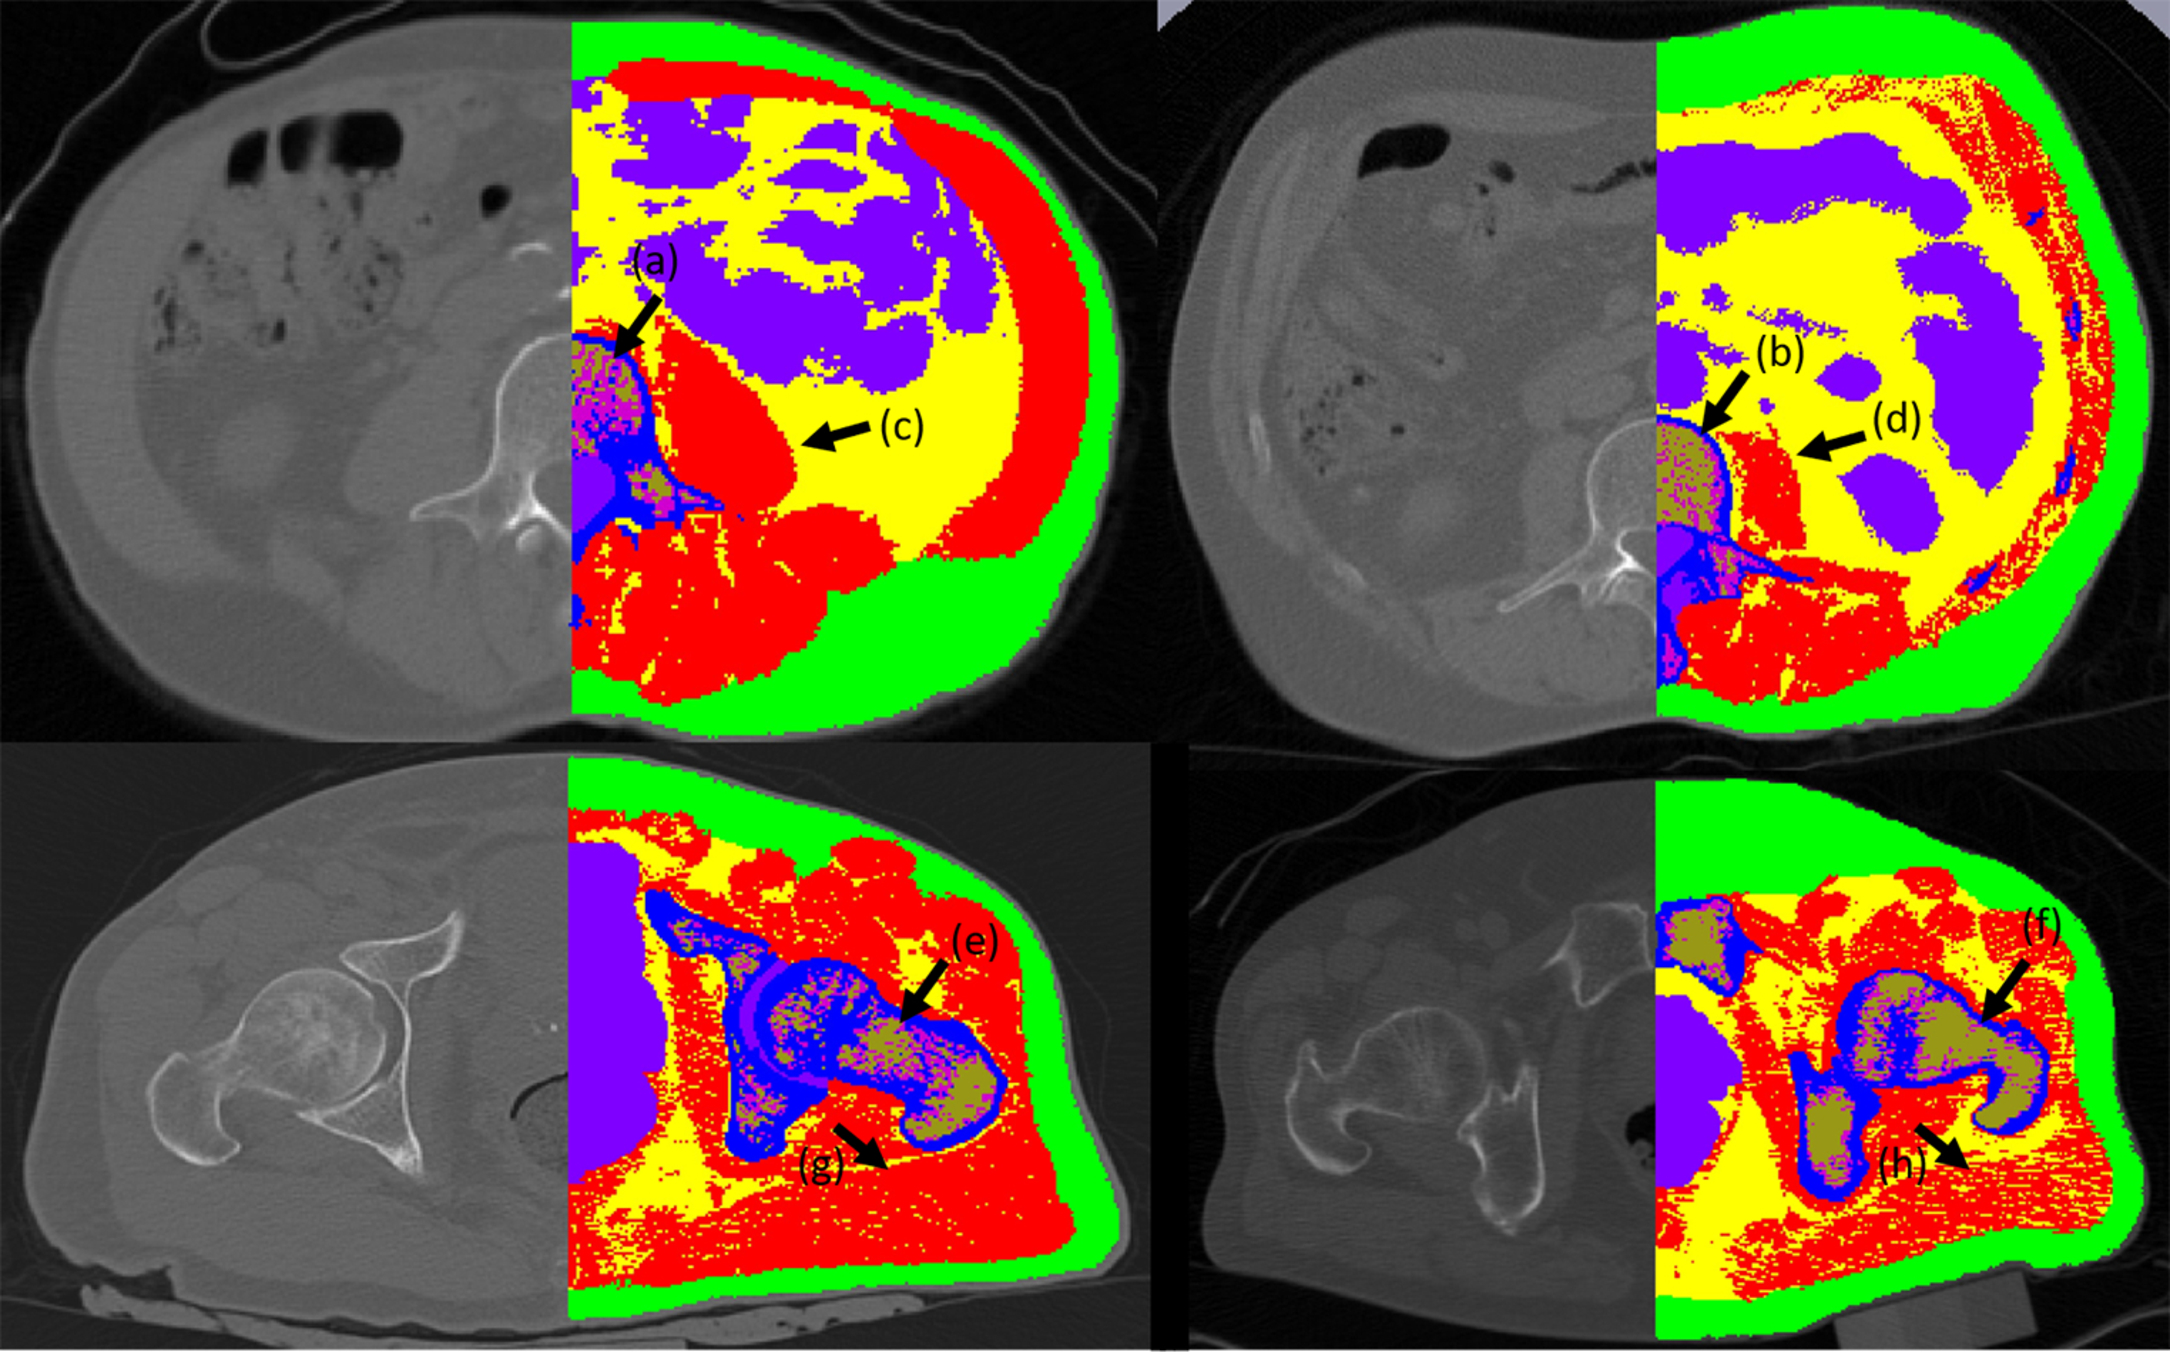
X-ray-based imaging modalities, like computed tomography (CT), rely on X-ray beam attenuation while crossing various tissues—the same principle that drives the DXA technology. Despite the good sensitivity and specificity for BMD and acceptable precision in assessing muscle mass, several major factors have limited the general application of the technique as a clinical diagnostic tool for osteoporosis and sarcopenia: high radiation dose per scan, low resolution, and the price and consequently the availability of the technique . Nevertheless, it has commonly been used to measure bone and muscle volumes for research purposes . Single slice cross-sectional CT at the lumbar spine level to estimate whole-body lean tissue and skeletal muscle and sarcopenia has been suggested . Fig. 2 displays a CT image of healthy and osteosarcopenic subjects that have been scanned by clinical CT-Scanner and axial images segmented to display muscle, bone, intramuscular fat, marrow adipose tissue, and hematopoietic marrow. Differentiating tissues with similar X-ray attenuation coefficients is a major limitation of X-ray based techniques. Considering the roles of ectopic fat infiltration into the muscle and bone that possibly drives the decline of bone and muscle with aging , one expects a reliable quantification of the infiltrating ectopic fat in tissues. However, differentiating marrow adipose tissue from hematopoietic tissue is still a challenge. Albeit, with sensitive image analysis technique, this issue can be addressed to a great extent ( Fig. 2 ) .
Related posts:
 Cellular senescence and other aging mechanisms in bone and muscle
 Biomechanics and mechanobiology of bone and muscle: Current and future musculoskeletal modeling research directions in osteosarcopenia
 The role of vitamin D and parathyroid hormone (PTH) in osteosarcopenia
 Osteosarcopenic adiposity
 Pharmacological management of osteosarcopenia
 Frailty: The end of the osteosarcopenia continuum?
Stay updated, free articles. Join our Telegram channel

Full access? Get Clinical Tree


