Screening for and Diagnosing T2DM
Screening for diabetes should be performed by a health-care provider at 3-year intervals beginning at the age of 45 years in asymptomatic individuals. An asymptomatic adult of
any age having a BMI ≥25 kg per m
2 or greater and at least one additional risk factor as noted in
Table 10-1 should also be screened for diabetes.
3 A patient who screens negative for prediabetes or diabetes should be rescreened after 3 years (
Fig. 10-1).
The ADA discourages screening for diabetes in a nonmedical environment because patients with positive findings may not be provided with appropriate follow-up instructions, repeated testing, or care.
Mathematical modeling studies suggest that screening independent of risk factors beginning at age 30 or 45 is highly cost-effective (less than $11,000 per quality adjusted life-year gained).
Prediabetes and diabetes meet established criteria for conditions in which early detection is appropriate. Both conditions are endemic and impose significant global public health burdens. A long presymptomatic phase precedes the clinical diagnosis of T2DM during which cost-effective and nonpharmacologic measures can be utilized to delay or reverse diabetes progression. Simple testing is available to detect preclinical disesase. Finally, the duration of one’s exposure to chronic hyperglycemia correlates with one’s microvascular and macrovascular outcomes. Thus, simple, inexpensive glycemic testing employed during the preclinical phase of diabetes can prevent disease progression and minimize economic burden.
4A pharmacoeconomic analysis by Torgdon and Hylands suggested that the cost of managing diabetes increases one’s annual medical expenditures by $158.
5 These costs are in addition to baseline increases associated with medical expenditures with aging. Thus, not only does diabetes increase medical expenditures at any age, the effect grows by $158 each year.
As clinicians attempt to prevent long-term complications by encouraging earlier pharmacologic interventions, patients feel the crunch of higher annual prescription drug costs. A growing diabetes epidemic and introduction of new treatment options could increase drug costs by 70% by 2013.
6 With a surge in pharmacy spending, health plans are likely to increase cost sharing with enrollees by raising copays and coinsurance rates. Higher costs passed on to patients may increase the likelihood of medication nonadherence. In a national survey of 875 older adults with diabetes, 19% reported cutting back on the use of their medications because of cost, 11% reported cutting back on their diabetes medications, and 7% reported cutting back on their diabetes medications at least once a month. In order to pay for their medications, 20% reported foregoing food and other essentials, 14% increased credit card debt, and 10% borrowed money from family or friends.
7The rate of medication adherence is typically low in patients with chronic conditions, especially in patients with T2DM. A review of the literature by Cramer showed that patient adherence to treatment with oral hypoglycemic agents ranged from 36% to 93% and adherence to insulin therapy was 62% to 64%.
8Medication nonadherence accounts for more than 10% of all hospitalizations and 23% of all nursing home admissions each year.
9 The estimated cost of medication nonadherence to the healthcare system is approximately $100 billion a year.
10The incidence of T2DM within the pediatric population is increasing in ethnic minority groups although the disorder remains rare within the general pediatric and adolescent population. The
ADA has published guidelines for screening asymptomatic children for T2DM as summarized in
Table 10-2. Screening should be performed every 3 years in high-risk children and adolescents.
For decades, clinicians have relied upon fasting and 75-g glucose challenge testing to screen and diagnose diabetes. In 2010, the ADA adopted the recommendations of an International Expert Committee, which set the A1C of 6.5% as the diagnostic threshold for diabetes.
11 The A1C may also be used to screen patients for prediabetes as reviewed in
Tables 10-1 and
10-2.
Any test result that is diagnostic of diabetes should be repeated to rule out laboratory error, unless the patient has classic signs and symptoms of hyperglycemia (thirst, frequent urination, weight loss, blurred vision, fatigue, paresthesias, dry skin, or a random plasma glucose level greater than 200 mg per dL). If the abnormal lab test is repeated and found to be consistent with the previous value, the diagnosis of diabetes is confirmed. The diagnosis of diabetes can also be presumed based upon the presence of two different test results both of which are above the diagnostic threshold. For example, an A1C of 7.8% coupled with a random plasma blood glucose of 201 mg per dL does establish the diagnosis of T2DM. If two screening tests are discordant, the ADA suggests repeating the result that is above the diagnostic cut point prior to diagnosing the patient as having
prediabetes or diabetes. For example, a patient is suspected of having prediabetes. The patient’s A1C is 6.2% but his 2-hour 75-g postglucose challenge is 135 mg per dL. The repeated A1C performed 3 months later is now 6.4%. Based on the fact that the patient has had two consistently abnormally elevated A1C values that surpass the diagnostic cut point for prediabetes, the diagnosis is made and lifestyle interventions are immediately initiated.

Prevention of T2DM by Using Intensive Lifestyle Intervention
Both genetic and environmental factors contribute to the development and progression of T2DM. Specific at-risk population groups have a high prevalence of T2DM, as do individuals with an afflicted first-degree relative. The most dominant determinant in the development of diabetes appears to be one’s BMI.
12 An estimated 65% of Americans have a BMI of 25 kg per m
2 or more and are thus labeled “overweight” by U.S. standards.
13 The direct relation between obesity and the increasing prevalence to T2DM suggests that lifestyle interventions for weight reduction and improvement in physical activity participation could slow or prevent the progression from normoglycemia to prediabetes and beyond. Weight reduction and physical activity can improve insulinmediated glucose disposal, reduce postprandial hyperglycemia, delay β-cell death (apoptosis), and slow the progression of glucose intolerance to T2DM.
14,
15 Table 10-3 summarizes the landmark clinical trials that have demonstrated the important role of lifestyle modification in delaying and preventing T2DM.
The most comprehensive clinical trial that evaluated the importance of lifestyle modification as a deterrent to diabetes was the Diabetes Prevention Program (DPP).
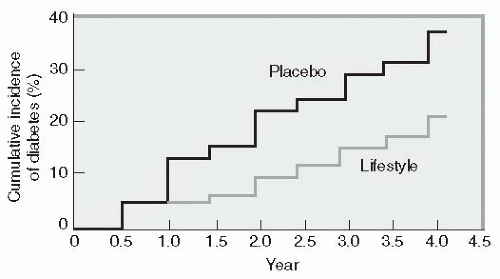
16 This $174 million National Institutes of Health (NIH) study enrolled 3,234 individuals with impaired glucose tolerance (IGT). Patients were randomly assigned to receive intensive lifestyle intervention or metformin at 27 U.S. centers. The lifestyle-intervention group participated in walking or other moderate-intensity exercise averaging 150 minutes per week. These subjects lost on average
5% to 7% of their initial body weight while reducing their risk of diabetes progression by 58% (
Fig. 10-2). Forty-five percent of the subjects came from high-risk minority groups who have disproportionate numbers of T2DM (African Americans, Hispanics, Asian Americans, Pacific Islanders, and Native Americans). Other high-risk subjects in the DPP included patients older
than 60, women with a history of gestational diabetes, and individuals with a first-degree relative with T2DM.
DPP subjects were randomized into one of three treatment arms: (a) intensive individualized lifestyle intervention with the aim of reducing weight by 7% through low-fat diet and exercising 150 minutes per week, (b) treatment with metformin (850 mg twice daily), or (c) a standard group taking placebo pills in place of metformin. The metformin and placebo groups also received information about the importance of diet and exercise. A fourth arm of the study, using troglitazone combined with standard diet and exercise recommendations, was discontinued in June 1998 because of the potential for liver toxicity. DPP participants ranged in age from 25 to 85 years, with an average of 51 years. On entry into the trial, all had IGT, as measured by an oral glucose tolerance test (OGTT), and all were overweight, with an average BMI of 34 kg per m2.
Lifestyle intervention worked well in men and women as well as in all ethnic groups regardless of their baseline BMIs.
15 In subjects older than 60 years, lifestyle intervention reduced the progression to diabetes by 71%. Metformin was not as effective as lifestyle intervention in reducing diabetes risk in the population older than 60 years or in those who were less obese.
Ten years following the initial randomization within the DPP, the modest weight loss within the metformin cohort was maintained. Diabetes incidence in the 10 years since DPP randomization was reduced by 34% in the lifestyle group and 18% in the metformin group compared with placebo. The DPP extension proves that the prevention or delay of diabetes with lifestyle intervention or metformin can persist for at least 10 years.
17 The use of metformin in both the DPP and the ADOPT trial was found to be associated with β-cell preservation.
18Diets that include mono- or polyunsaturated fatty acids may alter the composition of membrane phospholipids and improve insulin sensitivity. Specific dietary patterns that are high in fruits, vegetables, and whole grains and low in red or processed meat, sugars, and high-fat dairy products also appear to reduce the risk of T2DM.
15Physical activity improves insulin sensitivity independent of its effect on weight loss or improvement of fat distribution.
19 A study of Pima Indians showed that the incidence of T2DM, as determined by OGTT, was lower in more active individuals regardless of their BMI.
20

Effects of Pharmacotherapies on Reversing T2DM in Newly Diagnosed Patients
Pharmacotherapies that have proven to be effective or deleterious to high-risk patients are discussed in detail in
Chapter 2.
Can intensive insulin therapy initiated shortly after one is diagnosed with T2DM reverse the disease course by establishing “β-cell rest” whereby insulin secretory function is preserved and islet mass is maintained? Several studies have demonstrated that intensive reversal of hyperglycemia, glucotoxicity, and lipotoxicity favors recovery of β-cell function.
Intensive insulin treatment can decrease the secretory demand on β-cells to near zero levels, providing the β-cells with a resting phase and lowering the likelihood of further loss of β-cell mass. Weng et al.
21 demonstrated that normalization of hyperglycemia improved β-cell function after 2 weeks of active therapy regardless of treatment with multiple daily injections of insulin, insulin pumps or orally administered hypoglycemic agents. The study was performed on patients with newly diagnosed T2DM rather than in patients with prediabetes. The remission rates 1 year off medications were 51%, 45%, and 27% in the insulin pump, MDI, and oral agent groups, respectively. Prolonged β-cell improvement was noted in both insulin groups but not in those patients using oral agents. The duration of intensive insulin therapy needed to achieve β-cell rest is unknown. The ultimate efficacy of insulin therapy at preserving β-cell function may be dependent on the actual duration of prediabetes and the number of recoverable β-cells present at the time the insulin is initiated.
Intensive insulin pump therapy also appears to restore β-cell secretory function. Li et al.
22 recruited 138 newly diagnosed patients with T2DM having fasting glucose levels greater than 200 mg per dL. All patients were hospitalized for 2 weeks and placed on intensive insulin pump therapy. Optimal glycemic control was attained within 6.3 ± 3.9 days in 126 patients. The remission rates (percentage of participants maintaining near-normal glucose levels) at the 3rd, 6th, 12th, and 24th months were 72.6, 67.0, 47.1, and 42.3%, respectively. Those patients in remission for greater than 1 year had greater recovery of β-cell function compared with the nonremission group as demonstrated by favorable proinsulin:insulin ratios in the long-term remission group. Under normal circumstances, small amounts of proinsulin are secreted concurrently with insulin; the result is a plasma proinsulin:insulin ratio of approximately 0.1. Conditions characterized by inflammation or dysfunction of β-cells are associated with increased levels of proinsulin, resulting in an increased ratio of proinsulin to insulin.
23In summary, early intensive insulin treatment in patients with newly diagnosed T2DM may be effective in retarding the progressive dysfunction of β-cells in patients by reducing glucotoxicity and lipotoxicity. Incretin mimetics and TZDs result in maintenance and improvement of β-cell function during their active use; yet continued efficacy appears to diminish once the drugs are stopped. Use of pioglitazone in high doses for diabetes prevention can result in unwanted side effects such as weight gain and edema.

Metabolic Surgical Procedures
Bariatric (also known as “metabolic surgery”) consists of several well-defined procedures. Restrictive surgeries, such as laparoscopic adjustable gastric banding (LAGB) and vertical banded gastroplasty (VBG), reduce the volume of the stomach by 85% to decrease food intake and induce early satiety. VBG is also known as sleeve gastrectomy. LAGB is considered a minimally invasive intervention in which a restrictive band is placed around the upper stomach to partition a small proximal pouch. Initially, these bands were designed for open surgical placement and were not adjustable. However, further refinement of these devices now enables surgeons to place the adjustable appliance laparoscopically. Malabsorptive procedures, such as biliopancreatic diversion (BPD), shorten the small intestine to decrease nutrient absorption. Combined procedures, such as the Roux-en-Y gastric bypass (RYGB) incorporate both restrictive and malabsorptive elements. RYGB surgery is the current gold standard treatment for severe obesity. Both BPD and RYGB alter the secretion of gut hormones that affect satiety.
32Historically, RYGB had been the most common bariatric surgical procedure performed in the United States. However, since 2009 gastric banding procedures have exceeded RYGB for the reasons listed in
Table 10-4. The Roux-en-Y procedure is named after the surgeon who first described the
operation in 1993 and the “Y” shape produced by the redirected intestines as food is redirected around the stomach. The surgeon creates a walnut-sized pouch (1 to 2 tablespoons) on the proximal area of the stomach and “bypasses” the remaining stomach by attaching a section of the small bowel to the pouch. Although the stomach does not receive any nutrients, gastric enzymes continue to be produced. The gastric pouch is anastomosed to a Roux-en-Y proximal jejunal segment, bypassing the remaining stomach, duodenum, and a small portion of jejunum. The standard Roux (alimentary) limb length is about 50 to 100 cm, and the biliopancreatic limb is 15 to 50 cm. The Roux limb allows the gastric content to mix with nutrients entering from the gastric pouch and bypassing the stomach. Patients experience very rapid fullness with this procedure and significant weight loss. The gallbladder is typically removed during this procedure, as patients who experience rapid weight loss have a higher incidence of cholelithiasis.
36 The major benefits of RYGB include rapid weight loss and early improvement or remission of T2DM, independent of weight loss. RYGB is associated with increased operation times, longer hospital stays, and increased risk of complications.
During the Lap-Banding procedure, a silicone band filled with saline is wrapped around the proximal portion of the stomach. This restricts the amount of food one could consume and induces satiety. An injection port allows subcutaneous access to the lap band through which saline may be added or removed postoperatively depending upon the patient’s level of satiety.
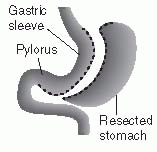
The sleeve gastrectomy creates a thin vertical staple line across the stomach. The lower portion of the stomach is amputated, leaving the patient with a gastric capacity of 10% of its normal volume. With minimal gastric capacity, patients quickly develop satiety and weight loss ensues. No rerouting of intestinal anatomy is required.
The anticipated weight loss associated with each procedure can vary based upon several factors. Patients can increase their weight reduction by following the nutritional consumption guidelines provided by their surgical team. Periodic adjustment in gastric band tightening might be necessary to increase satiety and limit the amount of food that enters the gastric pouch in lap-banded patients.
Metabolic surgical studies report results as “mean percent excess body weight loss” calculated as the percent of body weight above the stated upper limit of normal BMI of 25 kg per m2.
The mean percent excess body weight loss after lap banding in published series is 46%, and the mean resolution in diabetes is 56%,
37 both substantially lower than after RYGB.
37 Studies that directly compare the RYGB and LAGB also suggest substantially greater weight loss and resolution of comorbidities after RYGB.
38 There are no studies to date suggesting that the LAGB has a specific effect on T2DM beyond that of inducing caloric restriction and subsequent weight loss.
The long-term expected body weight loss observed with three different metabolic surgical procedures is shown in
Table 10-5.
Data from larger LAGB studies show that morbidity rates remain uniformly low, whereas RYGB and VBG retain a higher risk of morbidity than LAGB, even with considerable numbers of patients
being treated.
39 The main complications of LAGB are related to misplaced or inadequately secured devices.
39One must always consider the risk:benefit for each patient who is considering metabolic surgery. A study by Keidar has suggested that weight loss surgery reduces diabetes-related mortality by 90%.
40 As many as 14,300 lives can be saved in the United States over 5 years through metabolic surgical intervention.
40Improvements in hyperglycemia are observed almost immediately after surgery. Fasting plasma glucose levels often normalize before hospital dismissal and before weight loss is observed. Insulintreated patients note a decrease in insulin requirements while some who have been severely insulin resistant may be able to discontinue insulin within 6 weeks after surgery. However, the longer one has had T2DM, the less likely he or she is to be able to discontinue insulin use.
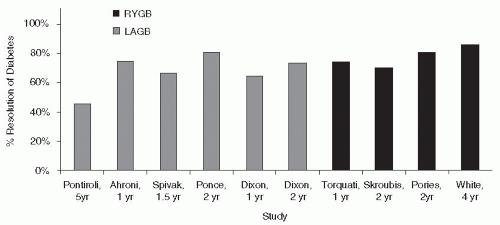
41 Patients undergoing gastric bypass surgery tend to achieve remission of diabetes faster than those undergoing lap banding, although both procedures are highly successful at normalizing glycemia (
Fig. 10-3).
36Factors that predict resolution of diabetes following metabolic surgery are listed in
Table 10-6. Patients with better preoperative control of their diabetes and those with shorter duration of diabetes and higher degrees of IR are more likely to be euglycemic for 1 to 2 years postprocedure.
Obesity and diabetes may also be associated with an increased risk of cancer and cancer-related mortality (see
Chapter 8).
42 In the SOS study, metabolic surgery resulted in a sustained mean weight reduction of 19.9 kg over 10 years, in contrast to a weight gain of 1.3 kg in the control group.
43 The number of first-time cancers after inclusion was significantly lower in the surgery group than in the controls, with the modest reduction in cancer risk favoring women over men. Whether metabolic surgery clearly reduces cancer risk in severely obese patients with T2DM is unknown.
Although, the evidence suggests that metabolic surgery is a successful long-term treatment of obesity for people with diabetes, the procedure is expensive, with costs exceeding $13,000 per patient.
44 A study by Hoerger et al.
44 evaluated the cost-effectiveness of metabolic surgery in severely obese adults with diabetes relative to usual diabetes care. Cost analysis was performed on patients with T2DM of less than 5 years duration as well as greater than 10 years.
Table 10-7 lists the conclusions from this study.
Table 10-8 lists the inclusion and exclusion criteria for metabolic surgery candidates based upon the 2008 American Association of Clinical Endocrinologists/The Obesity Society/American Society for Metabolic and Metabolic Surgery Medical Guidelines for Clinical Practice.
36
Additional inclusionary characteristics for patients who may be considered strong candidates for metabolic surgery are shown in
Table 10-9.
45A patient who is considering metabolic surgery should be counseled on the risks and benefits of the different types of available procedures. Specific contraindications to metabolic surgery are few. They include mental or cognitive impairment that limits the patient’s ability to understand the procedure and thus precludes informed consent. Very severe coexisting medical conditions, such as unstable coronary artery disease (CAD) or advanced liver disease with portal hypertension, may in some instances render the risks of surgery unacceptably high.
When scrutinizing reports of complications related to metabolic surgeries, the reader should consider the following. First, most surgical outcome studies include very small cohorts, usually less than 100 subjects. Second, surgeons do not always perform the exact type of procedure on each bypass or lap-band patient. For example, some bypass procedures are performed laparoscopically, whereas others are performed as open procedures. Thus, including all complications as being directly related to a single bypass procedure would be inappropriate. Next, not all lap bands are
equal. Several companies produce the devices, including Johnson and Johnson and Allergan. The surgical techniques are different for each device. Finally, some “centers of excellence” for metabolic surgery, may actually only perform a handful of procedures each month. Unlike cardiovascular centers of excellence, a surgeon who performs only 15 to 20 procedures each year may not be considered as expert in a given surgical procedure as a cardiac surgeon who has performed hundreds of coronary artery bypass grafts.
Postoperative complications include gastrointestinal leak, deep vein thrombosis, bleeding, anastomotic stricture, incisional or internal hernia, marginal ulceration, vitamin and protein malnutrition, gallstone formation, and wound infections. The more adept a surgeon is at performing gastric bypass procedures, the fewer complications the patient experiences.
46 Postoperative patients must be evaluated frequently for deficiencies in calcium, iron, thiamine, folate, and vitamin B
12.
On average, metabolic surgery is associated with a mortality risk in the range of 0.3%. Significant or major complications occur in just over 4% of patients.
47 Studies have demonstrated that the likelihood of postoperative complications is significantly associated with annual surgical experience. The risks are greatest when surgeons perform fewer than 25 operations and hospitals host fewer than 50 operations per year, and the risks are lowest when surgeons perform more than 100 operations and hospitals host more than 150 operations per year.
48,
49 Studies suggest that lap banding is perhaps the safest of all the metabolic surgical procedures available in the United States.
50,
50aThe reason for the effectiveness of metabolic surgery in reversing T2DM is uncertain. Food intake, transit, and absorption are regulated by a complex network including the gastrointestinal system, the liver, and the brain. Thus, many factors may influence the physiologic and metabolic outcomes that are commonly observed following metabolic surgery. GLP-1 potentiates insulin release following the consumption of a meal in a glucose-dependent manner. In patients with T2DM as well as individuals who are obese, GLP-1 responses to glucose or mixed meals are impaired or patients exhibit evidence of resistance at the sites of targeted receptors. Serum levels of GLP-1 increase early after both RYGB and BPD procedures, which is believed to contribute to both improvement and hypertrophy of pancreatic β-cells postoperatively.
51 Excessive stimulation of the β-cells following RYGB can induce a condition known as nesidioblastosis that can present clinically as postabsorptive hypoglycemia.
52 Gastric bypass procedures may result in distention of the stomach, which, in turn, stimulates the release of central GLP-1 via vagal stimulation inducing satiety.
53Metabolic surgery heightens the dynamic responsivity of β-cells and appears to improve β-cell function. Whether β-cell function is fully restored is dependent principally upon the severity of diabetes relative to duration of the disease, the degree of metabolic control, and the intensity of ongoing antidiabetes treatment.
54,
55Table 10-10 summarizes facts related to metabolic surgery procedures in the United States.
Two recently published randomized, controlled trials suggest that metabolic surgery can be a more efficient means than either standard or intensive medical treatment alone in managing obese patients with diabetes. Mingrone et al. assigned patients to undergo gastric bypass, gastric sleeve, or standard medical therapy.
55a After 2 years, diabetes remission had occurred in 75% of the gastric bypass group, 95% of the gastric sleeve group, and none of the medical therapy group. The average baseline A1C of 8.65% decreased in all groups at 2 years, but was most improved in the surgical groups (average A1C at study end: 7.69 for the medical therapy group, 6.35 in the gastric bypass group, and 4.95 for the gastric sleeve group).
In another study, Schauer et al. compared intensive medical therapy with gastric bypass or sleeve gastrectomy.
55b After 1 year, the primary end point, an A1C of 6% or less, was achieved in 12% of patients in the medical therapy group versus 42% in the gastric bypass group and 37% in the sleeve gastrectomy cohort.
The studies by Mingrone et al. and Schauer et al. suggest that metabolic surgery should probably be considered sooner in obese patients with diabetes and severe IR. Within 1 to 2 years following surgical intervention, more patients are able to attain remission of their diabetes and normalize their A1Cs than if prescribed intensive medical therapies. Patients with T2DM in whom recommended
glycemic targets are not reached with available medical therapies, especially when the individual has major coexisting illnesses such as sleep apnea, hypertension, and dyslipidemia, should be provided with the option of bariatric surgery.
In summary, metabolic surgery appears to be the only long-term effective therapy in reducing morbidity and mortality related to the comorbidities observed with obese T2DM. Operative selection algorithms have attempted to match specific patients with a specific operation in order to, among other factors, minimize surgical complications. The different types of surgeries appear to
be cost-effective as they tend to reverse all-cause mortality, prolong life, improve lipids and hypertension, and reverse diabetes. Ideal patients for metabolic surgery are those having preoperative A1Cs less than 7.9%, duration of diabetes less than 5.5 years, BMI greater than 45 kg per m,
2 and evidence of severe IR. Patients who cannot comprehend the nature of the surgical intervention and the lifelong measures required to maintain an acceptable level of health should not be offered these procedures. Partnering with local metabolic surgeons would be an appropriate initial step to allow obese patients with T2DM to receive a timely surgical consult.

Pathogenesis of T2DM
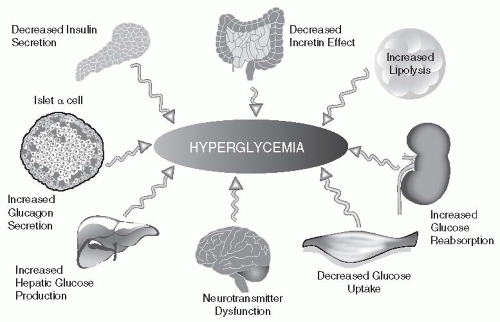
Although the “core defects” of T2DM are pancreatic β-cell failure and IR, other systems appear to play unique and contributory roles in the progressive nature of the disease. Genetic and environmental susceptibility certainly increase the likelihood of developing T2DM. In addition, abnormalities in adipocytes (accelerated lipolysis), neuroprotective mechanisms (resulting in excessive appetite), changes in kidney absorption of glucose (involving the SGTL2 transport system), incretin resistance in the GI tract, and excessive hepatic glucose production in spite of a threefold increase in β-cell secretion of insulin all contribute to chronic hyperglycemia, oxidative stress, and longterm complications. When patients state that “they are doing the best they can” to control their glucose values, one should remain cognizant of the complex highway on which these paths will likely intersect clinical diabetes. Whether an individual remains euglycemic or advances toward the hyperglycemic pathway is ultimately determined by the ability of one’s pancreatic β-cells to produce and secrete enough insulin to maintain normoglycemia.
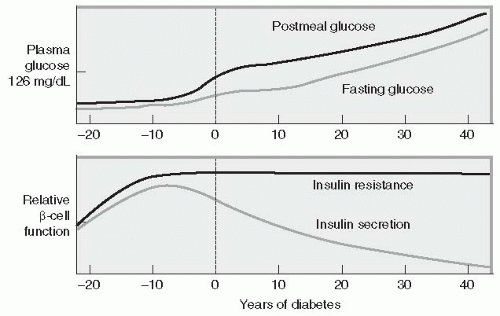
The hallmark of the metabolic dysfunction associated with T2DM includes a reduction in insulin secretion as well as altered insulin action, resulting in hyperglycemia. Unlike autoimmune T1DM, the progression to T2DM occurs over a period of 7 to 10 years (
Fig. 10-4). In the prediabetes states of impaired fasting glucose (IFG) and IGT, pancreatic β-cells excrete increasing amounts of insulin in an attempt to maintain normal glycemia. The higher insulin output is accompanied by reduced
insulin activity in the liver, adipose tissue, and skeletal muscles, resulting in diminished intracellular glucose disposal. A further decline in β-cell insulin secretion and an increase in hepatic glucose production lead to overt diabetes with fasting and postprandial hyperglycemia. Patients proceed through a spectrum of abnormal glucose states, including IFG and IGT, until ultimately progressing to diabetes. Based upon a mathematical model of patients in the United Kingdom Prosepective Diabetes Study (UKPDS), the traditional belief has been that a newly diagnosed patient with T2DM has approximately 50% of their β-cell functioning remaining.
56Pancreatic β-cell failure appears to occur much earlier in the natural history of T2DM and is more severe than previously thought. The San Antonio Metabolism (SAM) study evaluated patients with normal glucose tolerance and T2DM.
57 Patients received an OGTT with plasma glucose and insulin concentrations measured every 15 minutes to evaluate overall glucose tolerance and β-cell function. An insulin clamp technique was used to measure insulin sensitivity. Patients with “impaired glucose tolerance” who had a 2-hour postprandial glucose level of 180 to 199 mg per dL were found to have lost 80% to 85% of their β-cell function. Thus, by the time the diagnosis of clinical diabetes is made and therapeutic interventions are initiated, patients have already lost at least 80% of their β-cell function and are maximally insulin resistant. The SAM study suggests that intensive pharmacologic intervention may be reasonable for patients with both prediabetes and newly diagnosed T2DM.
In postmortem analysis, Butler et al.
58 determined that β-cell mass is significantly decreased in patients with T2DM and that the underlying mechanism for this is β-cell apoptosis (genetically mediated cell death). Obese individuals in Butler’s study had a 63% deficit in relative β-cell volume compared with nondiabetic obese individuals. Thus, patients with prediabetes tend to lose β-cell function and mass prior to being clinically diagnosed with T2DM.
Multiple mechanistic anomalies have been implicated in the progression from euglycemia to clinical diabetes (
Fig. 10-5). The pancreas, liver, muscle, kidneys, brain, gut, and adipose cell appear to be “team players” in driving susceptible individuals into chronic hyperglycemia. The individual
pathways that appear to favor IR, β-cell destruction, and progression from prediabetes to clinical diabetes are discussed below.
• β-cell Failure and Apoptosis
Patients with IGT have lost over 80% of their β-cell function and 50% of their β-cell mass.
57 These patients are maximally insulin resistant and have a 10% incidence of diabetic retinopathy.
59 Some would argue that patients with prediabetes should be treated intensively in order to preserve any remaining β-cell function.
60Multiple mechanisms have been proposed that appear to target progressive β-cell failure. Advancing age plays an important role in β-cell failure. Well-established observational studies confirm the incidence of diabetes increases with advancing age.
61Vitamin D (25-hydroxyvitamin D [25(OH)D]) may have a direct influence on diabetes pathogenesis and β-cell function. Several mechanistic pathways have provided researchers with circumstantial evidence linking vitamin D to β-cell preservation. Vitamin D3 may be obtained directly from the diet or by means of the sunlight-induced photochemical conversion of 7-dehydrocholesterol to previtamin D3. D3 must be hydroxylated twice to produce the biologically active form of the hormone. The first hydroxylation process occurs in the liver. This conversion produces 25-hydroxyvitamin D [25(OH)D], which is the major circulating form of vitamin D used by clinicians to determine vitamin D status. This form of vitamin D is biologically inactive and must be converted once again in the kidneys by 1 α-hydroxylase to the biologically active form of vitamin D 1,25-dihydroxyvitamin D [1,25(OH)2D].
62 β-cells contain both vitamin D receptors and express activity of 1 α-hydroxylase.
63 This suggests that the 1 α-hydroxylase enzyme plays a role in vitamin D signaling within the islet as well as in other organs such as the kidneys.
64 (b) Vitamin D improves β-cell function by stimulating insulin release and restoring impaired insulin secretion in vitamin D-deficient mice.
63 (c) Vitamin D is known to improve insulin action by stimulating expression of the insulin receptor and enhancing responsiveness for glucose transport.
65 The Nurses’ Health Study of 83,779 women with 20-year follow-up revealed 4,843 new cases of T2DM. However, patients who consumed greater than 1,000 mg per day of calcium and greater than 800 mg per day of vitamin D had a 33% lower risk of developing T2DM.”
66 (d) Mutations in genes coding for 1 α-hydroxylase may explain an association between obesity, T2DM, and low level of serum vitamin D.
67 Unfortunately, no well-conducted randomized, controlled trials with adequate vitamin D doses have been conducted to determine if vitamin D supplementation could reduce the incidence of T2DM in adults.
68 In light of the widespread prevalence of both vitamin D insufficiency and T2DM, the potential relationship between both disorders could hold tremendous public health implications.
IGT in association with elevated free fatty acids (FFAs) can induce oxidative stress. Intracellular oxidative stress occurs when the production of reactive oxygen species (ROS) (by-products of normal metabolism) exceeds the capacity of the cell’s antioxidants to neutralize them. Oxidative stress can be minimized by optimization of metabolic control. Stress-induced pathways such as NF-κB, stress kinases, and hexosamines tend to promote not only β-cell apoptosis but also pathways leading to long-term diabetes-related complications
69Glucotoxicity (chronically elevated plasma glucose levels) also influences the functionality and survivability of pancreatic β-cells. Short-term exposure of β-cells to increasing glucose concentrations initially induces proliferation of β-cell mass in a concentration-dependent manner.
70 Over time, the proliferative capacity of β-cells is suppressed as demonstrated by Leahy et al. His team noted that cultured human islets undergo linear acceleration of β-cell apoptosis when exposed to glucose concentrations ranging 99 to 594 mg per dL.
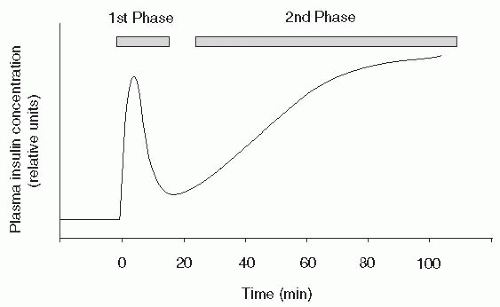
70Insulin secretion from the pancreas occurs in two phases. The first-phase insulin response represents an acute release of insulin from the β-cells (
Fig. 10-6). Normally, this insulin release occurs as β-cells excrete preformed insulin for 10 to 20 minutes after a glucose stimulus. The second-phase
insulin release will continue until the blood glucose level returns to normal, approximately 90 to 180 minutes after eating. First-phase insulin response is genetically predetermined and frequently abnormal in subjects with a first-degree relative with diabetes.
71 (First-phase insulin response is also impaired because of the effects of chronic hyperglycemia on β-cell function and postreceptor signaling, which promote intracellular glucose transport.
72,
73(Direct β-cell death resulting from an elevation in FFA levels will also impair first-phase insulin response.
To summarize, hyperglycemia plays a central role among the factors that contribute to loss of β-cell function. Vitamin D deficiency may predispose susceptible patients to glucose intolerance, altered insulin secretion, and progression to clinical diabetes. Initially, transient postprandial hyperglycemia may induce β-cell proliferation in insulin-resistant individuals. Over time this adaptive mechanism will fail as β-cell dysfunction and death ensue in those who are genetically or environmentally at risk. Aging β-cells may also be more prone to apoptosis. Chronic glucotoxicity induces intracellular oxidative stress when inflammatory cytokine production further impairs the β-cell’s production and insulin secretory capacity. T2DM does not occur in the absence of progressive β-cell failure, although IR is well established early during the natural course of the disease.
Considering the taxing global projections of patients who will eventually develop T2DM, novel strategies and agents will need to be developed that can halt the progression and perhaps either induce a β-cell rest or restore normoglycemia to high-risk patients. Clinical and mathematical assessments of β-cell function will allow investigators to determine the success or failure of pharmacologic interventions designed for β-cell rescue and preservation.
Table 10-11 lists several of the commonly used assessment tools for determining β-cell function in clinical trials.
• Increased Lipogenesis and Free Fatty Acid Production
Fat cells play a pivotal role in the pathogenesis of T2DM. In fact, one may assume that the path toward T2DM will not become activated “until the fat cells begin to sing!” The fat cells travel with an entourage that includes the liver, muscle, and the β-cells. The damaged done metabolically by these four players are rarely detected until patients have been subject to microvascular or macrovascular complications for several years before treatment is initiated.
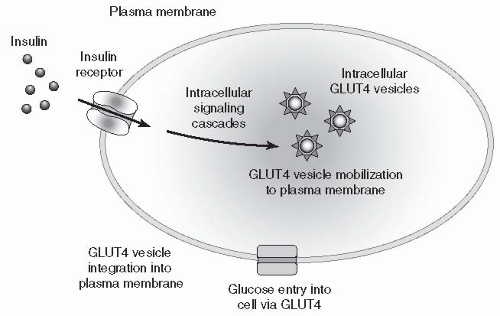
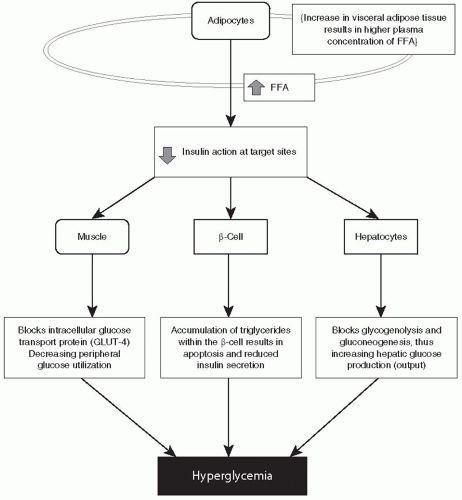
FFAs are responsible for antagonizing insulin action, promoting IR, reducing β-cell responsiveness to ambient hyperglycemia, and inducing β-cell apoptosis. At the cellular level, FFAs inhibit
insulin-mediated glucose uptake by interfering with the translocation of the glucose transport protein, GLUT-4, to the plasma membrane, effectively blocking glucose uptake by muscle cells and increasing peripheral IR (
Fig. 10-7). Elevated FFAs prevent the peripheral uptake of glucose by skeletal muscles and inhibit insulin-mediated suppression of glycogenolysis and gluconeogenesis effectively increasing hepatic glucose production.
74,
75 Animal studies suggest that β-cell failure and death are preceded by an increase in plasma FFAs, accompanied by an accumulation of triglyceride within the β-cell.
76,
77,
78 Figure 10-8 summarizes the relationship between lipotoxicity and T2DM pathogenesis.
Several prospective epidemiologic studies have evaluated the link between elevated plasma concentrations of FFAs and the development of diabetes. In the Pima study, subjects with the highest plasma FFA levels had a 2.3-fold higher risk of developing diabetes than subjects in the lowest decile.
79 In the Paris Prospective Study, higher FFA levels were also associated with progression from normal glucose tolerance at baseline to clinical diabetes.
80Approximately 80% of body fat is located within the subcutaneous adipose tissue, while 20% is stored within visceral (abdominal) adipose tissue (VAT).
81 Individuals with a high accumulation of VAT, as measured by CT imaging, are at increased risk for developing T2DM, dyslipidemia, and coronary heart disease.
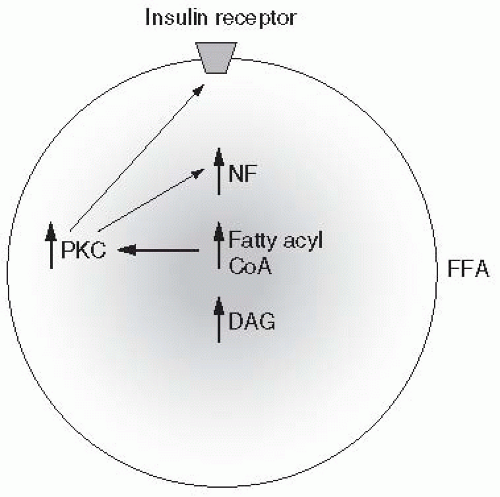
82 Visceral fat produces higher levels of FFA, which explains the link between obesity and the progression to T2DM. Adipocytes in obese individuals are resistant to the antilipolytic effects of insulin. Both T2DM and obesity are characterized by an elevation in the mean day-long plasma FFA concentration as well as increased triglyceride levels within muscle, liver, and β-cells further promoting IR.
Figure 10-9 summarizes the mechanisms by which lipotoxicity depicts the cellular mechanisms by which FFA heightens IR.
Decreased levels of cardiovascular fitness (as reflected by low VO
2max during graded exercise testing) is associated with increased VAT in offspring of patients with T2DM who have evidence of impaired insulin sensitivity.
83,
84 Whether or not obese patients with a strong family history of T2DM may have a form of genetically impaired exercise intolerance is pure speculation. Other studies have proven that intentional weight loss of 25 lb via diet and exercise modulation can result in a 30% to 35% reduction in total body VAT mass.
85 Moreover, consumption of a diet high in saturated fat can acutely increase plasma FFA levels in obese, insulin-resistant patients. Dietary elevation of FFA levels for as little as 48 hours markedly impairs both first- and second-phase insulin secretion in genetically predisposed individuals, further impairing insulin secretion and peripheral disposal.
86In summary, lipotoxicity increases IR in patients with visceral adiposity. Increased FFA production impairs insulin secretion by promoting β-cell death and blocks insulin action within myocytes and hepatocytes heightening IR. Ninety percent of patients with T2DM are considered obese. Dietary consumption that is high in saturated fat increases visceral adiposity that impairs first- and second-phase insulin secretion, peripheral glucose disposal within the skeletal
muscles, and increases hepatic glucose production. The resultant IR is the hallmark of T2DM pathogenesis.
• Insulin Resistance
Both the liver and skeletal muscles are severely resistant to insulin action in patients with T2DM. Excessive hepatic glucose production in patients with T2DM adds an additional 30 g of glucose to the systemic circulation of an 80-kg person each night. The initial response of the β-cell is to accelerate insulin production and secretion to compensate the rise in hepatic glucose output. Even at endogenous insulin secretion rates that exceed threefold normal levels, hepatic glucose production
continues to increase unabated. This leads credence to the belief that 90% of IR is due to defects in the peripheral uptake of glucose in skeletal muscle tissue.
87The skeletal muscles are responsible for absorbing and processing glucose in the postabsorptive state. Patients with T2DM exhibit defective insulin receptor binding and postreceptor signaling.
88,
89 (As glucose clearance in the peripheral skeletal muscle is reduced, IGT and chronic postabsorptive hyperglycemia replace the normal euglycemic state (
Fig. 10-7).
IR may be the best predictor of future T2DM risk. The likelihood that a patient has IR can be assessed by calculating the ratio of one’s plasma triglycerides to HDL-C. A level greater than 3.5 is strongly associated with IR.
90 For example, if a patient’s lipid profile demonstrates a triglyceride level of 500 mg per dL and a HDL-c of 30 mg per dL, the TG:HDL ratio is 17:1. This patient is at increased risk of developing T2DM and should be encouraged to minimize his or her saturated fat intake, initiate a weight reduction diet, eliminate any alcohol consumption, and start a comprehensive exercise program.
To summarize, IR results from defective glucose utilization within peripheral target organs, specifically skeletal muscle cells. Hepatic glucose production rises despite an initial threefold increase in endogenous insulin production. Eventually, the ability of the β-cells to continue their quest toward producing optimal insulin levels will end as their exposure to increasing plasma levels of hyperglycemia result in apoptosis.
• Hyperglucagonemia
Basal plasma glucagon concentration is elevated in patients with T2DM and their hepatocytes appear to be hypersensitive to the stimulatory effect of glucagon in inducing gluconeogenesis.
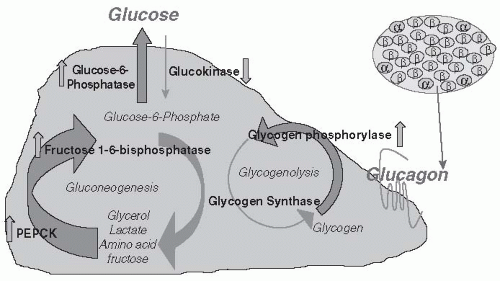
91Glucagon is normally secreted from pancreatic α cells located around the periphery of the islet in response to a hypoglycemic trigger. The protective mechanism of glucagon activates hepatic gluconeogenesis and glycogenolysis, thereby raising ambient glucose levels (
Fig. 10-10). Under normal conditions, a postprandial increase in glucose concentration is associated with a corresponding reduction in glucagon. As plasma glucose levels decrease, glucagon levels increase, resulting in a 60% increase in hepatic glucose production and output through gluconeogenesis.
92 Glucagon secretion is regulated, in part, by endogenous insulin secretion. Insulin action results in the storage of
glycogen within hepatocytes. IR, insulinopenia, or an increase in glucagon output signals the liver to depolymerize glycogen, resulting in a rise in plasma glucose concentration. Paradoxically, glucagon secretion is substantially elevated in the fasting state and is not suppressed during the postabsorptive phase in patients with both prediabetes and clinically apparent diabetes. The hypersensitivity of glucagon toward promoting gluconeogenesis in T2DM promotes chronic hyperglycemia and intensifies IR.
Drugs that inhibit glucagon secretion or antagonize the glucagon receptor, such as exenatide and liraglutide, are effective in treating patients with type 2 and possibly T1DM.
93,
94,
95Fasting hyperglucagonemia is an early defect in the pathogenesis of T2DM. Analysis of islet hormones in young obese adolescent subjects demonstrated significantly increased levels of fasting glucagon, particularly in obese individuals with IR or IGT. Glucagon secretion was appropriately suppressed by glucose or insulin in these subjects.
96
• Impaired Incretin Effect
The incretin effect refers to a phenomenon in which oral glucose administration elicits a much higher insulin secretory response than an equimolar intravenous infusion of glucose.
97 In humans, the incretin effect is mediated by two peptide hormones, GLP-1 and glucose-dependent insulinotropic polypeptide (GIP).
Contradicting information has been published regarding the secretion of GLP-1 in response to oral glucose in T2DM patients. Both elevated and reduced postchallenge responses have been described.
94 The plasma levels of dipeptidyl peptidase 4 (DPP-4), which rapidly degrades GLP-1 following its meal-stimulated release from the small and large intestinal L-cells, are similar in euglycemic individuals and patients with diabetes.
94 As a consequence of the action of DPP-4, as well as rapid renal clearance, the half-life of GLP-1 is 1 to 2 minutes and that of GIP is approximately 7 minutes.
94 Basal (fasting) concentrations of GLP-1 are approximately 5 pmol per L, while peak concentrations of approximately 15 to 40 pmol per L are observed 1 hour after eating.
94 Although small reductions in postprandial GLP-1 secretion may occur in patients with T2DM,
these observations do not appear to have a meaningful physiologic effect on glucose metabolism and insulin secretion.
98The effects of both GLP-1 and GIP are expressed by specific receptors present on β-cells and other target tissues. GLP-1 and GIP increase insulin secretion from β-cells in a glucose-dependent manner. In rodents, GLP-1 and GIP also enhance β-cell mass by increasing rates of proliferation and decreasing rates of apoptosis.
99 This effect, however, has not been observed in humans. GLP-1 suppresses glucagon secretion, slows gastric emptying, and enhances satiety. GIP has a direct effect on adipocytes to promote triglyceride storage.
99 Taken together, the incretin hormones provide a physiologic response to meals of variable sizes allowing for optimal metabolic control of nutrients.
In patients with T2DM, the incretin effect is reduced by approximately 50% compared with euglycemic subjects.
99 The defect appears to be secondary to impairments in incretin hormone action (resistance) rather than secretion because most studies have found comparable circulating concentrations of GLP-1 and GIP in response to nutrient challenges in subjects with T2DM and normal controls.
99 The glucodynamic effects observed in GLP-1-deficient patients may be overcome by infusing native GLP-1 subcutaneously to achieve “pharmacologic” plasma levels.
100 However, pharmacologic replacement of GIP does not appear to restore glycemic control to patients with IGT.
Interestingly, GLP-1 resistance in some individuals may be secondary to a genetic defect affecting the receptor binding site. Defective GLP-1 receptor binding may result in loss of intracellular signaling and reduced expression of hormonal action. A single nucleotide polymorphism (SNP) in which methionine is substituted for threonine at position 149 of GLPIR on the receptor binding site has been identified.
101 When present, this defect results in an altered insulin secretory response to GLP-1 infusion.
Glucose toxicity may down-regulate GLP-1 receptor expression.
99 However, improvement in glucose control and reversal of glucose toxicity with both DPP-4 inhibitors and GLP-1 analogues can restore β-cell function and perhaps receptor responsiveness to endogenous GLP-1.
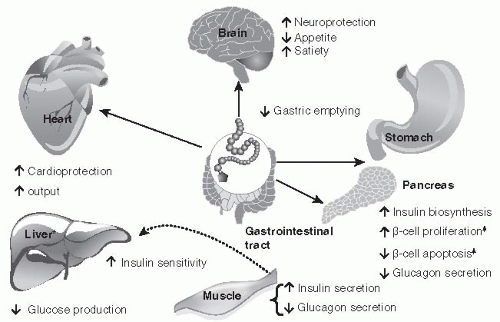
94In summary, resistance to the stimulatory effects of the gut hormone actions on insulin secretion and glucagon suppression (
Fig. 10-11) suggest that GLP-1 and GIP contribute to the pathogenesis of T2DM.
• Renal Influence on Insulin Resistance
The role of the kidneys in maintaining normoglycemia, through the filtration and reabsorption of glucose as well as gluconeogenesis, is well established. Euglycemic individuals filter approximately 180 L of plasma and 180 g of glucose through the kidneys daily.
102Under normal conditions, the ability of the kidneys to reabsorb glucose from the glomerular filtrate is extremely effective with less than 0.5 g per day of the filtered glucose ultimately appearing in the urine. However, in patients with hyperglycemia, the amount of filtered glucose reabsorbed increased in proportion to the plasma glucose concentration until the resorptive capacity of the proximal convoluted tubules of the glomerulus is exceeded. At this point, the excess glucose is excreted into the urine and is detected as glycosuria
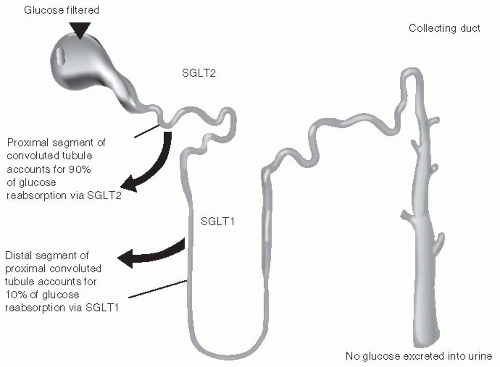
Glucose reabsorption is accomplished via the active high-capacity transport protein sodiumglucose transporter-2 (SGLT 2). SGLT2 is expressed predominantly in the kidneys and is located in the brush border membrane of the S1 segment of the proximal tubule. The remainder of the glucose is reabsorbed from the distal S3 segment of the proximal tubule by the low-capacity sodium glucose cotransporter-1 (SGLT1).
103 (see
Fig. 10-12).
In patients with diabetes, the SGLT 2 transport mechanism is as potent as in euglycemic individuals. This appears to be an adaptive response by the kidneys to conserve glucose, which is required to meet the energy demands of the brain and cardiovascular system in the presence of severe IR. Thus, an individual with IR is incorrectly “marked” as developing intracellular starvation of nutrients. In an attempt to correct this pathologic defect, the kidneys reabsorb excessive amounts of glucose hoping that this energy source will ease the burden of the brain,
skeletal muscle, and cardiovascular system all of which appear to be unable to transport glucose intracellularly.
Drugs that are able to normalize plasma glucose levels by antagonizing the action of proximal tubule protein transporters appear to be an attractive pharmacologic target for both T1DM and T2DM. Simply increasing urinary glucose excretion without causing weight gain, negatively affecting β-cell function while minimizing the risk of hypoglycemia should offer positive therapeutic options to many patients.
• Impaired Neuroprotection
Few would argue that the current epidemic of diabetes is driven by the epidemic of obesity. Could the IR seen in peripheral tissues also extend into the central nervous system?
The direct administration of GLP-1 into the third cerebral ventricle of rats augments glucosestimulated insulin secretion as the brain attempts to overcome a state of acute hyperglycemia.
104 In addition, when GLP-1 is directly administered into the arcuate nucleus of the hypothalamus hepatic glucose production is reduced.
105 Food intake is reduced when GLP-1 was injected directly into the paraventricular nucleus.
106 Thus, GLP-1 receptor expression is based upon their unique location within the brain. Stimulation of those receptors within the arcuate nucleus lowers basal and postprandial glucose levels, whereas expression of GLP-1 receptors in the paraventricular nucleus will induce satiety.
Functional magnetic resonance imaging (MRI) has been used to evaluate the cerebral response to an ingested glucose load in obese subjects.
107 Following glucose ingestion, the ventromedial nuclei and the paraventricular nuclei demonstrated consistent inhibition. These are the key centers in the brain that regulated appetite. Whether the impaired functional MRI response in obese subjects contributes to or is a consequence of IR and weight gain is unclear. However, these results suggest that in patients with impaired glucose metabolism, the brain may not only be insulin resistant, but may also have additional defects in GLP-1 expression and secretion.
108In summary, the pathogenesis of T2DM is multifactorial. Genetically or environmentally “challenged” individuals begin the transformation from euglycemia toward clinically apparent T2DM as their skeletal muscles and hepatocytes exhibit evidence of IR. Initially, pancreatic β-cells attempt to compensate for the IGT by overproducing insulin. Perhaps patient’s appetites are increased at this early phase of prediabetes. As their meal portions increase, so does the secretion of GLP-1, resulting in β-cell hypertrophy. Over time, other metabolic defects appear that tend to aggravate the existing state of hyperglycemia. Accelerated adipocyte-centered lipolysis heightens plasma levels of circulating FFA, thereby promoting IR and β-cell apoptosis. As glycemic control deteriorates, the renal threshold for glucose excretion is exceeded. SGLT2 levels are elevated and the renal absorption of glucose is paradoxically increased as if the kidneys believed that the body required additional glucose to meet energy demands. Meanwhile, neuroprotective mechanisms within the central nervous system are also flawed as the brain is unable to minimize hepatic glucose production or induce satiety. At the cellular level, defective receptor signaling and glucose transport have occurred. Glucose is unable to enter or provide fuel for skeletal muscle cells. Hyperglycemia tends to favor GLP-1 receptor resistance. As a result, meal-stimulated GLP-1 production by the intestinal L-cells cannot effectively stimulate insulin secretion by the pancreatic β-cells. Due to the theoretical communication between β-cells and α-cells, a defect in β-cell function may result in inappropriate glucagon production that would stimulate hepatic gluconeogenesis.

Genetic Susceptibility for T2DM and MODY
The development of T2DM diabetes is strongly influenced by genetics. Thirty-nine percent of patients with T2DM have at least one parent with the disease.
109 The lifetime risk for a firstdegree relative of a patient with T2DM diabetes is 5 to 10 times higher than that of age- and weight-matched subjects without a family history of diabetes.
110 Among monozygotic twin pairs with one affected twin, T2DM eventually develops in 60% to 90% of unaffected twins.
109 Firstdegree relatives of patients with T2DM often have IGT, delayed first-phase insulin response, and β-cell dysfunction years before diabetes develops.
111,
112Approximately 2% to 5% of patients with T2DM who are first seen at a young age have mild disease and show autosomal dominant transmission. This condition was formerly called maturityonset diabetes of the young (MODY). In 2006, the International Society of Pediatrics and Adolescent Diabetes renamed MODY “monogenetic diabetes.”
113 In the new classification, the MODY subtypes have been eliminated and replaced by specific descriptions of the known genetic defects. Six different genetic abnormalities have been identified. The currently recognized genetic defects of β-cell function are described in
Table 10-12.
MODY is an autosomal dominant
single gene phenotype of youth-onset diabetes occurring typically prior to age 25, whereas T2DM is of polygenic origin. MODY can occur at any age resulting in the
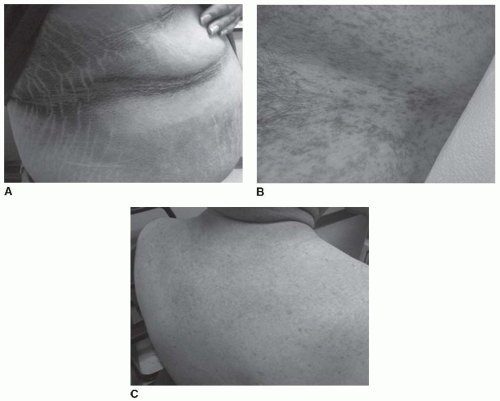
limited release of insulin in response to a glucose stimulus. Unlike MODY patients, individuals with T2DM have evidence of IR including central obesity, low HDL-c, elevated triglycerides, acanthosis nigricans, and hypertension. Patients with MODY are nonketotic and noninsulin dependent.
Patients are typically lean and white.
114 The presence of autoantibodies, such as GAD, IA-2 autoantibodies and insulin autoantibodies are pathognomonic for T1DM.
MODY patients display a variable course in severity and rate of progression of hyperglycemia and loss of endogenous insulin production. In many MODY families, microvascular and macrovascular complications occur in a frequency similar to the pattern observed in patients with T2DM.
115Patients with MODY3 have a genetic mutation in their glucokinase gene (HNF1A).
116 Glucokinase (expressed in both hepatocytes and pancreatic islet cells) performs as an intracellular glucose sensor and plays a crucial role in regulating insulin secretion in response to plasma glucose
concentrations. Normal functioning glucokinase levels will allow maintenance of one’s blood glucose levels in the fasting state between 85 and 99 mg per dL. A mutation in the glucokinase (GK) gene will cause the ambient glucose level to rise to greater than 100 mg per dL. Most often, fasting blood glucose levels are mildly elevated (110 to 140 mg per dL) and recognizable in the perinatal period. Postprandial hyperglycemia is minimal. Patients lack progression of diabetes, demonstrate an absence of insulin requirement, and do not develop vascular complications.
115Five other types of MODY have been identified involving mutations in transcription factor genes that control the way that insulin is produced by the pancreatic β-cells (HNF-1 α, HNF-1 β, HNF-4α, IPF-1, and NEURO-D1). Each form of MODY produces a slightly different clinical form of diabetes.
115A typical MODY patient may present between 12 and 30 years of age with slowly advancing abnormal glucose tolerance. In some patients with MODY, T2DM may NOT become apparent unless endogenous insulin requirements substantially increase such as during superimposed obesity, pregnancy, or periods of prolonged physical inactivity. Patients are nonobese. Both a parent and a grandparent will have diabetes. MODY patients are typically asymptomatic and may have been misdiagnosed with T1DM years prior due to their young age. Any young patient who appears to have T1DM, a strong family history of diabetes, has measurable C-peptide levels, yet tests GAD-65 (autoantibody) negative should undergo genetic testing to determine the presence of MODY.
117 Genetic testing will disclose whether MODY is present and will distinguish between a subtype of MODY, providing clues to both prognosis and treatment. Once a diagnosis for MODY is established, other family members, whether or not they are symptomatic, should be screened for the family-specific mutation and possible abnormalities of carbohydrate metabolism associated with that anomaly. Patients should also be screened with the following tests: A1C, fasting plasma glucose, 2-hour postglucose levels, 1-hour postglucose levels, and OGTT.
115 Further information regarding MODY testing may be obtained through Athena Diagnostics (http://www.athenadiagnostics.com/content/diagnostic-ed/endocrinology/mody).
Other genetic influences for the development of T2DM may be entirely “nonspecific.” For example, genes that regulate appetite, energy expenditure, and intra-abdominal fat accumulation may increase the likelihood of a patient becoming obese. These “diabetes-related genes” would enhance the progression of euglycemia toward IGT and β-cell dysfunction under the influence of certain environmental factors (smoking, alcohol, reduction in serum vitamin D levels, increased BMI, loss of incretin response, etc).
118 An individual with a specific mutation in the insulin receptor gene may develop IR sooner than a patient who does not have this genetic defect. Thus, the heterogeneous nature of T2DM often makes genetic determination of pathogenesis very complex.
Patients with MODY1 and 3 may be treated with sulfonylureas.
119 Early intensive intervention with sulfonylureas appears to slow the decline of β-cell mass that occurs in these patients.
115 Diets low in carbohydrates, and intensive exercise will improve peripheral glucose uptake. Glinides may reduce the risk of hypoglycemia in patients with MODY.
120Glucokinase (GK) would be an excellent therapeutic target. GK is an intracellular glucose sensor in pancreatic β-cells and a rate-controlling enzyme for hepatic glucose clearance and glycogen synthesis. These metabolic processes are defective in T2DM. Patients with T2DM appear to have a reduction in GK function. Within hepatocytes, GK expression is severely reduced because the actions of GK are entirely insulin dependent.
121 In euglycemia, hyperglycemia induces GK expression in the β-cells 5- to 10-fold, resulting in insulin synthesis and secretion. Glucokinase activators (GKAs) have been shown to potentiate the glucose-stimulated release of insulin by β-cells. They also augment the receptor action of GLP-1 on target organs, thereby increasing glucose stimulation and insulin biosynthesis.
122 GKAs lower hepatic glucose production in normal and diabetic rats.
123 Some concerns related to the GKA drug class include hypoglycemia induction, fatty liver infiltration, and hyperlipidemia. The GKAs that are currently in development are shown in
Table 10-13.
GLP-1 analogues such as exenatide and DPP-4 inhibitors may be a useful therapeutic option for patients diagnosed with MODY1. Clinically, such individuals develop progressive insulinopenia with advancing age, although initially sulfonylureas are effective at maintaining euglycemia.
First-phase insulin response is absent and lipid panels are abnormal (low apo C2, apo C3, Lp (a), and triglycerides). GLP-1 analogues appear to enhance first-phase insulin release and may prove beneficial in patients identified with this form of monogenetic diabetes.
124,
125


