Diagnosis
Appearances to the mind are of four kinds. Things either are what they appear to be; or they neither are, nor appear to be; or they are, and do not appear to be; or they are not, yet appear to be. Rightly to aim in all these cases is the wise man’s task.
— Epictetus† 2nd century A.D.
KEY WORDS
Diagnostic test
True positive
True negative
False positive
False negative
Gold standard
Reference standard
Criterion standard
Sensitivity
Specificity
Cutoff point
Receiver operator characteristic (ROC) curve
Spectrum
Bias
Predictive value
Positive predictive value
Negative predictive value
Posterior (posttest) probability
Accuracy
Prevalence
Prior (pretest) probability
Likelihood ratio
Probability
Odds
Pretest odds
Posttest odds
Parallel testing
Serial testing
Clinical prediction rules
Diagnostic decisionmaking rules
Clinicians spend a great deal of time diagnosing complaints or abnormalities in their patients, generally arriving at a diagnosis after applying various diagnostic tests. Clinicians should be familiar with basic principles when interpreting diagnostic tests. This chapter deals with those principles.
A diagnostic test is ordinarily understood to mean a test performed in a laboratory, but the principles discussed in this chapter apply equally well to clinical information obtained from history, physical examination, and imaging procedures. They also apply when a constellation of findings serves as a diagnostic test. Thus, one might speak of the value of prodromal neurologic symptoms, headache, nausea, and vomiting in diagnosing classic migraine, or of hemoptysis and weight loss in a cigarette smoker as an indication of lung cancer.
SIMPLIFYING DATA
In Chapter 3, we pointed out that clinical measurements, including data from diagnostic tests, are expressed on nominal, ordinal, or interval scales. Regardless of the kind of data produced by diagnostic tests, clinicians generally reduce the data to a simpler form to make them useful in practice. Most ordinal scales are examples of this simplification process. Heart murmurs can vary from very loud to barely audible, but trying to express subtle gradations in the intensity of murmurs is unnecessary for clinical decision making. A simple ordinal scale—grades I to VI—serves just as well. More often, complex data are reduced to a simple dichotomy (e.g., present/absent, abnormal/normal, or diseased/well). This is done particularly when test results are used to help determine treatment decisions, such as the degree of anemia that requires transfusion. For any given test result, therapeutic decisions are either/or decisions; either treatment is begun or it is withheld. When there are gradations of therapy according to the test result, the data are being treated in an ordinal fashion.
Example
The use of blood pressure data to decide about therapy is an example of how information can be simplified for practical clinical purposes. Blood pressure is ordinarily measured to the nearest 1 mm Hg (i.e., on an interval scale). However, most hypertension treatment guidelines, such as those of the Joint National Committee on the Detection, Evaluation, and Treatment of Hypertension (1), choose a particular level (e.g., 140 mm Hg systolic pressure or 90 mm Hg diastolic pressure) at which to initiate drug treatment. In doing so, they transformed interval data into dichotomous data. To take the example further, turning the data into an ordinal scale, the Joint National Committee also recommends that physicians choose a treatment plan according to whether the patient’s blood pressure is “prehypertension” (systolic 120 to 139 mm Hg or diastolic 80 to 89 mm Hg), “stage 1 hypertension” (systolic 140 to 159 mm Hg or diastolic 90 to 99 mm Hg), or “stage 2 hypertension” (systolic ≥160 mm Hg or diastolic ≥100 mm Hg).
THE ACCURACY OF A TEST RESULT
Diagnosis is an imperfect process, resulting in a probability rather than a certainty of being right. The doctor’s certainty or uncertainty about a diagnosis has been expressed by using terms such as “rule out” or “possible” before a clinical diagnosis. Increasingly, clinicians express the likelihood that a patient has a disease as a probability. That being the case, it behooves the clinician to become familiar with the mathematical relationships between the properties of diagnostic tests and the information they yield in various clinical situations. In many instances, understanding these issues will help the clinician reduce diagnostic uncertainty. In other situations, it may only increase understanding of the degree of uncertainty. Occasionally, it may even convince the clinician to increase his or her level of uncertainty.
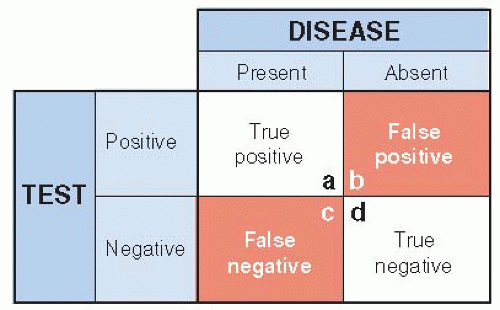
A simple way of looking at the relationships between a test’s results and the true diagnosis is shown in Figure 8.1. The test is considered to be either positive (abnormal) or negative (normal), and the disease is either present or absent. There are then four possible types of test results, two that are correct (true) and two that are wrong (false). The test has given the correct result when it is positive in the presence of disease (true positive) or negative in the absence of the disease (true negative). On the other hand, the test has been misleading if it is positive when the disease is absent (false positive) or negative when the disease is present (false negative).
The Gold Standard
A test’s accuracy is considered in relation to some way of knowing whether the disease is truly present or not—a sounder indication of the truth often referred to as the gold standard (or reference standard or criterion standard). Sometimes the standard of accuracy is itself a relatively simple and inexpensive test, such as a rapid streptococcal antigen test (RSAT) for group A streptococcus to validate the clinical impression of strep throat or an antibody test for human immunodeficiency virus infection. More often, one must turn to relatively elaborate, expensive, or risky tests to be certain whether the disease is present or absent. Among these are biopsy, surgical exploration, imaging procedures, and of course, autopsy.
For diseases that are not self-limited and ordinarily become overt over several months or even years after a test is done, the results of follow-up can serve as a gold standard. Screening for most cancers and chronic, degenerative diseases fall into this category. For them, validation is possible even if on-the-spot confirmation of a test’s performance is not feasible because the immediately available gold standard is too risky, involved, or expensive. If follow-up is used, the length of the follow-up period must be long enough for the disease to declare itself, but not so long that new cases can arise after the original testing (see Chapter 10).
Because it is almost always more costly, more dangerous, or both to use more accurate ways of establishing the truth, clinicians and patients prefer simpler tests to the rigorous gold standard, at least initially. Chest x-rays and sputum smears are used to determine the cause of pneumonia, rather than bronchoscopy and lung biopsy for examination of the diseased lung tissue. Electrocardiograms and blood tests are used first to investigate the possibility of acute myocardial infarction, rather than catheterization or imaging procedures. The simpler tests are used as proxies for more elaborate but more accurate or precise ways of establishing the presence of disease, with the understanding that some risk of misclassification results. This risk is justified by the safety and convenience of the simpler tests. But simpler tests are only useful when the risks of misclassification are known and are acceptably low. This requires a sound comparison of their accuracy to an appropriate standard.
Lack of Information on Negative Tests
The goal of all clinical studies aimed at describing the value of diagnostic tests should be to obtain data for all four of the cells shown in Figure 8.1. Without all these data, it is not possible to fully evaluate the accuracy of the test. Most information about the value of a diagnostic test is obtained from clinical, not research, settings. Under these circumstances, physicians are using the test in the care of patients. Because of ethical concerns, they usually do not feel justified in proceeding with more exhaustive evaluation when preliminary diagnostic tests are negative. They are naturally reluctant to initiate an aggressive workup, with its associated risk and expense, unless preliminary tests are positive. As a result, data on the number of true negatives and false negatives generated by a test (cells c and d in Fig. 8.1) tend to be much less complete in the medical literature than data collected about positive test results.
This problem can arise in studies of screening tests because individuals with negative tests usually are not subjected to further testing, especially if the testing involves invasive procedures such as biopsies. One method that can get around this problem is to make use of stored blood or tissue banks. An investigation of prostate-specific antigen (PSA) testing for prostate cancer examined stored blood from men who subsequently developed prostate cancer and men who did not develop prostate cancer (2). The results showed that for a PSA level of 4.0 ng/mL, sensitivity over the subsequent 4 years was 73% and specificity was 91%. The investigators were able to fill in all four cells without requiring further testing on people with negative test results. (See the following text for definitions of sensitivity and specificity.)
Lack of Information on Test Results in the Nondiseased
Some types of tests are commonly abnormal in people without disease or complaints. When this is so, the test’s performance can be grossly misleading when the test is applied to patients with the condition or complaint.
Example
Magnetic resonance imaging (MRI) of the lumbar spine is used in the evaluation of patients with low back pain. Many patients with back pain show herniated intervertebral discs on MRI, and the pain is often attributed to the finding. But, how often are vertebral disc abnormalities found in people who do not have back pain? Several studies done on subjects without a history of back pain or sciatica have found herniated discs in 22% to 58% and bulging discs in 24% to 79% of asymptomatic subjects with mean ages of 35 to more than 60 years old (3). In other words, vertebral disc abnormalities are common and may be a coincidental finding in a patient with back pain.
Lack of Objective Standards for Disease
For some conditions, there are simply no hard-and-fast criteria for diagnosis. Angina pectoris is one of these. The clinical manifestations were described nearly a century ago, yet there is still no better way to substantiate the presence of angina pectoris than a carefully taken history. Certainly, a great many objectively measurable phenomena are related to this clinical syndrome, for example, the presence of coronary artery stenosis on angiography, delayed perfusion on a thallium stress test, and characteristic abnormalities on electrocardiograms both at rest and with exercise. All are more commonly found in patients believed to have angina pectoris, but none is so closely tied to the clinical syndrome that it can serve as the standard by which the condition is considered present or absent.
Other examples of medical conditions difficult to diagnose because of the lack of simple gold standard
tests include hot flashes, Raynaud’s disease, irritable bowel syndrome, and autism. In an effort to standardize practice, expert groups often develop lists of symptoms and other test results that can be used in combination to diagnose the clinical condition. Because there is no gold standard, however, it is possible that these lists are not entirely correct. Circular reasoning can occur—the validity of a laboratory test is established by comparing its results to a clinical diagnosis based on a careful history of symptoms and a physical examination, but once established, the test is then used to validate the clinical diagnosis gained from history and physical examination!
tests include hot flashes, Raynaud’s disease, irritable bowel syndrome, and autism. In an effort to standardize practice, expert groups often develop lists of symptoms and other test results that can be used in combination to diagnose the clinical condition. Because there is no gold standard, however, it is possible that these lists are not entirely correct. Circular reasoning can occur—the validity of a laboratory test is established by comparing its results to a clinical diagnosis based on a careful history of symptoms and a physical examination, but once established, the test is then used to validate the clinical diagnosis gained from history and physical examination!
Consequences of Imperfect Gold Standards
Because of such difficulties, it is sometimes not possible for physicians in practice to find information on how well the tests they use compare with a thoroughly trustworthy standard. They must choose as their standard of validity another test that admittedly is imperfect, but is considered the best available. This may force them into comparing one imperfect test against another, with one being taken as a standard of validity because it has had longer use or is considered superior by a consensus of experts. In doing so, a paradox may arise. If a new test is compared with an old (but imperfect) standard test, the new test may seem worse even though it is actually better. For example, if the new test were more sensitive than the standard test, the additional patients identified by the new test would be considered false positives in relation to the old test. Similarly, if the new test is more often negative in patients who really do not have the disease, results for those patients would be considered false negatives compared with the old test. Thus, a new test can perform no better than an established gold standard test, and it will seem inferior when it approximates the truth more closely unless special strategies are used.
Example
Computed tomographic (“virtual”) colonoscopy was compared to traditional (optical) colonoscopy in screening for colon cancer and adenomatous polyps that can be precursors of cancer (4). Both tests were performed on every patient without the clinician interpreting each test knowing the results of the other test. Traditional colonoscopy is usually considered the gold standard for identifying colon cancer or polyps in asymptomatic adults. However, virtual colonoscopy identified more colon cancers and adenomatous polyps (especially those behind folds in the colon) than the traditional colonoscopy. In order not to penalize the new test in comparison to the old, the investigators ingeniously created a new gold standard—a repeat optical colonoscopy after reviewing the results of both testing procedures—whenever there was disagreement between the tests.
SENSITIVITY AND SPECIFICITY
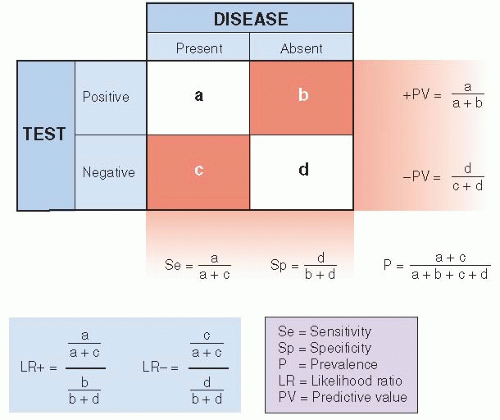
Figure 8.2 summarizes some relationships between a diagnostic test and the actual presence of disease. It is an expansion of Figure 8.1, with the addition of some useful definitions. Most of the remainder of this chapter deals with these relationships in detail.
Example
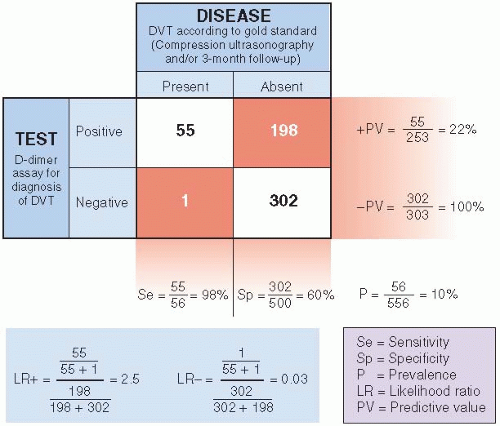
Figure 8.3 illustrates these relationships with an actual study (5). Deep venous thrombosis (DVT) in the lower extremities is a serious condition that can lead to pulmonary embolism; patients with DVT should receive anticoagulation. However, because anticoagulation has risks, it is important to differentiate between patients with and without DVT. Compression ultrasonography is highly sensitive and specific for proximal thrombosis and has been used to confirm or rule out DVT. Compression ultrasonography is expensive and dependent on highly trained personnel, so a search for a simpler diagnostic test was undertaken. Blood tests to identify markers of endogenous fibrinolysis, D-dimer assays, were developed and evaluated for the diagnosis of DVT. Figure 8.3 shows the performance of a D-dimer assay in the diagnosis of DVT. The gold standard in the study was the result of compression ultrasonography and/or a 3-month follow-up.
Definitions
As can be seen in Figure 8.2, sensitivity is defined as the proportion of people with the disease who have a positive test for the disease. A sensitive test will rarely miss people with the disease. Specificity is the proportion of people without the disease who have a negative test. A specific test will rarely misclassify people as having the disease when they do not.
Applying these definitions to the DVT example (Fig. 8.3), we see that 55 of the 56 patients with DVT had positive D-dimer results—for a sensitivity of 98%. However, of the 500 patients who did not have DVT, D-dimer results were correctly negative for only 302, for a specificity of 60%.
Use of Sensitive Tests
Clinicians should take the sensitivity and specificity of a diagnostic test into account when selecting a test. A sensitive test (i.e., one that is usually positive in the presence of disease) should be chosen when there is an important penalty for missing a disease. This would be so, for example, when there is reason to suspect a dangerous but treatable condition, such as tuberculosis, syphilis, or Hodgkin lymphoma, or in a patient suspected of having DVT. Sensitive tests are also helpful during the early stages of a diagnostic workup, when several diagnoses are being considered, to reduce the number of possibilities. Diagnostic tests are used in these situations to rule out diseases with a negative result of a highly sensitive test (as in the DVT example). As another example, one might choose the highly sensitive HIV antibody test early in the evaluation of lung infiltrates and weight loss to rule out an AIDS-related infection. In summary, a highly sensitive test is most helpful to the clinician when the test result is negative.
Use of Specific Tests
Specific tests are useful to confirm (or “rule in”) a diagnosis that has been suggested by other data. This is because a highly specific test is rarely positive in the absence of disease; it gives few false-positive results. (Note that in the DVT example, the D-dimer test was not specific enough [60%] to initiate treatment after a positive test. All patients with positive results underwent compression ultrasonography, a much more specific test.) Highly specific tests are particularly needed when false-positive results can harm the patient physically, emotionally, or financially. Thus, before patients are subjected to cancer chemotherapy, with all its attendant risks, emotional trauma, and financial costs, tissue diagnosis (a highly specific test) is generally required. In summary, a highly specific test is most helpful when the test result is positive.
Trade-Offs between Sensitivity and Specificity
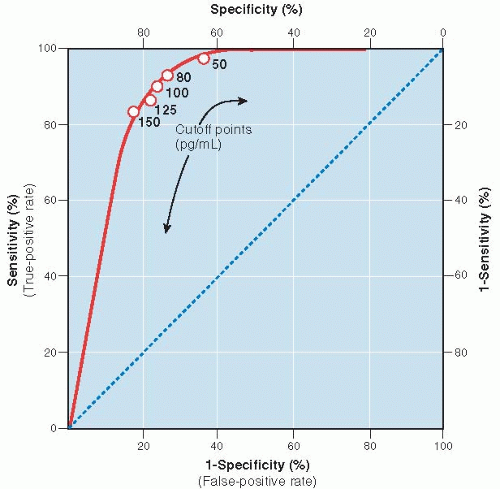
It is obviously desirable to have a test that is both highly sensitive and highly specific. Unfortunately, this is often not possible. Instead, whenever clinical data take on a range of values, there is a trade-off between the sensitivity and specificity for a given diagnostic test. In those situations, the location of a cutoff point, the point on the continuum between normal and abnormal, is an arbitrary decision. As a consequence, for any given test result expressed on a continuous scale, one characteristic, such as sensitivity, can be increased only at the expense of the other (e.g., specificity). Table 8.1 demonstrates this interrelationship for the use of B-type natriuretic peptide (BNP) levels in the diagnosis of congestive heart failure among patients presenting to emergency departments with acute dyspnea (6). If the cutoff level of the test were set too low (≥50 pg/mL), sensitivity is high (97%), but the trade-off is low specificity (62%), which would require many patients without congestive heart failure to undergo further testing for it. On the other hand, if the cutoff level were set too high (≥150 pg/mL), more patients with congestive heart failure would be missed. The authors suggested that an acceptable compromise would be a cutoff level of 100 pg/mL, which has a sensitivity of 90% and a specificity of 76%. There is no way, using a BNP test alone, that one can improve both the sensitivity and specificity of the test at the same time.
Table 8.1 Trade-Off between Sensitivity and Specificity When Using BNP Levels to Diagnose Congestive Heart Failure | |||||||||||||||||||||
|---|---|---|---|---|---|---|---|---|---|---|---|---|---|---|---|---|---|---|---|---|---|
| |||||||||||||||||||||
The Receiver Operator Characteristic (ROC) Curve
Another way to express the relationship between sensitivity and specificity for a given test is to construct a curve, called a receiver operator characteristic (ROC) curve. An ROC curve for the BNP levels in Table 8.1 is illustrated in Figure 8.4. It is constructed by plotting the true-positive rate (sensitivity) against the false-positive rate (1 — specificity) over a range of cutoff values. The values on the axes run from a probability of 0 to 1 (0% to 100%). Figure 8.4 illustrates visually the trade-off between sensitivity and specificity.
Tests that discriminate well crowd toward the upper left corner of the ROC curve; as the sensitivity is progressively increased (the cutoff point is lowered), there is little or no loss in specificity until very high levels of sensitivity are achieved. Tests that perform less well have curves that fall closer to the diagonal running from lower left to upper right. The diagonal shows the relationship between true-positive and false-positive rates for a useless test—one that gives no additional information to what was known before the test was performed, equivalent to making a diagnosis by flipping a coin.
The ROC curve shows how severe the trade-off between sensitivity and specificity is for a test and can be used to help decide where the best cutoff point should be. Generally, the best cutoff point is at or near the “shoulder” of the ROC curve, unless there are clinical reasons for minimizing either false negatives or false positives.
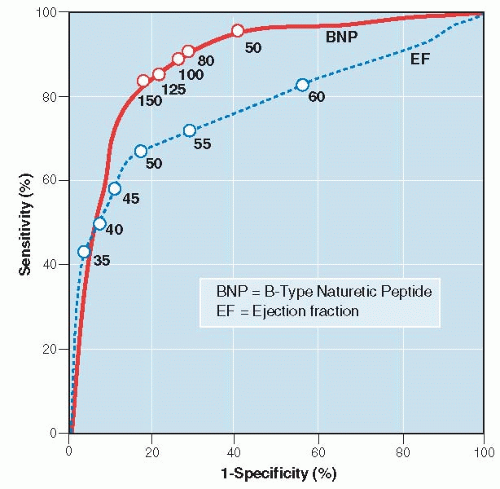
ROC curves are particularly valuable ways of comparing different tests for the same diagnosis. The overall accuracy of a test can be described as the area under the ROC curve; the larger the area, the better the test. Figure 8.5 compares the ROC curve for BNP to that of an older test, ventricular ejection fraction determined by electrocardiography (7). BNP is both more sensitive and more specific, with a larger area
under the curve (0.89) than that for ejection fraction (0.78). It is also easier and faster to obtain in an emergency setting—test characteristics important in clinical situations when quick results are needed.
under the curve (0.89) than that for ejection fraction (0.78). It is also easier and faster to obtain in an emergency setting—test characteristics important in clinical situations when quick results are needed.
Obviously, tests that are both sensitive and specific are highly sought after and can be of enormous value. However, practitioners must frequently work with tests that are not both highly sensitive and specific. In these instances, they must use other means of circumventing the trade-off between sensitivity and specificity. The most common way is to use the results of several tests together, as discussed later in this chapter.
ESTABLISHING SENSITIVITY AND SPECIFICITY
Often, a new diagnostic test is described in glowing terms when first introduced, only to be found wanting later when more experience with it has accumulated. Initial enthusiasm followed by disappointment arises not from any dishonesty on the part of early investigators or unfair skepticism by the medical community later. Rather, it is related to limitations in the methods by which the properties of the test were established in the first place. Sensitivity and specificity may be inaccurately described because an improper gold standard has been chosen, as discussed earlier in this chapter. In addition, two other issues related to the selection of diseased and nondiseased patients can profoundly affect the determination of sensitivity and specificity as well. They are the spectrum of patients to which the test is applied and bias in judging the test’s performance. Statistical uncertainty, related to studying a relatively small number of patients, also can lead to inaccurate estimates of sensitivity and specificity.
Spectrum of Patients
Difficulties may arise when the patients used to describe the test’s properties are different from those to whom the test will be applied in clinical practice. Early reports often assess the test’s characteristics among people who are clearly diseased compared with people who are clearly not diseased, such as medical student volunteers. The test may be able to distinguish between these extremes very well but perform less well when differences are subtler. Also, patients with disease often differ in severity, stage, or duration of the disease, and a test’s sensitivity will tend to be higher in more severely affected patients.
Example
Ovarian cancer, the fourth most common non-skin cancer in women, has spread beyond the ovary by the time it is clinically detected in most patients, and 5-year survival rates for such patients are about 30%. Because there is no effective screening test for ovarian cancer, guidelines were developed for early referral of patients with pelvic masses to Ob-Gyn specialists, with the hope of catching the disease at a curable stage. A study was done of the guidelines’ accuracy in patients evaluated for a pelvic mass (8). In postmenopausal patients, the overall guideline sensitivity was 93% and specificity was 60%. However, when examined by cancer stage, sensitivity for early stage was lower than for late stage disease, 80% versus 98%. Ten of the 14 primary ovarian cancers missed by using the guidelines were the earliest stage I. Thus, the sensitivity for the guidelines to detect ovarian cancer depended on the particular mix of stages of patients with disease used to describe the test characteristics. Ironically, in the case of ovarian cancer, sensitivity of the guidelines was lowest for the stage that would be clinically most useful.
Some people in whom disease is suspected may have other conditions that cause a positive test, thereby increasing the false-positive rate and decreasing specificity. In the example of guidelines for ovarian cancer evaluation, specificity was low for all cancer stages (60%). One reason for this is that levels of the cancer marker, CA-125, recommended by guidelines, are elevated by many diseases and conditions other than ovarian cancer. These extraneous conditions decreased the specificity and increased the false-positive rate of the guidelines. Low specificity of diagnostic and screening tests is a major problem for ovarian cancer and can lead to surgery on many women without cancer.
Disease spectrum and prevalence of disease are especially important when a test is used for screening instead of diagnosis (see Chapter 10 for a more detailed discussion of screening). In theory, the sensitivity and specificity of a test are independent of the prevalence of diseased individuals in the sample in which the test is being evaluated. (Work with Fig. 8.2 to confirm this for yourself.) In practice, however, several characteristics of patients, such as stage and severity of disease, may be related to both the sensitivity and the specificity of a test and to the prevalence because different kinds of patients are found in high-and low-prevalence situations. Screening for disease illustrates this point; screening involves the use of the test in an asymptomatic population in which the prevalence of the disease is generally low and the spectrum of disease favors earlier and less severe cases. In such situations, sensitivity tends to be lower and specificity higher than when the same test is applied to patients suspected of having the disease, more of whom have advanced disease.
Example
A study was made of the sensitivity and specificity of the clinical breast examination for breast cancer in about 750,000 women (9). When the clinical breast examination was used as a diagnostic test on women with breast complaints, the sensitivity and specificity for breast cancer were 85% and 73%, respectively. However, when the same examination was used as a screening test on women who had no breast symptoms, sensitivity fell to 36% and specificity rose to 96%.
Bias
The sensitivity and specificity of a test should be established independently of the means by which the true diagnosis is established. Otherwise, there could be a biased assessment of the test’s properties. As already pointed out, if the test is evaluated using data obtained during the course of a clinical evaluation of patients suspected of having the disease in question, a positive test may prompt the clinician to continue pursuing
the diagnosis, increasing the likelihood that the disease will be found. On the other hand, a negative test may cause the clinician to abandon further testing, making it more likely that the disease, if present, will be missed.
the diagnosis, increasing the likelihood that the disease will be found. On the other hand, a negative test may cause the clinician to abandon further testing, making it more likely that the disease, if present, will be missed.
Therefore, when the sensitivity and specificity of a test are being assessed, the test result should not be part of the information used to establish the diagnosis. In studying DVT diagnosis by D-dimer assay (discussed earlier), the investigators made sure that the physicians performing the gold standard tests (ultrasonography and follow-up assessment) were unaware of the results of the D-dimer assays so that the results of the D-dimer assays could not influence (bias) the interpretation of ultrasonography (10).
Stay updated, free articles. Join our Telegram channel

Full access? Get Clinical Tree


