1
Introduction
Diabetic retinopathy (DR) was first described in the 19th century and has since been recognized as a key microvascular complication of diabetes mellitus. DR has significant impact at both the level of the individual patient and broader society. Among patients with diabetes mellitus, the prevalence of DR is around 30%–40%, while the prevalence of vision-threatening DR (VTDR), which includes severe nonproliferative DR (NPDR), proliferative DR (PDR), and diabetic macular edema (DME), is between 5% and 10% [ ]. It is estimated that more than 100 million individuals have DR worldwide, and this figure is expected to increase rapidly [ , , ]. DR remains a leading cause of visual impairment and blindness worldwide, particularly in the working age population [ , , ]. In terms of economic cost, annual direct healthcare costs related to DR in the USA alone were estimated at US$493 million in 2004 [ ]. Indirect costs and estimates from the global population with diabetes are likely to be much larger [ ].
Crucially, much of the visual impairment and blindness from DR is preventable, through effective screening and systemic and/or ocular treatment. Landmark clinical trials from the 1980 and 1990s, such as the Diabetes Control and Complications Trial (DCCT), the UK Prospective Diabetes Study (UKPDS), the Diabetic Retinopathy Study (DRS), and the Early Treatment of Diabetic Retinopathy Study (ETDRS), have established that systemic and ocular treatment can improve clinical outcomes in DR [ ]. Regular DR screening is universally recommended and has been effective in reducing the rates of visual impairment and blindness from DR around the world [ , , ].
The past 2 decades have seen further landmark developments in the field of DR. This chapter aims to review new insights gained in relation to various aspects of DR, from epidemiology and pathophysiology, to diagnosis, screening, systemic and ocular treatments, as well as to highlight promising areas of future research.
2
New insights in epidemiology
2.1
The global burden of diabetes
The global prevalence of diabetes mellitus has been steadily increasing over the years, from about 151 million in 2000, to approximately 463 million in 2019 [ ]. Correspondingly, the global prevalence of DR has also increased, with latest estimates suggesting that there are more than 100 million individuals with DR worldwide [ , , ].
While the percentage prevalence of diabetes is higher in high-to middle-income countries (9.5%–10.4% from latest estimates) than low-income countries (4.0% from latest estimates), in absolute numbers, the large majority (almost 80%) of diabetic individuals reside in low- to middle-income countries [ ]. Nevertheless, prevalence rates are expected to rise in all income groups [ ]. Similarly, while the reported percentage prevalence rate of diabetes is higher in urban (10.8%) compared to rural (7.2%) areas, the majority (67.0%) of diabetic individuals reside in rural areas. The sheer numbers of diabetic individuals residing in low-income countries, and particularly those in rural areas, present additional problems, including: (1) lack of access to timely diagnosis, screening and treatment, (2) lack of high-quality epidemiologic data, (3) poorer awareness and treatment of co-morbid medical conditions, and (4) lower health literacy and socioeconomic status, which contribute to lack of awareness of DR and consequently poorer outcomes [ , ]. These are on-going challenges that require special attention in the global fight against diabetes and DR.
2.2
Vision loss and DR
Interestingly, despite the overall increase in diabetes and DR, the rates of vision loss and blindness from diabetes/DR have shown steady decline over the past 4 decades. Observations from numerous longitudinal prospective epidemiologic studies in different countries have shown consistent reductions in the rates of DR progression and PDR at later time points [ , ]. A systematic review of prospective studies on DR also showed that 10-year incidence of progression to PDR and severe visual loss declined from 11.5% and 6.0% respectively from 1975–1985, to 6.6% and 2.6% respectively from 1985–2008 [ ]. Such improvements in retinopathy outcomes are probably multifactorial, due to earlier diagnosis of DR through screening programs, better treatment of systemic risk factors such as glycemic control and hypertension, and the widespread use of effective ocular treatments, such as laser photocoagulation and intravitreal pharmacotherapies [ ].
In addition, while PDR was traditionally considered the “major” cause of visual loss from diabetes, over the past few years, DME has instead been increasingly recognized as the most common cause of visual impairment or loss in DR [ ]. A pooled analysis of 35 studies (from the 1980s to the early 2000s) estimated that prevalence rates of PDR and DME were roughly similar [ ]. A more recent prevalence study from the USA, reporting on data from the mid-2000s, showed that DME was almost twice as common as PDR [ ]. Another study from the USA in a similar time period reported that the 4-year incidence of DME was more than twice that of PDR [ ]. Prevalence estimates of DME in recent population-based studies show significant variability, likely due to methodologic differences, but may be as high as 7.9% in type 1 diabetes and 12.8% in type 2 diabetes [ ]. Diabetic macular ischemia (DMI) is also an important, irreversible cause of visual loss in DR [ ]. However, diagnosis and assessment of DMI requires angiography, and large-scale epidemiologic data on the prevalence and incidence of DMI is currently lacking.
3
New insights in pathophysiology
3.1
Mediators of vasculopathy
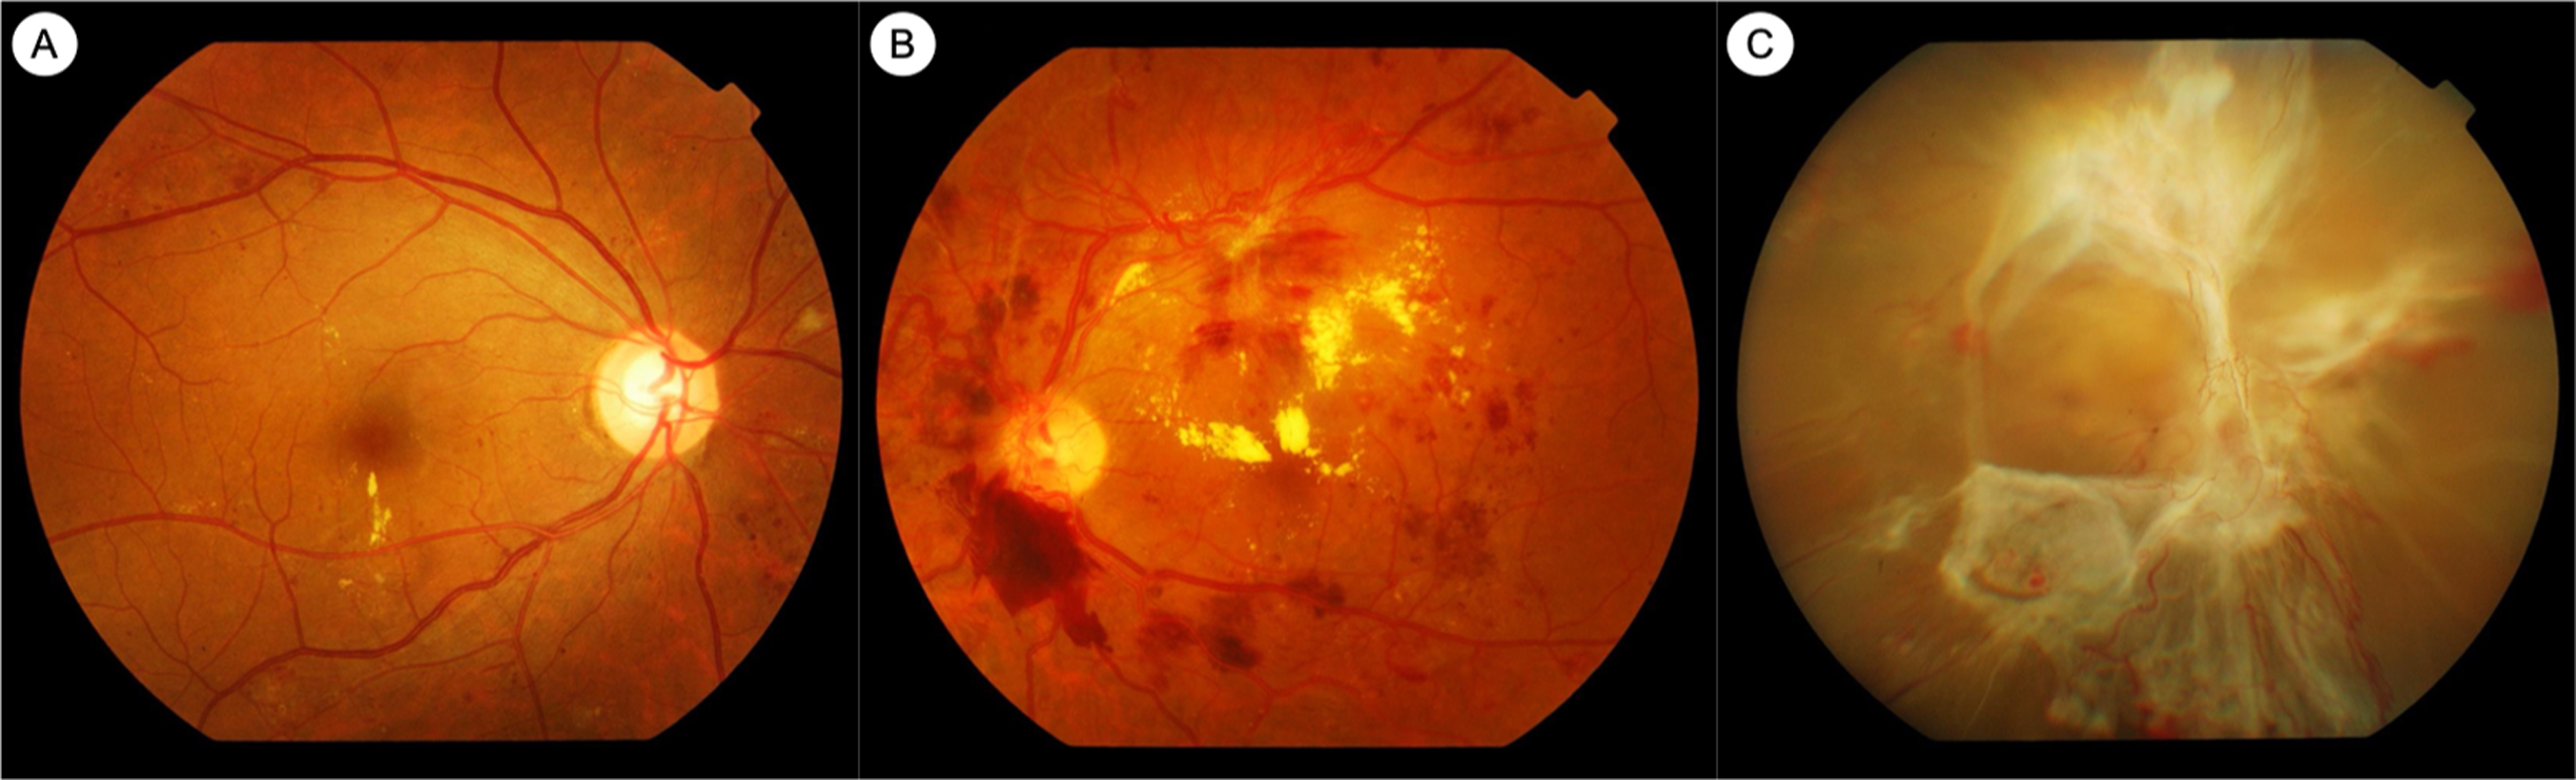
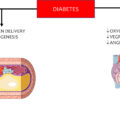
Extensive research has helped to clarify some of the mediators responsible for the retinal vasculopathy seen in diabetes. Hyperglycemia results in retinal vasculopathy via numerous metabolic mechanisms, such as the accumulation of advanced glycation end products (AGEs), upregulation of the polyol pathway and the protein kinase C (PKC) pathway, and increased oxidative stress [ ]. These pathways result in vascular changes such as pericyte loss, increased vascular permeability, breakdown of the inner blood–retinal barrier, and capillary occlusion resulting in retinal ischemia [ ]. These vascular sequelae of hyperglycemia account for the clinically visible fundus lesions, such as microaneurysms, hemorrhages, neovascularization, and retinal thickening and hard exudates, as seen in DME ( Fig. 6.1 ).
Vascular endothelial growth factor (VEGF) is a key mediator involved in these pathophysiologic pathways, which has been clearly implicated in the development of both PDR and DME [ ]. VEGF was first linked to ocular neovascularization in the 1990s when it was demonstrated that retinal ischemia resulted in elevated VEGF levels and rubeosis iridis [ , ]. VEGF is an angiogenic factor that promotes proliferation of retinal endothelial cells and retinal neovascularization [ ]. VEGF concentrations are elevated in the vitreous humor of eyes with PDR, and are reduced after treatment with panretinal photocoagulation (PRP) [ , ]. VEGF also results in increased vascular permeability via upregulation of PKC, which, in turn, has deleterious effects on occludins in retinal endothelial cell tight junctions [ ]. VEGF concentrations are also elevated in eyes with DME [ ]. This large body of in vitro and in vivo evidence from the 1990s and 2000s, implicating VEGF in the pathogenesis of DME and PDR, eventually led to the seminal clinical trials that established the efficacy of anti-VEGF treatment in these conditions [ ].
Other angiogenic factors and vascular mediators are also being investigated for their role in DR and DME. In particular, the angiopoietins, such as angiopoietin-1 (Ang-1) and angiopoietin-2 (Ang-2), which interact with transmembrane receptor tyrosine kinase (Tie-2), have also been implicated in vascular hyperpermeability, and these are under investigation as potential therapeutic targets for DME [ , , ]. Faricimab, a bispecific monoclonal antibody that targets both VEGF and Ang-2, has been evaluated in clinical trials for treatment of DME, with results suggesting better durability of disease control than other anti-VEGF agents [ , ]. There are numerous other vascular mediator pathways being explored, such as plasma kallikrein and integrins [ ].
3.2
Inflammation and DR
Inflammation has also been implicated as a key factor in the pathogenesis of DR and DME. Retinal microglia and Muller cells are persistently activated in diabetes, which results in the release of numerous proinflammatory cytokines [ , , , ]. Levels of these cytokines, such as interleukin-6 (IL-6), IL-1b, IL-8, tumor necrosis factor-a (TNF-a), and monocyte chemoattractant protein-1 (MCP-1) are increased in the vitreous humor and ocular fluids of diabetics, and levels also correlate with the severity of DR [ , , ]. Exaggerated leukostasis is also well-documented in DR [ , ]. Intercellular adhesion molecule-1 (ICAM-1) and vascular cell adhesion molecule-1 (VCAM-1) are key mediators promoting increased leukocyte-endothelium adhesion [ , ]. Leukostasis contributes to greater vascular permeability, breakdown of the inner-blood-retinal barrier, and capillary occlusion in DR. Treatment of DME with intravitreal corticosteroid injections relies on modulating pathways that drive inflammation for therapeutic effect. Data from some clinical trials using intravitreal corticosteroids for treatment of DME have also suggested that such treatment slows progression of DR and PDR, which lends further credence to the pathophysiologic role of inflammation in DR [ ].
3.3
Neural dysfunction and degeneration in the diabetic retina
Characteristic fundus lesions of DR, such as microaneurysms, hemorrhages, venous beading, intraretinal microvascular abnormalities (IRMAs) and new vessels (NVs), are typically considered manifestations of vascular disease. DR is traditionally thought of as primarily a vasculopathy and indeed is classically described as a microvascularcomplication of diabetes. However, the development of more advanced imaging modalities and functional assessments has produced a growing body of structural and functional evidence pointing to significant retinal neural abnormalities in diabetes as well. This has led to the recent introduction of the term diabetic retinal neurodegeneration (DRN) [ ].
Functional retinal abnormalities that have been demonstrated in the diabetic retina include abnormal implicit times on multifocal electroretinogram (ERG), reduced pattern ERG amplitudes, delays in oscillatory potential (OP) implicit times, perimetric defects, and reductions in contrast sensitivity [ ]. In terms of retinal structure, in vivo imaging studies have shown thinning of retinal layers in diabetes, particularly in the inner retina, such as the retinal nerve fiber layer (RNFL) and ganglion cell layer (GCL) [ , ]. Histological studies have revealed reductions in the density of retinal ganglion cells in DR [ ]. A recent meta-analysis concluded that peri-papillary RNFL thickness was significantly reduced in patients with diabetes but without overt DR, compared to persons without diabetes [ ]. Studies on mice models have also shown retinal and GCL thinning in diabetic mice, in the absence of pericyte loss or other capillary abnormalities [ ]. Because such studies have demonstrated significant retinal thinning in eyes without vascular abnormalities, it has been suggested that DRN may precede, or even be a causal factor in, the development of vascular changes or “traditional” DR [ , ]. The exact relationship between DRN and vascular damage has yet to be defined, but this is an area of active research. Furthermore, the prognostic significance of these retinal neural abnormalities deserves further evaluation. Nevertheless, some researchers have suggested that the retinal complications in diabetes may be better termed “diabetic retinal disease (DRD),” as opposed to just “diabetic retinopathy,” so as to better account for the existence and role of DRN in its pathophysiology [ , ].
4
New insights in diagnosis and imaging
4.1
Traditional imaging and diagnostic modalities
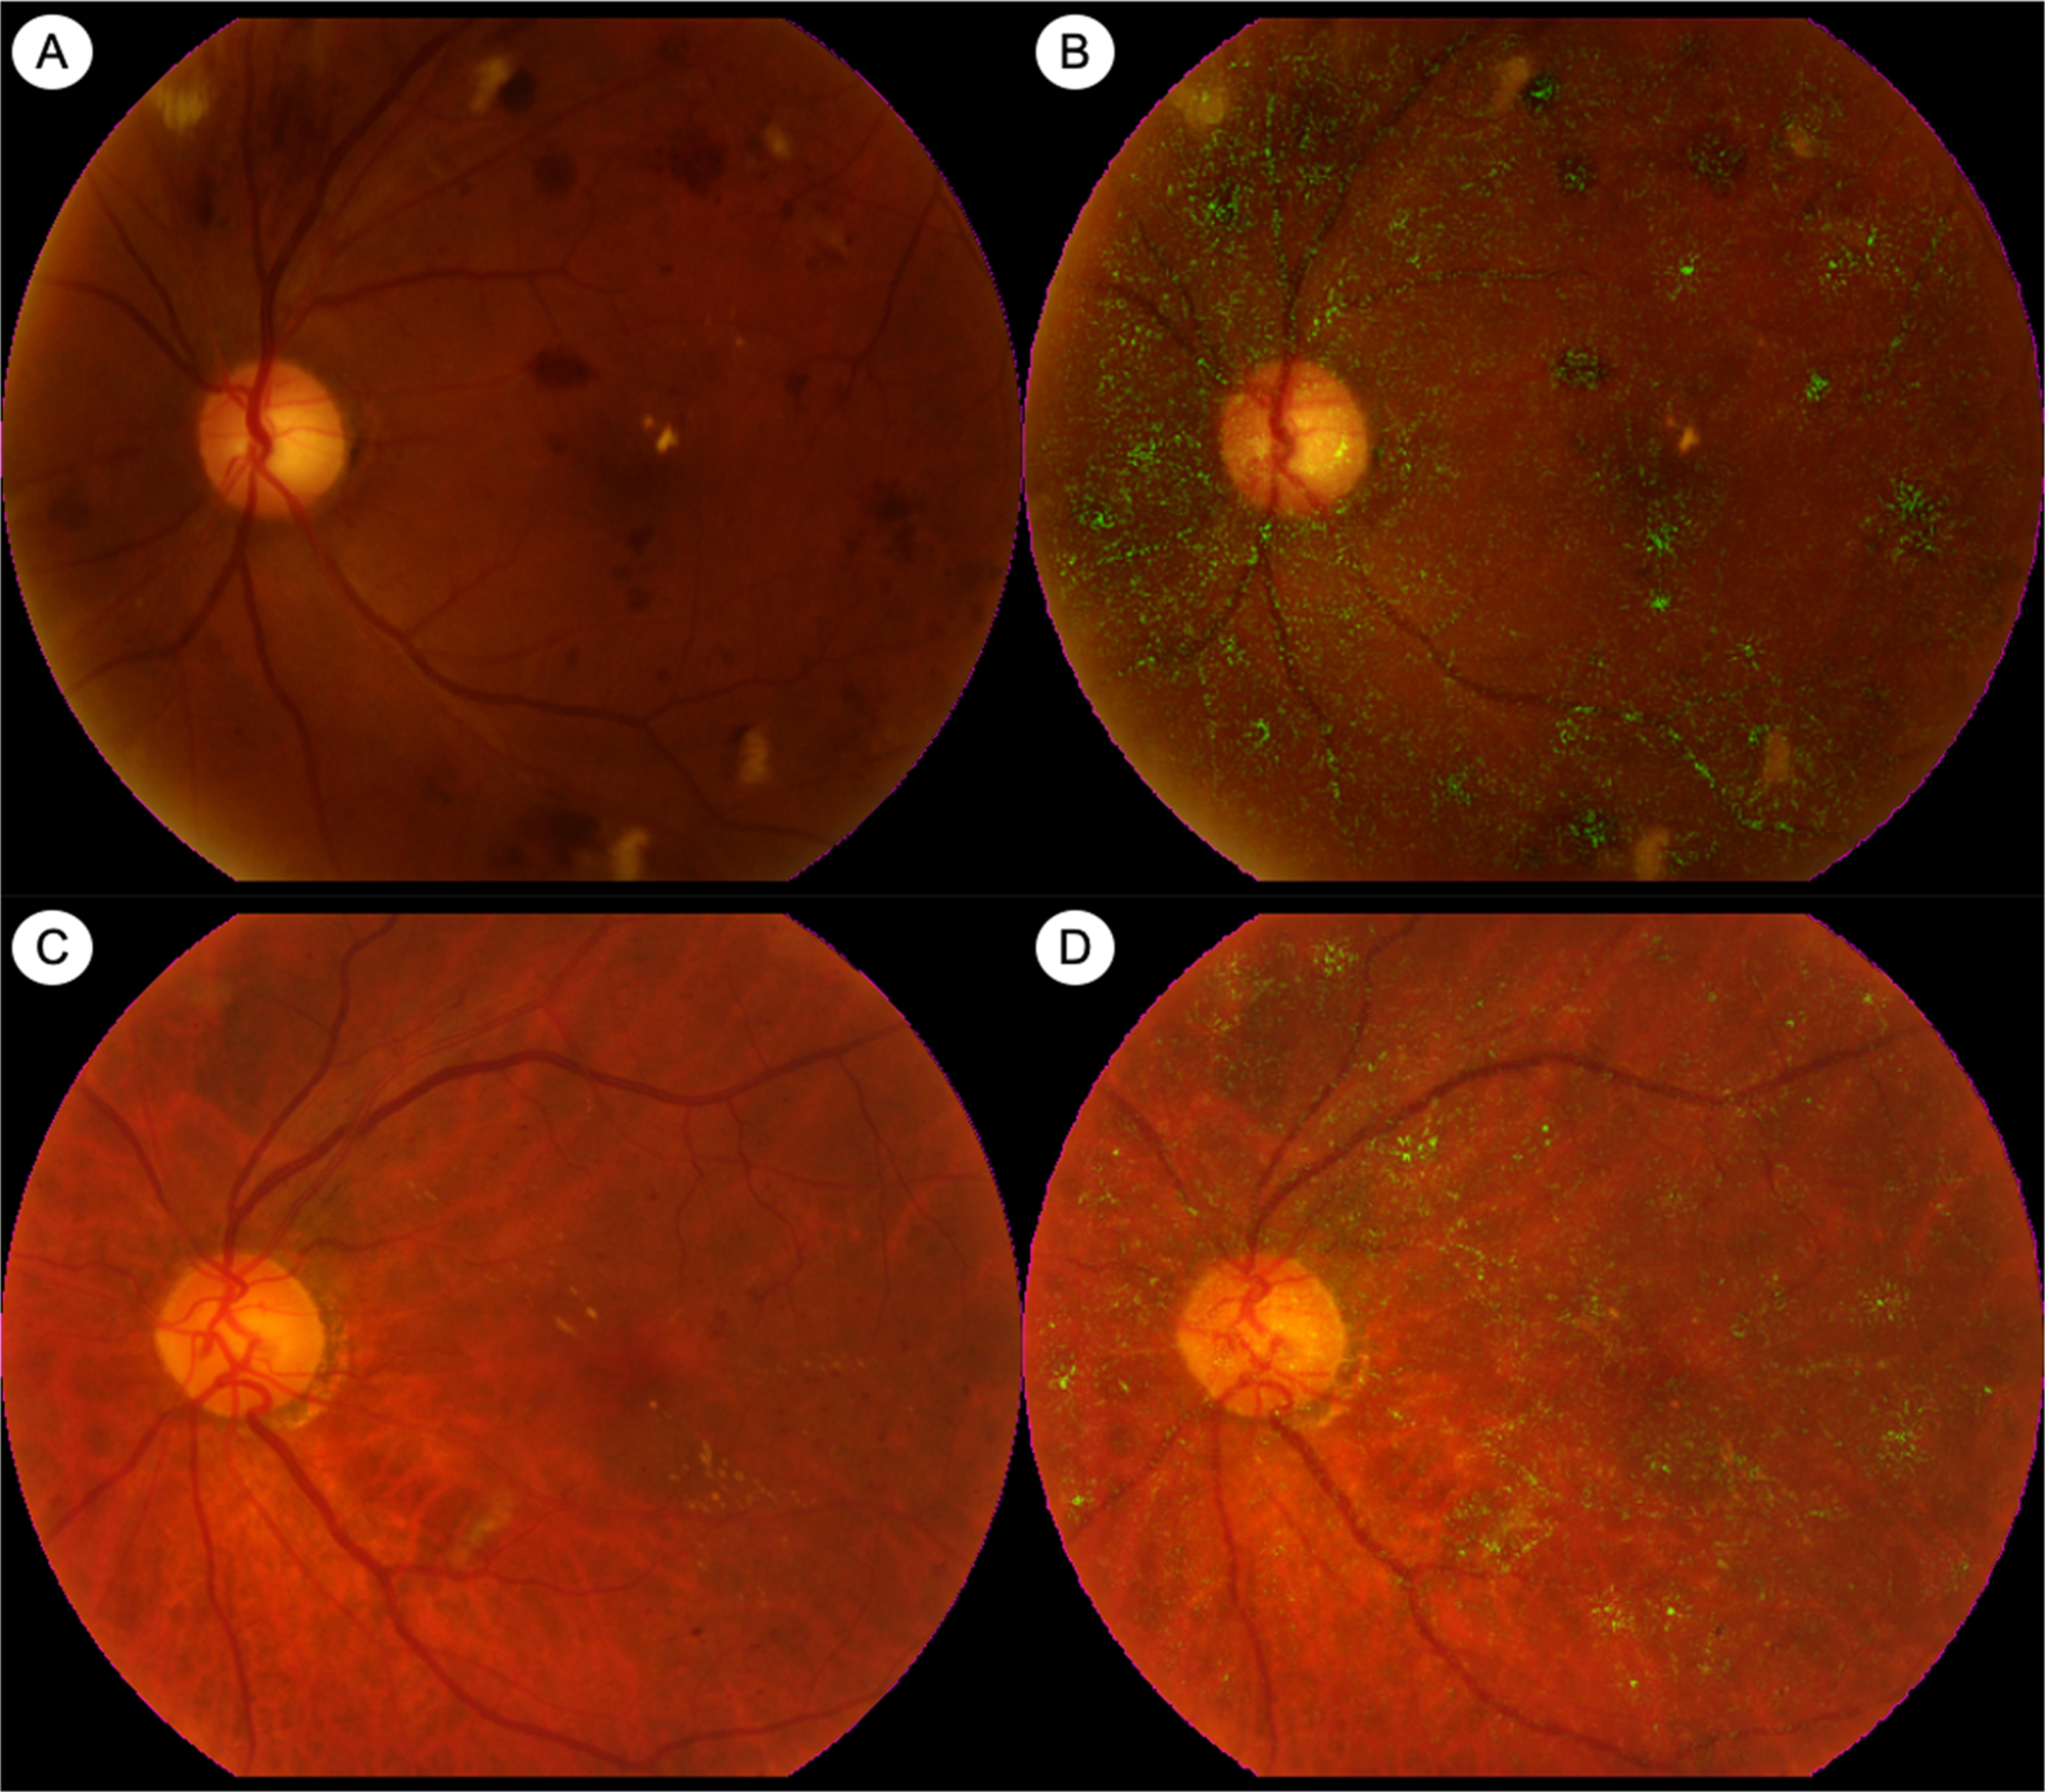
In clinical practice, DR is frequently diagnosed and assessed by ophthalmoscopic examination or by color fundus photography (CFP) ( Figs. 6.1 and 6.2 ). Standardized CFP has been the “gold standard” imaging modality used for diagnosis and grading of DR in clinical screening programs and research for decades. In the seminal ETDRS study from the 1980s, CFPs were obtained with film-based fundus cameras, with pharmacologic mydriasis, over 7 standardized 30° fields in stereoscopic pairs [ , ]. Since then, subsequent studies have validated the use of nonmydriatic, nonstereoscopic photographs with fewer, larger fields of view (e.g., two 45° fields), obtained with digital fundus cameras [ ]. Grading of DR severity on such photographs is reproducible, with acceptable intra- and interobserver agreement [ , ]. CFP imaging is in regular clinical use for large-scale screening programs around the world [ , , ]. Fundus photographs can now be taken with smartphone cameras or other portable devices, although standardization and quality control are issues that need to be considered for widespread adoption.
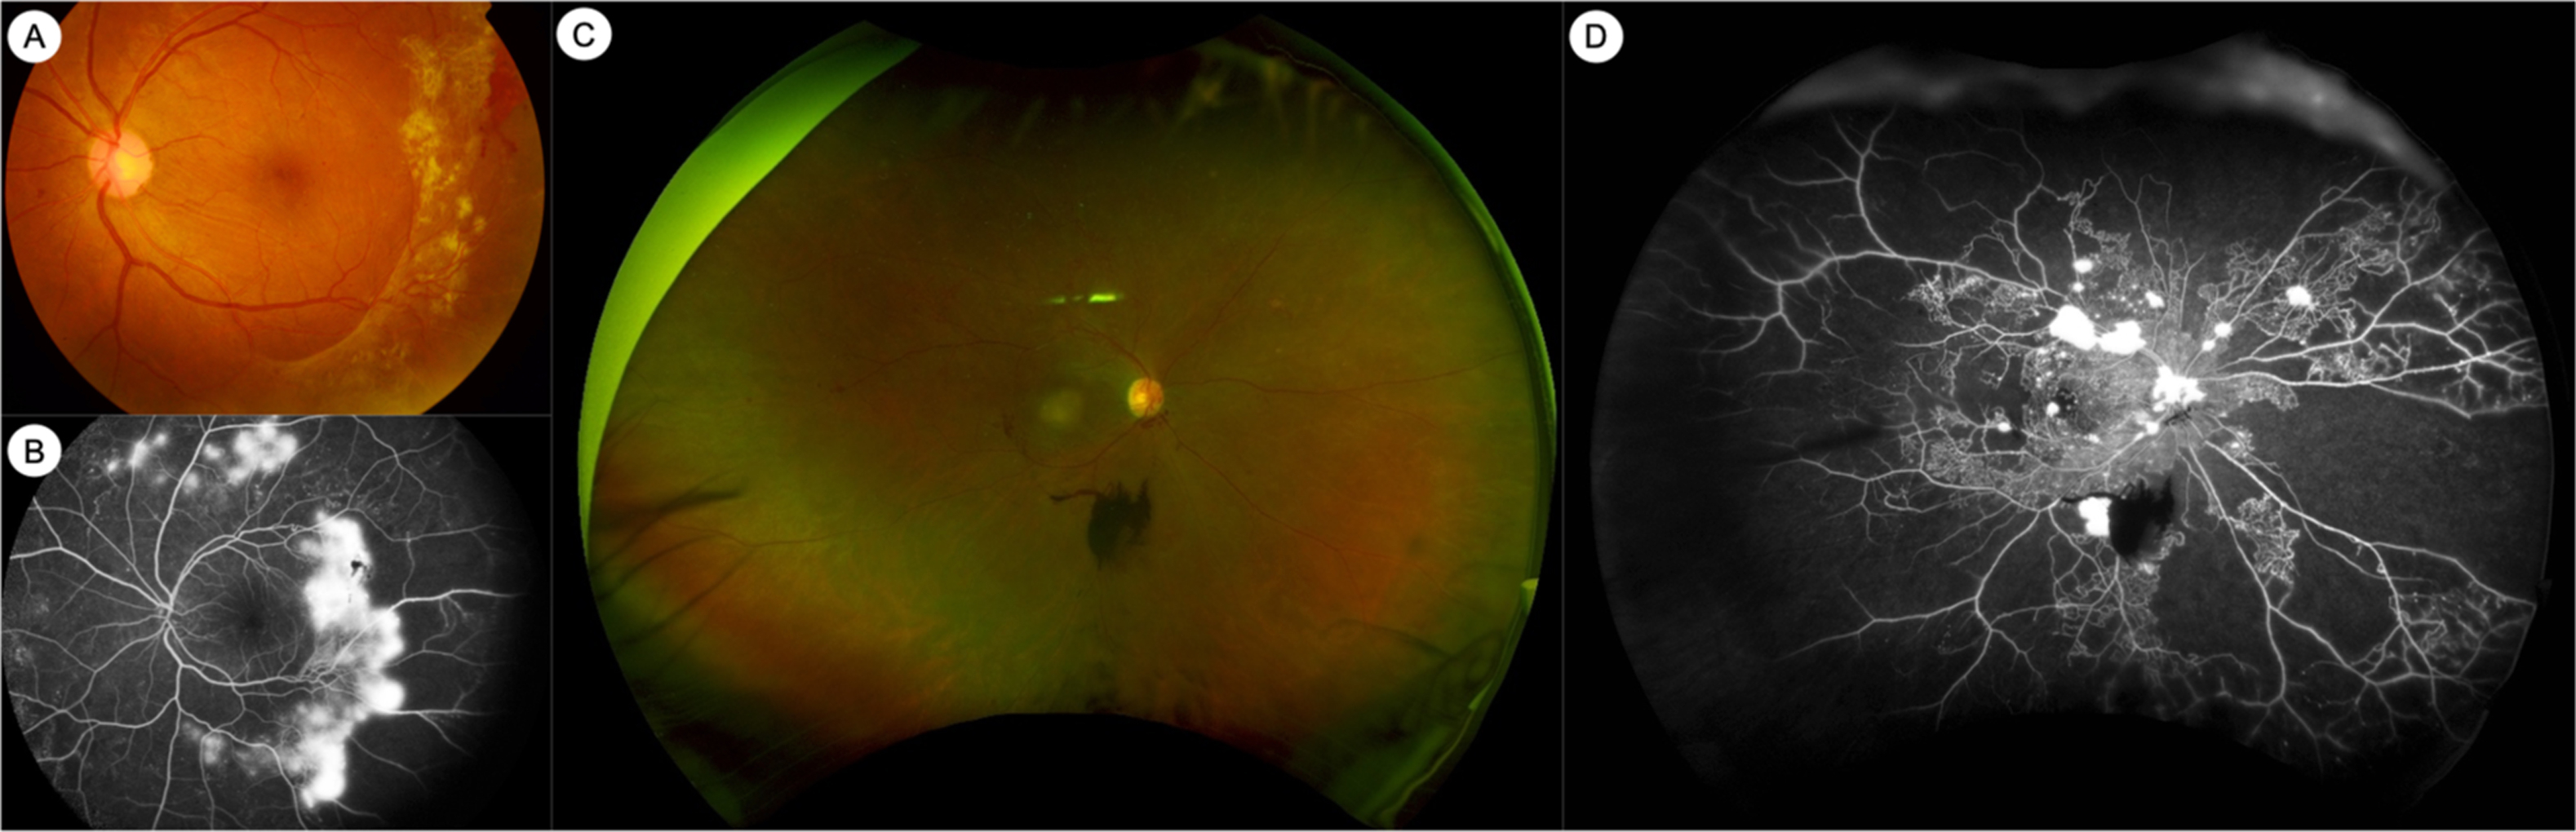
Fluorescein angiography (FA) is an intravenous dye-based angiography technique that allows for greater visualization of the retinal vasculature. FA has been used for clinical assessment of DR since the 1960s ( Fig. 6.2 ) [ ]. The ETDRS study showed that vascular abnormalities assessed by FA, such as arteriolar narrowing or staining, capillary loss or dilatation, and fluorescein leakage, were related to the risk of progression to PDR [ ]. However, in part due to the need for invasive dye administration, FA is not routinely performed in all patients with DR. In clinical practice, FA may be performed in DR to assess for the areas and extent of capillary nonperfusion, to diagnose DMI, or to differentiate IRMAs from NVs.
4.2
Optical coherence tomography
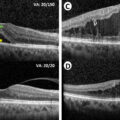
In the past 3 decades, newer imaging modalities have provided additional ways to assess eyes with DR, which have dramatically changed the clinical and research landscape in DR. The advent of optical coherence tomography (OCT) has been particularly impactful. OCT is a noninvasive technique, analogous to an “optical ultrasound,” that uses low coherence interferometry with infrared light to produce high-resolution cross-sectional images of the retina ( Fig. 6.3 ) [ ]. Modern spectral-domain OCT (SD-OCT) can achieve an axial resolution of 5–10 microns or less. Commercial OCT devices were available from the 1990s but became standard of care in management of retinal conditions such as DME and age-related macular degeneration in the mid-2000s [ ]. SD-OCT is now the standard of care for diagnosis, monitoring, and treatment of DME. DME treatment decisions and algorithms with intravitreal anti-VEGF therapy are guided largely by changes in retinal thickness measurements on OCT (alongside visual acuity), and patients on treatment for DME typically have OCT scans at every visit, as frequently as once every 4 weeks [ ].
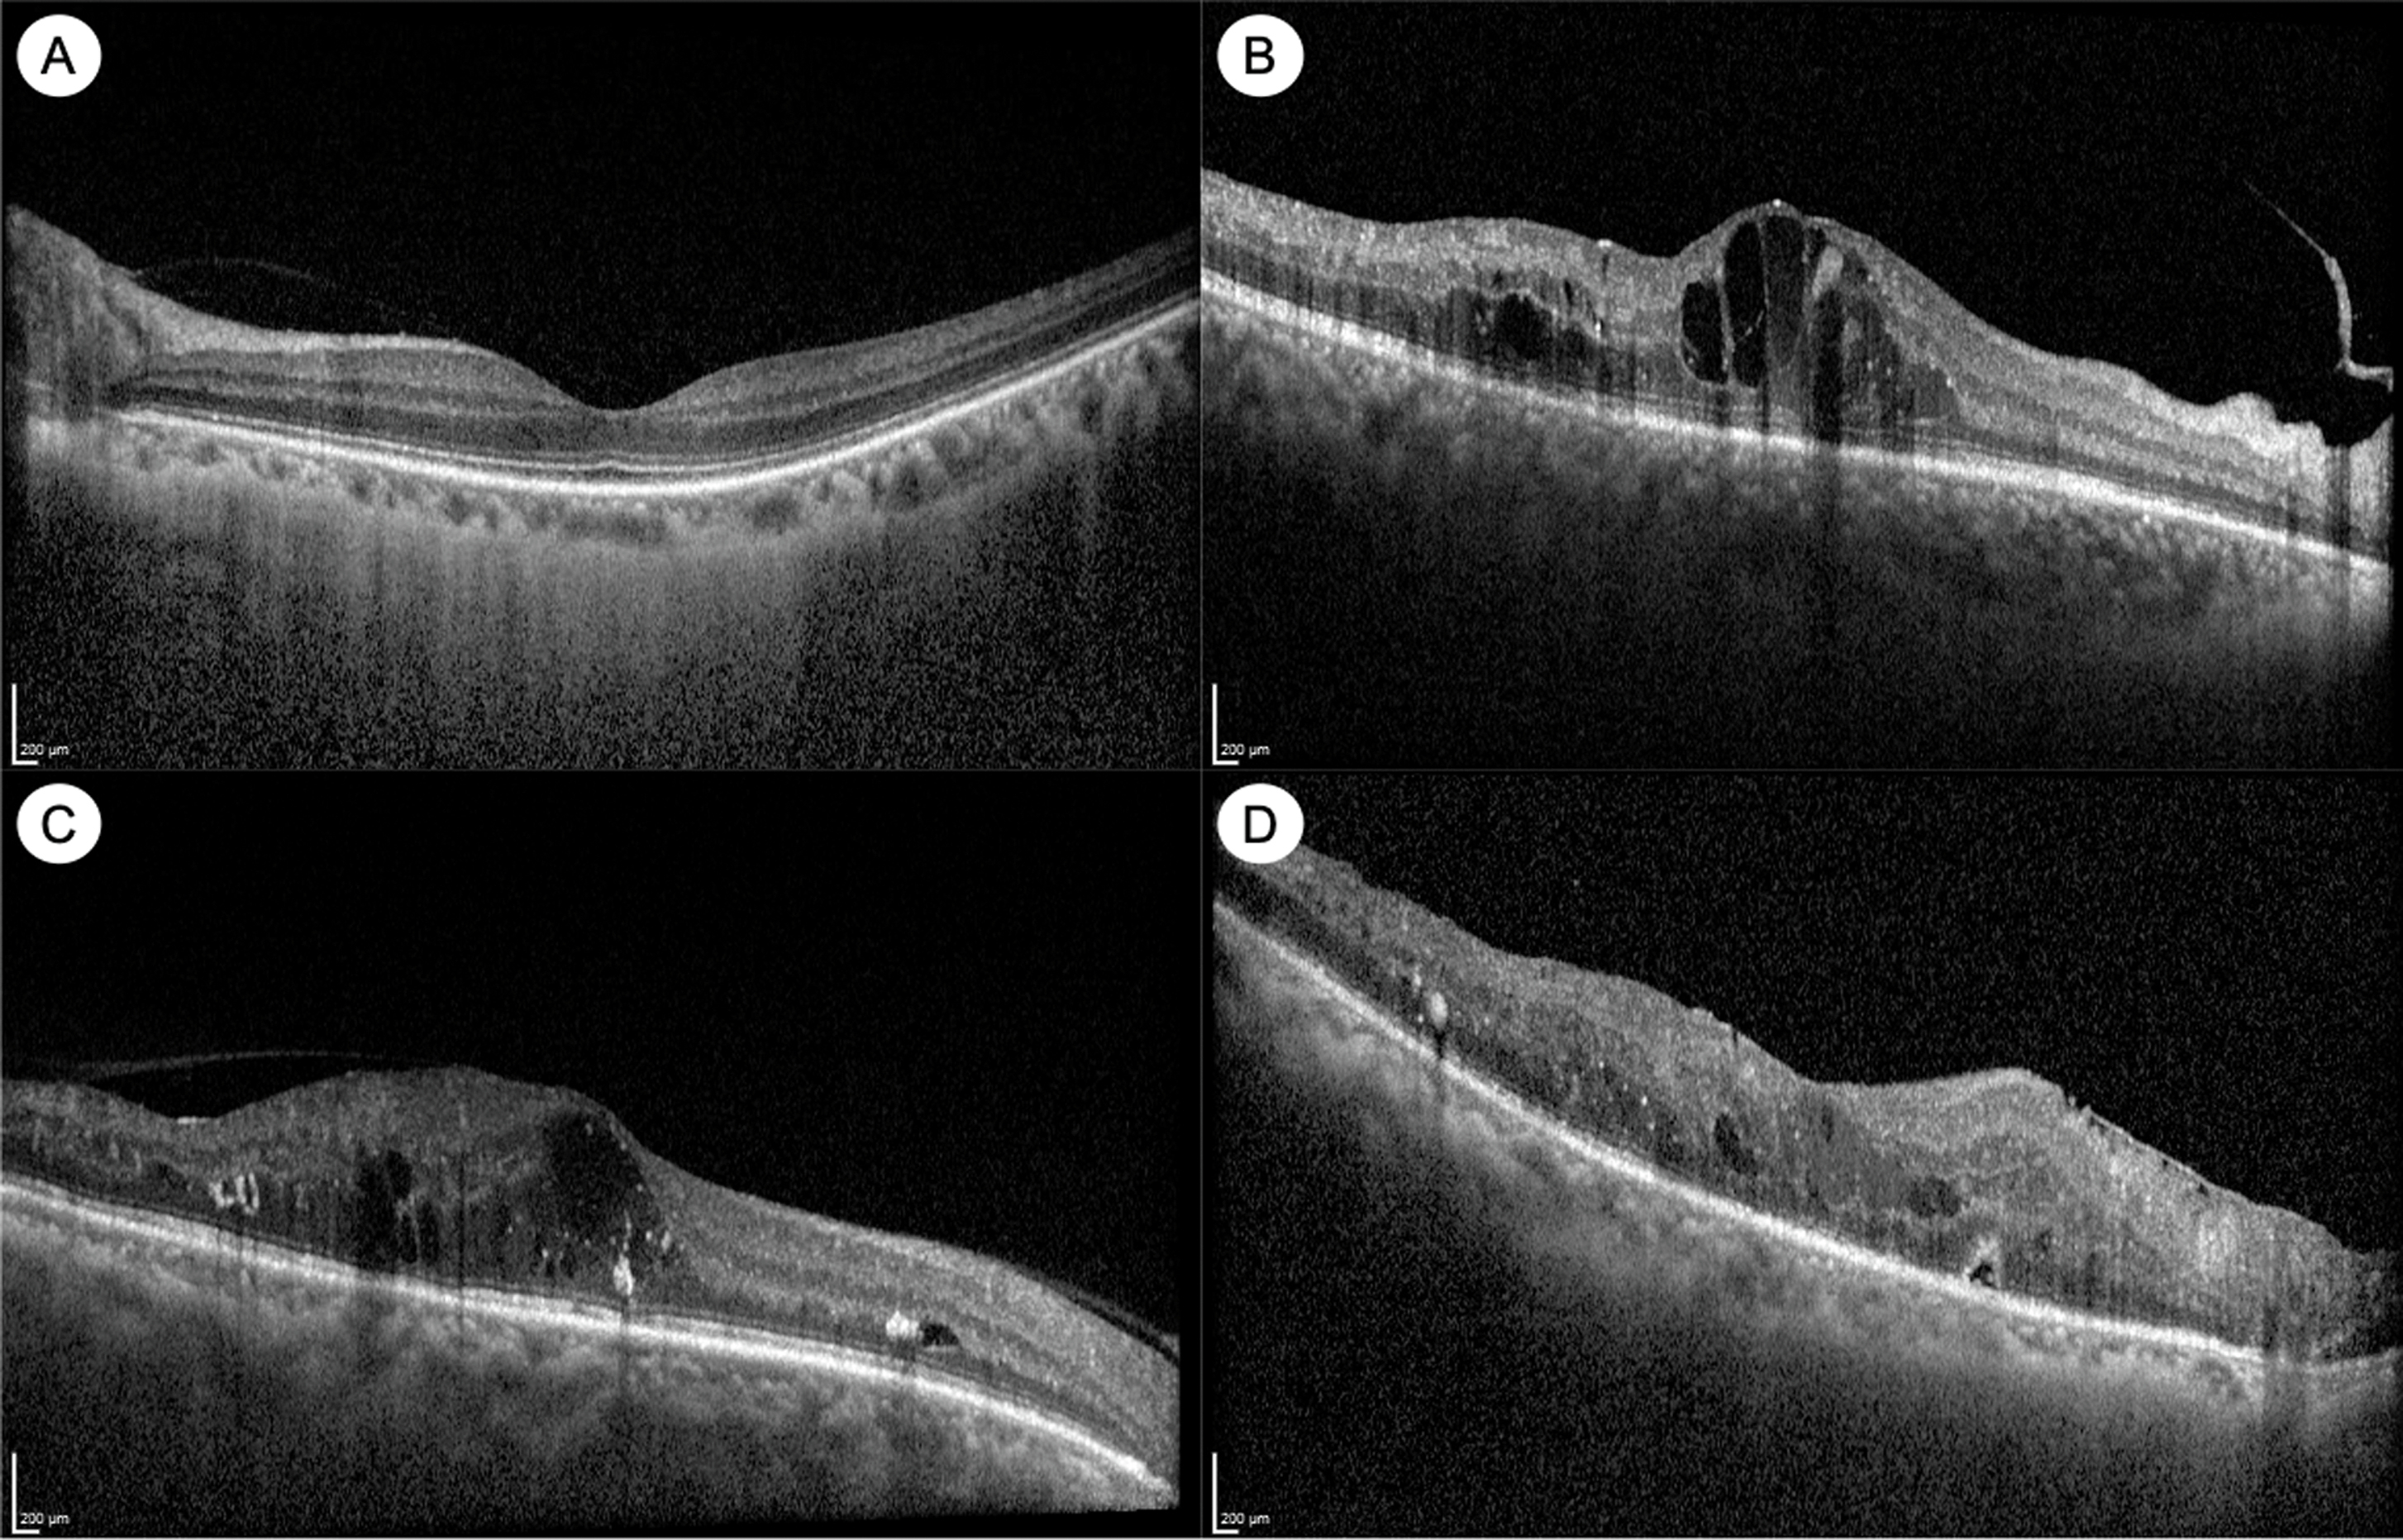
OCT imaging has advanced our understanding of DME ( Fig. 6.3 ). DME manifests on OCT as retinal thickening, which is often quantified by measurement of the central subfield thickness (CST). Other signs of DME on OCT include intraretinal fluid (IRF) or cysts, hard exudates, which appear hyper-reflective, and in some cases, subretinal fluid (SRF) as well [ ]. Various biomarkers in DME have been identified on OCT, which may help in prognostication or treatment decisions. For example, the integrity of the outer retinal layers, such as the external limiting membrane (ELM), the ellipsoid zone (EZ) or the photoreceptor inner segment/outer segment (IS/OS) junction, is an important biomarker of visual acuity and prognosis after treatment [ ]. In normal eyes, these appear as distinct hyper-reflective bands, and disruption or loss of these bands (which tend to occur in chronic DME) are poor prognostic signs ( Fig. 6.3 ). Photoreceptor outer segment thickness has also been correlated with visual acuity in DME [ ]. In the inner retina, another important biomarker of visual prognosis is disorganization of the retinal inner layers (DRIL) [ , ]. DRIL is seen on OCT as loss of boundaries between the ganglion cell-inner plexiform layer complex, inner nuclear layer, and outer plexiform layer. DRIL correlates with visual acuity in DME, and change in its extent over time can be predictive of future visual improvement or decline [ , ]. Other OCT biomarkers such as the presence of small hyperreflective foci (HRF) and SRF have been suggested as signs of retinal inflammation [ , , ]. HRF are thought to represent activated microglial cells in the retina and have been shown to be associated with increased inflammatory cytokines [ ]. Some studies have suggested that eyes with more HRF and SRF on OCT may respond better to intravitreal corticosteroid treatment [ , , ]. Our understanding of OCT biomarkers in DME and DR is evolving, and larger, well-designed prospective studies are needed to elucidate their prognostic significance.
4.3
OCT angiography
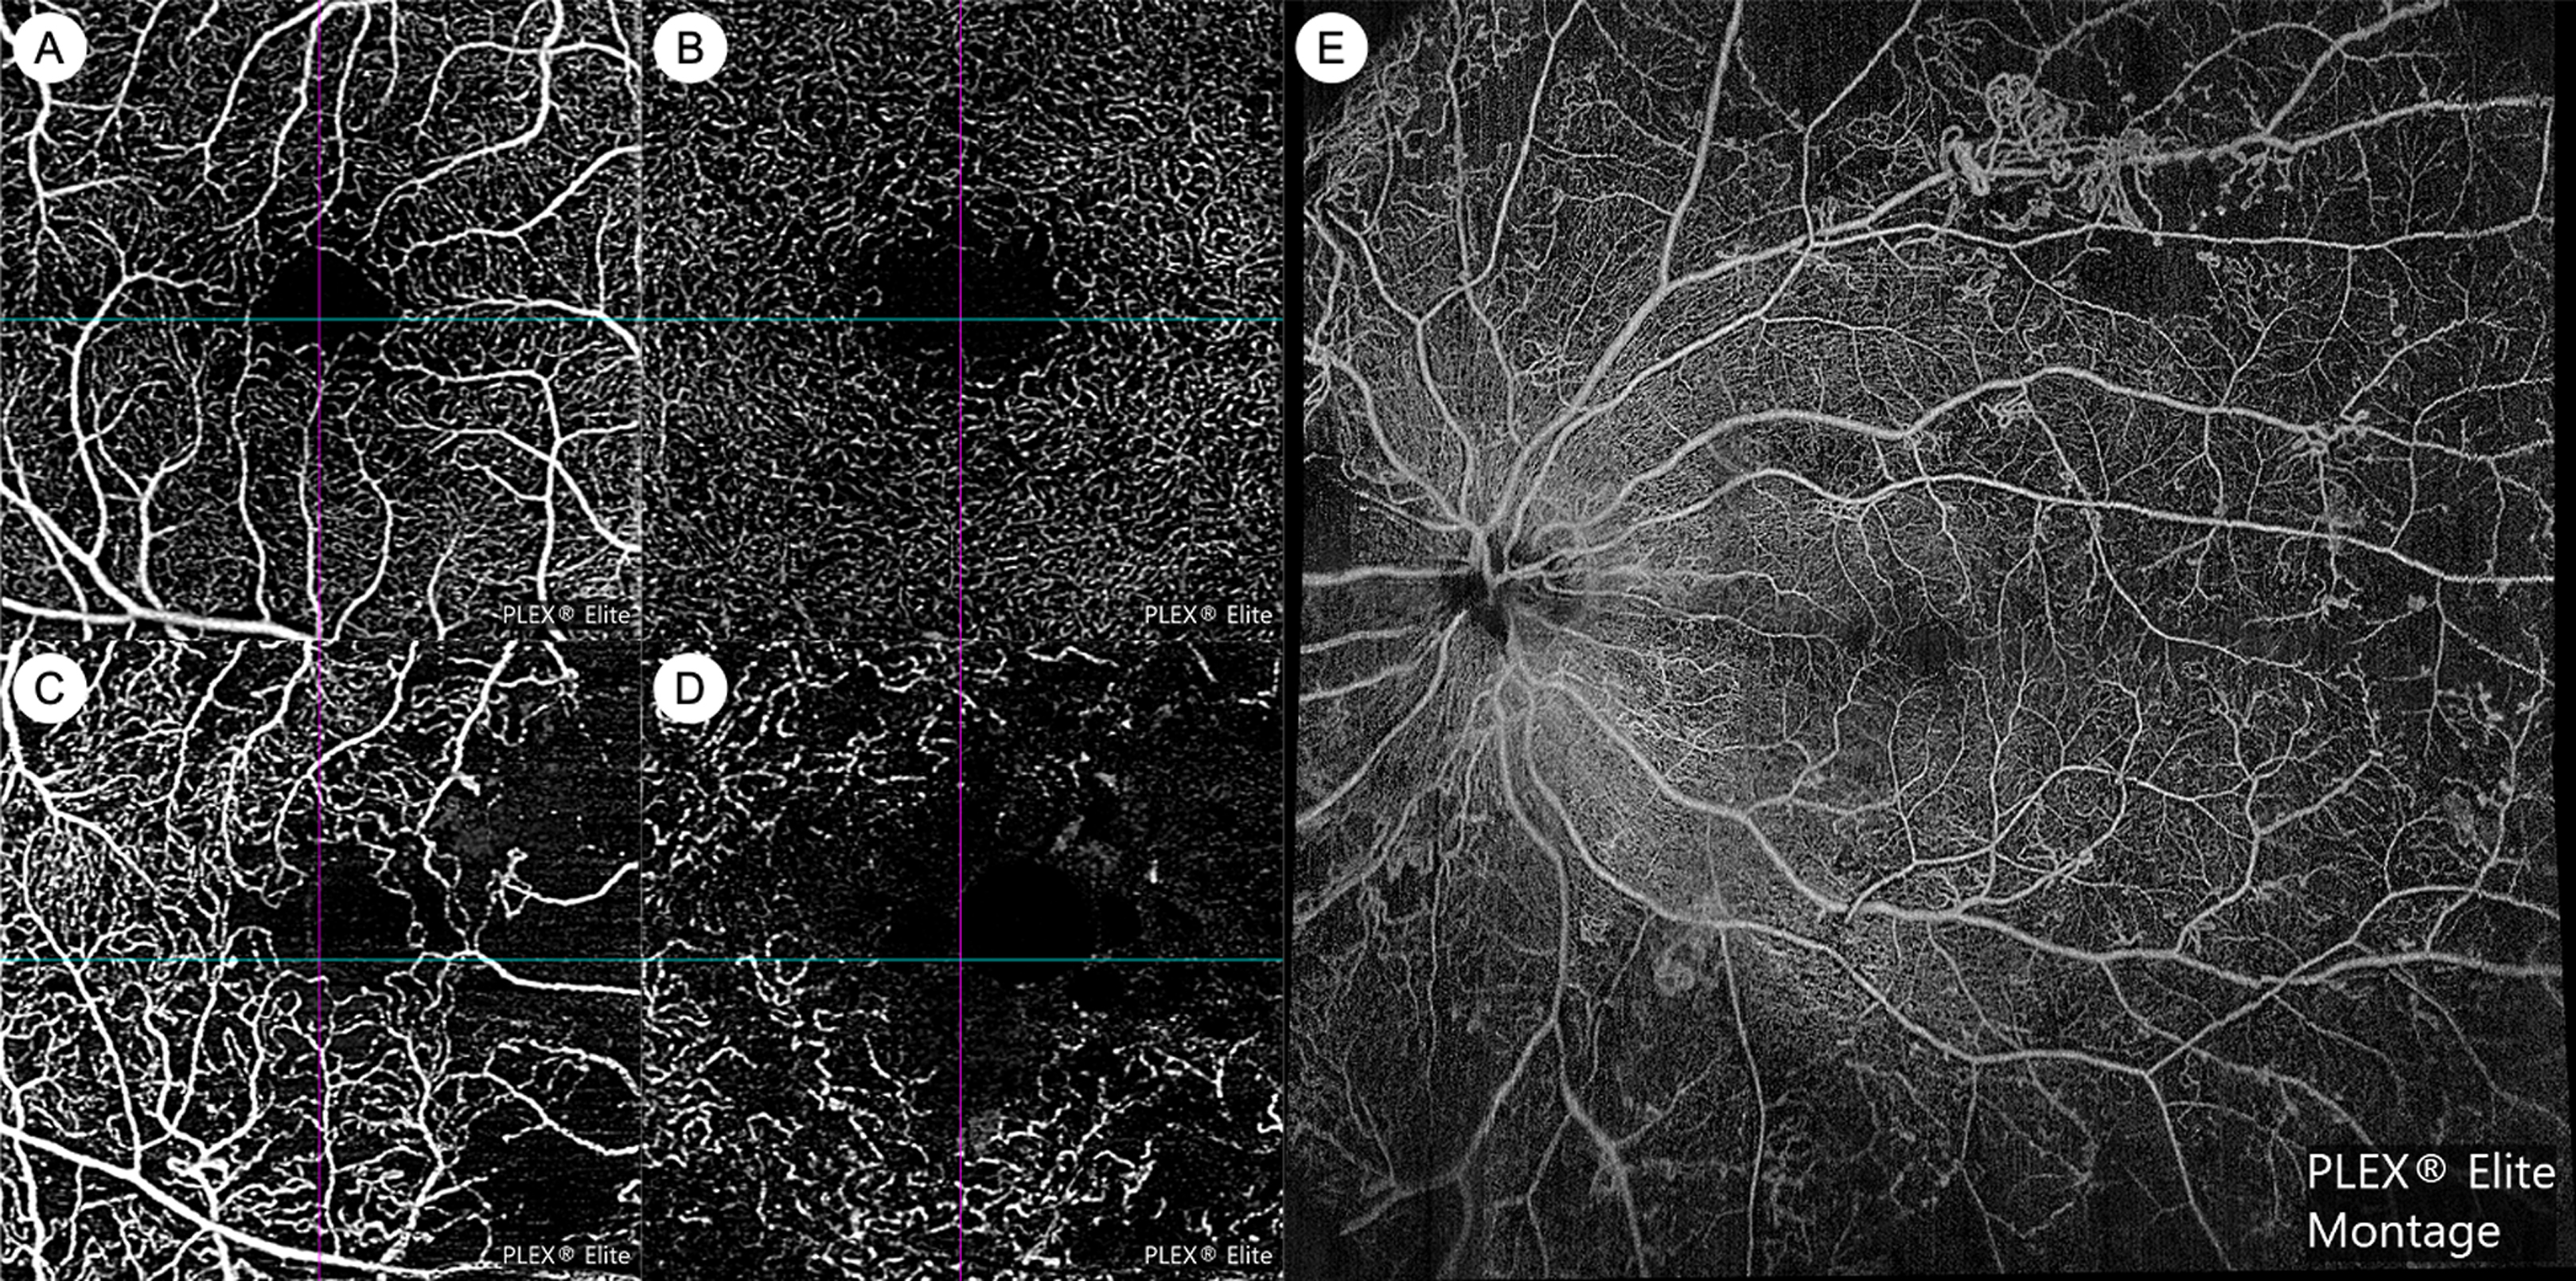
OCT angiography (OCTA) technology is now able to provide noninvasive angiographic information in DR. OCTA has numerous advantages over FA: it does not require invasive dye, is faster to acquire, provides visualization of the capillary microvasculature, and allows for depth-resolved segmentation of vascular plexuses in various retinal layers ( Fig. 6.4 ) [ ]. However, current OCTA technology does not provide information on vascular leakage or precise flow velocity, and fields of view may be limited. OCTA software algorithms can automatically provide quantitative metrics on vessel density, geometry, and the foveal avascular zone (FAZ). Various OCTA metrics have been cross-sectionally associated with greater DR severity, including lower vessel density, greater tortuosity, lower fractal dimension, larger FAZ area, and lower FAZ circularity [ ]. A few longitudinal studies have demonstrated that OCTA metrics such as larger FAZ area and lower vessel density may be predictive of DR progression [ ]. However, normative databases that have assessed variation in these metrics by key characteristics such as age, sex, and ethnicity are currently lacking. In addition, to date, there is insufficient data on how co-morbid vascular conditions such as hypertension and atherosclerosis, that affect a high proportion of older populations, can also influence these OCTA metrics. Widespread clinical use of OCTA in DR is also currently still hampered by incompatibility across different commercial platforms and the lack of high-quality longitudinal data. However, there are many ongoing prospective studies, along with international efforts to standardize nomenclature and cross-validate OCTA measurements [ ]. It is likely that OCTA will become an increasingly important modality for DR management in the near future.
4.4
Widefield retinal imaging
The development of widefield retinal imaging systems has also had significant impact, and has in large part been responsible for a renewed interest in the role of the retinal periphery in DR. Widefield imaging systems generally provide at least 110° field of view and include the retinal midperiphery, including at least the posterior edge of the vortex vein ampullae [ ]. Commercial widefield imaging systems are in routine clinical use and are capable of color or pseudocolor photography (WFCP), as well as FA (WFFA) ( Fig. 6.2 ). Inclusion of the retinal periphery may have implications for our assessment of DR. First, the inclusion of the retinal periphery in the grading area can result in a more severe level of DR severity in up to 10.0%–19.0% of eyes [ ]. The implication of this more “severe” level of DR based on peripheral lesions is still unclear. Second, two studies from the same longitudinal cohort have suggested that eyes with more peripheral lesions have a greater risk of progression to PDR [ , ]. Third, it has been suggested that peripheral DR lesions may have a different pathophysiologic basis compared to posterior lesions, although this is currently still controversial [ ]. WFFA studies have also demonstrated that greater degrees of nonperfusion are cross-sectionally associated greater DR severity [ ]. More longitudinal studies investigating the prognostic significance of WFCP and WFFA images are ongoing.
5
New insights in staging and classification
Current clinical management of DR relies heavily on establishing the severity of DR, in order to stratify risk, and to decide on appropriate observation intervals or the need for intervention such as PRP or anti-VEGF therapy. The current DR classification systems in routine use are the ETDRS severity scale and the International Clinical Diabetic Retinopathy (ICDR) severity scale, which rely on grading the presence and severity of various retinal lesions, such as microaneurysms, hemorrhages, venous beading, IRMAs, and NVs [ , , ] The ETDRS severity scale was originally validated on untreated natural history data from the ETDRS study, demonstrating that the severity grading at baseline was able to reliably predict risk of progression to PDR at 1-, 3-, and 5-year time points [ ]. This classification system has been enormously influential and has formed the backbone of clinical practice and research into DR for the past 3 decades.
However, there is increasing recognition of the need to update these classification systems, which have some important limitations [ , , ]. First, these classifications are only validated for grading DR severity within the retinal area covered by the 7 standardized ETDRS fields, which only accounts for about 30% of retinal surface area. Lesions in the retinal periphery are likely to have important prognostic value, and these can now be reliably imaged with widefield imaging systems [ ]. Second, intravitreal anti-VEGF treatment often induces regression of visible fundus lesions and DR severity, but the extent of underlying retinal nonperfusion remains unchanged [ , ]. Therefore, eyes with “induced” levels of DR severity may behave differently from what our severity scales would otherwise predict. Our classification systems have only been validated in untreated eyes and may not be applicable to anti-VEGF-treated eyes. Third, these classifications are based only on clinical appearance and color photography and do not incorporate the wealth of potentially prognostic information available from new imaging modalities, such as OCT and OCTA. Fourth, our classification systems focus only on the vascular aspect of DR and do not include assessment of the neural retina, which is increasingly recognized as important. Fifth, our current classification systems do not adequately reflect the importance of DME, which has now become the most important cause of visual impairment in DR (as opposed to PDR). Ideally, the classification system of DR should include stratification for DME based on current treatment algorithms and should also prognosticate the risk of development of incident DME, rather than just PDR. There are ongoing efforts to update the classification and staging system for DR to address these limitations, but more high-quality longitudinal and multimodal data are needed for validation [ ].
6
New insights in screening
6.1
Current standard of care for DR screening
The benefits of regular screening for DR in patients with diabetes are well-documented. Regular screening is not only effective in preventing most cases of blindness from DR but is also cost-effective [ , , , ]. International management guidelines universally recommend regular DR screening [ , ]. Guidelines recommend that standard of care include a visual acuity examination and a retinal examination for DR and DME, which can be accomplished by face-to-face ophthalmoscopic examination or telemedicine with CFP [ ]. Telemedicine approaches can be synchronous or asynchronous [ ]. Telemedicine for DR screening was initially deployed to improve access in rural communities, but is now recognized for its benefits even in urban, high-resources settings. Telemedicine strategies have been shown to improve attendance rates and to have better acceptance and patient satisfaction over traditional face-to-face consultations [ , , , ]. Exact screening protocols vary around the world and are heavily influenced by resource settings and local healthcare systems. There are some nationwide DR screening programs in place, such as in the United Kingdom, Singapore, and Iceland. In other countries, there are large-scale regional DR screening programs, such as in Australia and the USA [ ]. The number of photographic fields taken varies, but many programs use two 45° fields, which has been shown to have satisfactory sensitivity and specificity [ , ]. Some screening protocols routinely perform pharmacologic mydriasis, while others opt for nonmydriatic photography and only perform mydriasis if image quality is inadequate [ , ].
6.2
Limitations of current screening programs
Despite the success of modern DR screening programs, there remain some important limitations. First, DME is now the most important cause of visual impairment in diabetes, and CFP is a suboptimal modality for DME detection. The presence of DME is often inferred from the presence of hard exudates on CFP, but this modality has a poor specificity for DME when compared to OCT [ ]. The high false-positive rate of referrals for DME in large-scale DR screening programs places a significant burden on healthcare systems. Second, current screening protocols do not include much of the retinal periphery [ ]. Third, even with asynchronous telemedicine approaches, large-scale DR screening programs are still costly to run, and very labor-intensive [ , ]. Fourth, screening programs and access to care in low-resource countries are still major problems. Even if sufficient resources exist for screening, these programs will only be effective in prevention of blindness if they are deployed in conjunction with timely access to appropriate specialist assessment and treatment [ ].
6.3
New paradigms in DR screening
With the increasing availability of widefield imaging systems, it is likely that DR screening protocols using WFCP will soon become commonplace. Cross-sectional studies have evaluated the use of WFCP for DR severity grading, within the area traditionally covered by the standardized ETDRS 7 fields. These studies have shown that DR severity grading using WFCP within this area has acceptable levels of agreement (k = 0.69–0.96) with the current gold standard [ , , , ]. If more prospective longitudinal studies confirm the importance of peripheral retinal lesions in DR, WFCP may one day become standard of care for DR screening.
OCT is the modality of choice for assessment of DME and is likely superior in this regard to CFP in both sensitivity and specificity [ , ]. Currently, OCT is primarily deployed at the specialist ophthalmology clinic level and is not part of routine community DR screening. However, as the cost of OCT devices comes down, and they become more accessible, it is conceivable that OCT will form part of community-level DR screening programs in the near future. This would likely reduce the false-positive referral rate to tertiary services for DME and may prove cost-effective overall.
Automated analysis of retinal images for DR screening is also possible now, using artificial intelligence (AI) and deep learning (DL) techniques [ ]. It has been demonstrated, by different research groups around the world, that DL algorithms can automatically detect DR from CFP with high levels of accuracy ( Fig. 6.5 ) [ , ]. In 2016, a DL algorithm developed by Google Inc (Mountain View, CA, USA) that was trained on about 128,000 images showed high sensitivity and specificity for detection of referable DR from CFP in two external datasets [ ]. In 2017, a group from Singapore developed a DL system using almost 500,000 images and tested it on a dataset from the Singapore national DR screening program and 10 other datasets from around the world. The DL system was able to detect referable DR with high levels of accuracy, across all datasets [ ]. In 2018, an autonomous AI-based DR screening system developed in the USA was validated in a prospective clinical trial across 10 sites in the USA. This system, called IDx-DR (IDx LLC, Coralville, IA, USA), was evaluated against the reference standards of CFP graded by the Wisconsin Fundus Photograph Reading Center and OCT for DME detection. IDx-DR exceeded all prespecified superiority endpoints, and achieved a sensitivity of 87.2%, and specificity of 90.7% for detection of “more than mild DR” (mtmDR) [ ]. On the basis of this trial, IDx-DR became the first autonomous AI diagnostic system to receive Food and Drug Administration (FDA) approval in the USA and is already in clinical use. In 2020, another autonomous AI-based DR screening system called EyeArt (Eyenuk, Inc., Woodland Hills, CA, USA) received USA FDA clearance for automated detection of mtmDR and VTDR from CFP [ ]. In a prospective clinical trial in the USA, EyeArt achieved a sensitivity of 96% and a specificity of 88% for detecting mtmDR. The DL-based DR screening system developed in Singapore, named SELENA+ (EyRIS, Singapore), is planned for clinical deployment within the Singapore national DR screening program soon. There are numerous other AI-based DR screening systems that are available, or in development, including some which use retinal photographs taken with smartphone cameras [ ]. AI algorithms are likely to feature prominently in future DR screening programs, either as fully autonomous systems or in hybrid models.
7
New insights in systemic treatment
7.1
Glycemic control and DR
The relationship between glycemic control and DR is well-established. The prevalence of DR is strongly correlated with duration of diabetes and level of glycemic control [ ]. International management guidelines universally recommend systematic optimization of glycemic control for all patients with DM, with or without DR [ , ]. Pivotal clinical trials have been instrumental in elucidating the relationship between glycemic control and DR. The DCCT was a randomized clinical trial comparing intensive glycemic control against conventional glycemic control in patients with type 1 diabetes [ ]. This study showed that in type 1 diabetes, intensive glycemic control is extremely effective in reducing the incidence of DR, resulting in a 76% risk reduction compared to conventional control. Intensive glycemic control was more effective at primary prevention than secondary intervention—eyes without DR had a 76% reduction in incidence of DR, but eyes with pre-existing DR had a 54% reduction in DR progression. However, it takes significant time (3 years in this study) for the beneficial effect of intensive glycemic control to become apparent, and in fact, DR can actually progress more quickly in the initial period of intensive control [ ].
Similarly, in type 2 diabetics, the UKPDS trial demonstrated the benefit of intensive glycemic control in preventing DR progression [ ]. In this study, the beneficial effect of glycemic control on DR progression was also only apparent after 3 years. However, analysis of multiple large clinical trials in type 2 diabetes seems to suggest that the effect of glycemic control on preventing DR progression is more modest in type 2 than in type 1 diabetes. A meta-analysis including 7 large clinical trials in type 2 diabetes concluded that intensive glycemic control reduced the risk of DR progression by about 20% [ ]. Long-term post-trial monitoring of patients enrolled in the original UKPDS has also provided valuable insights [ ]. Differences in HbA1c levels between treatment arms were only maintained for 1 year after the interventional trial closed and subsequently disappeared. However, despite the subsequent equalization in glycemic control, the group that received initial intensive control continued to have significantly lower risk of DR, even up to 25 years after randomization [ ]. This concept was termed as a “legacy effect” or “preconditioning”—that early improvements in glycemic control result in long-lasting improvements in DR outcomes.
7.2
Hypertension and hyperlipidemia in DR
International management guidelines for diabetes and DR also universally recommend optimization of co-existing hypertension and hyperlipidemia [ , ]. The UKPDS showed that tight blood pressure control independently resulted in significant reductions in the risk of DR progression and deterioration in visual acuity during the study period [ ]. A systematic review of 15 large randomized clinical trials concluded that optimization of blood pressure reduces the incidence of DR, although the association with prevention of DR progression was less clear [ ]. Long-term post-trial monitoring of the UKPDS cohort did not demonstrate a “legacy effect” in blood pressure control [ ]. After differences in blood pressure control were lost between treatment groups, differences in the risk of DR progression were not maintained. This suggests that strict blood pressure control in diabetes must be continued, in order to realize continued therapeutic benefits for DR [ ]. Some trials have also suggested that pharmacologic agents blocking the renin-angiotensin system, such as enalapril, losartan or candesartan, may have independent, additional benefit for DR over blood pressure control alone.
The relationship between hyperlipidemia and DR and DME has been less well studied. While optimization of hyperlipidemia has clear systemic benefits, its impact on DR is less clear. A recent meta-analysis of 7 observational cohort studies showed that patients with DR had slightly higher levels of low-density lipoprotein cholesterol (LDL-C), than patients without DR, but levels of other lipid markers such as high-density lipoprotein cholesterol (HDL-C), total cholesterol, and triglycerides (TG) were no different [ ]. Secondary analyses of clinical trial data have failed to show convincing relationships between lipid levels and DR [ , ]. Some studies have suggested that other lipid markers such as apolipoproteins A1 and B may be more closely associated to DR [ ]. Higher lipid levels have been linked to DME in observational studies, but meta-analysis of prospective randomized controlled trials comparing lipid-lowering treatment against placebo did not show a difference in worsening of hard exudates or DME [ ].
7.3
Fenofibrate and DR
Systemic fenofibrate therapy has demonstrated benefit in DR, independent of its effects on serum lipid levels. In 2007, the FIELD study showed that fenofibrate therapy compared to placebo effectively reduced the need for retinal laser photocoagulation (for either PDR or DME) by 31% and also reduced the risk of DR progression (though not incidence) [ ]. In the ACCORD study, the addition of fenofibrate therapy (on top of simvastatin) reduced DR progression by 40% over 4 years [ , ]. Similar to the FIELD study, this treatment effect was limited to those patients with pre-existing retinopathy at baseline. However, the follow-up ACCORDION study showed that fenofibrate treatment had no “legacy effect,” with subsequent rates of DR progression equalizing between treatment arms after cessation of therapy [ ].
The mechanism of action of fenofibrate in DR is still unclear. The studies that demonstrated the benefit of fenofibrate showed that its treatment effect was largely independent of lipid levels [ , ]. Postulated mechanisms include modulation of intraretinal lipid transport, effect on apolipoprotein levels, antiapoptotic activity, antioxidant and anti-inflammatory activity, and modulation of the blood-retinal barrier [ ].
Many international clinical management guidelines for diabetes suggest considering fenofibrate treatment, based on its benefit in DR, but stop short of universal recommendation [ , ]. This is likely due to a variety of factors, including a lack of benefit in improving systemic cardiovascular outcomes, cost, and uncertain cost-effectiveness. Greater collaboration between ophthalmologists and primary care physicians or diabetologists may help in this regard.
8
New insights in ocular treatment
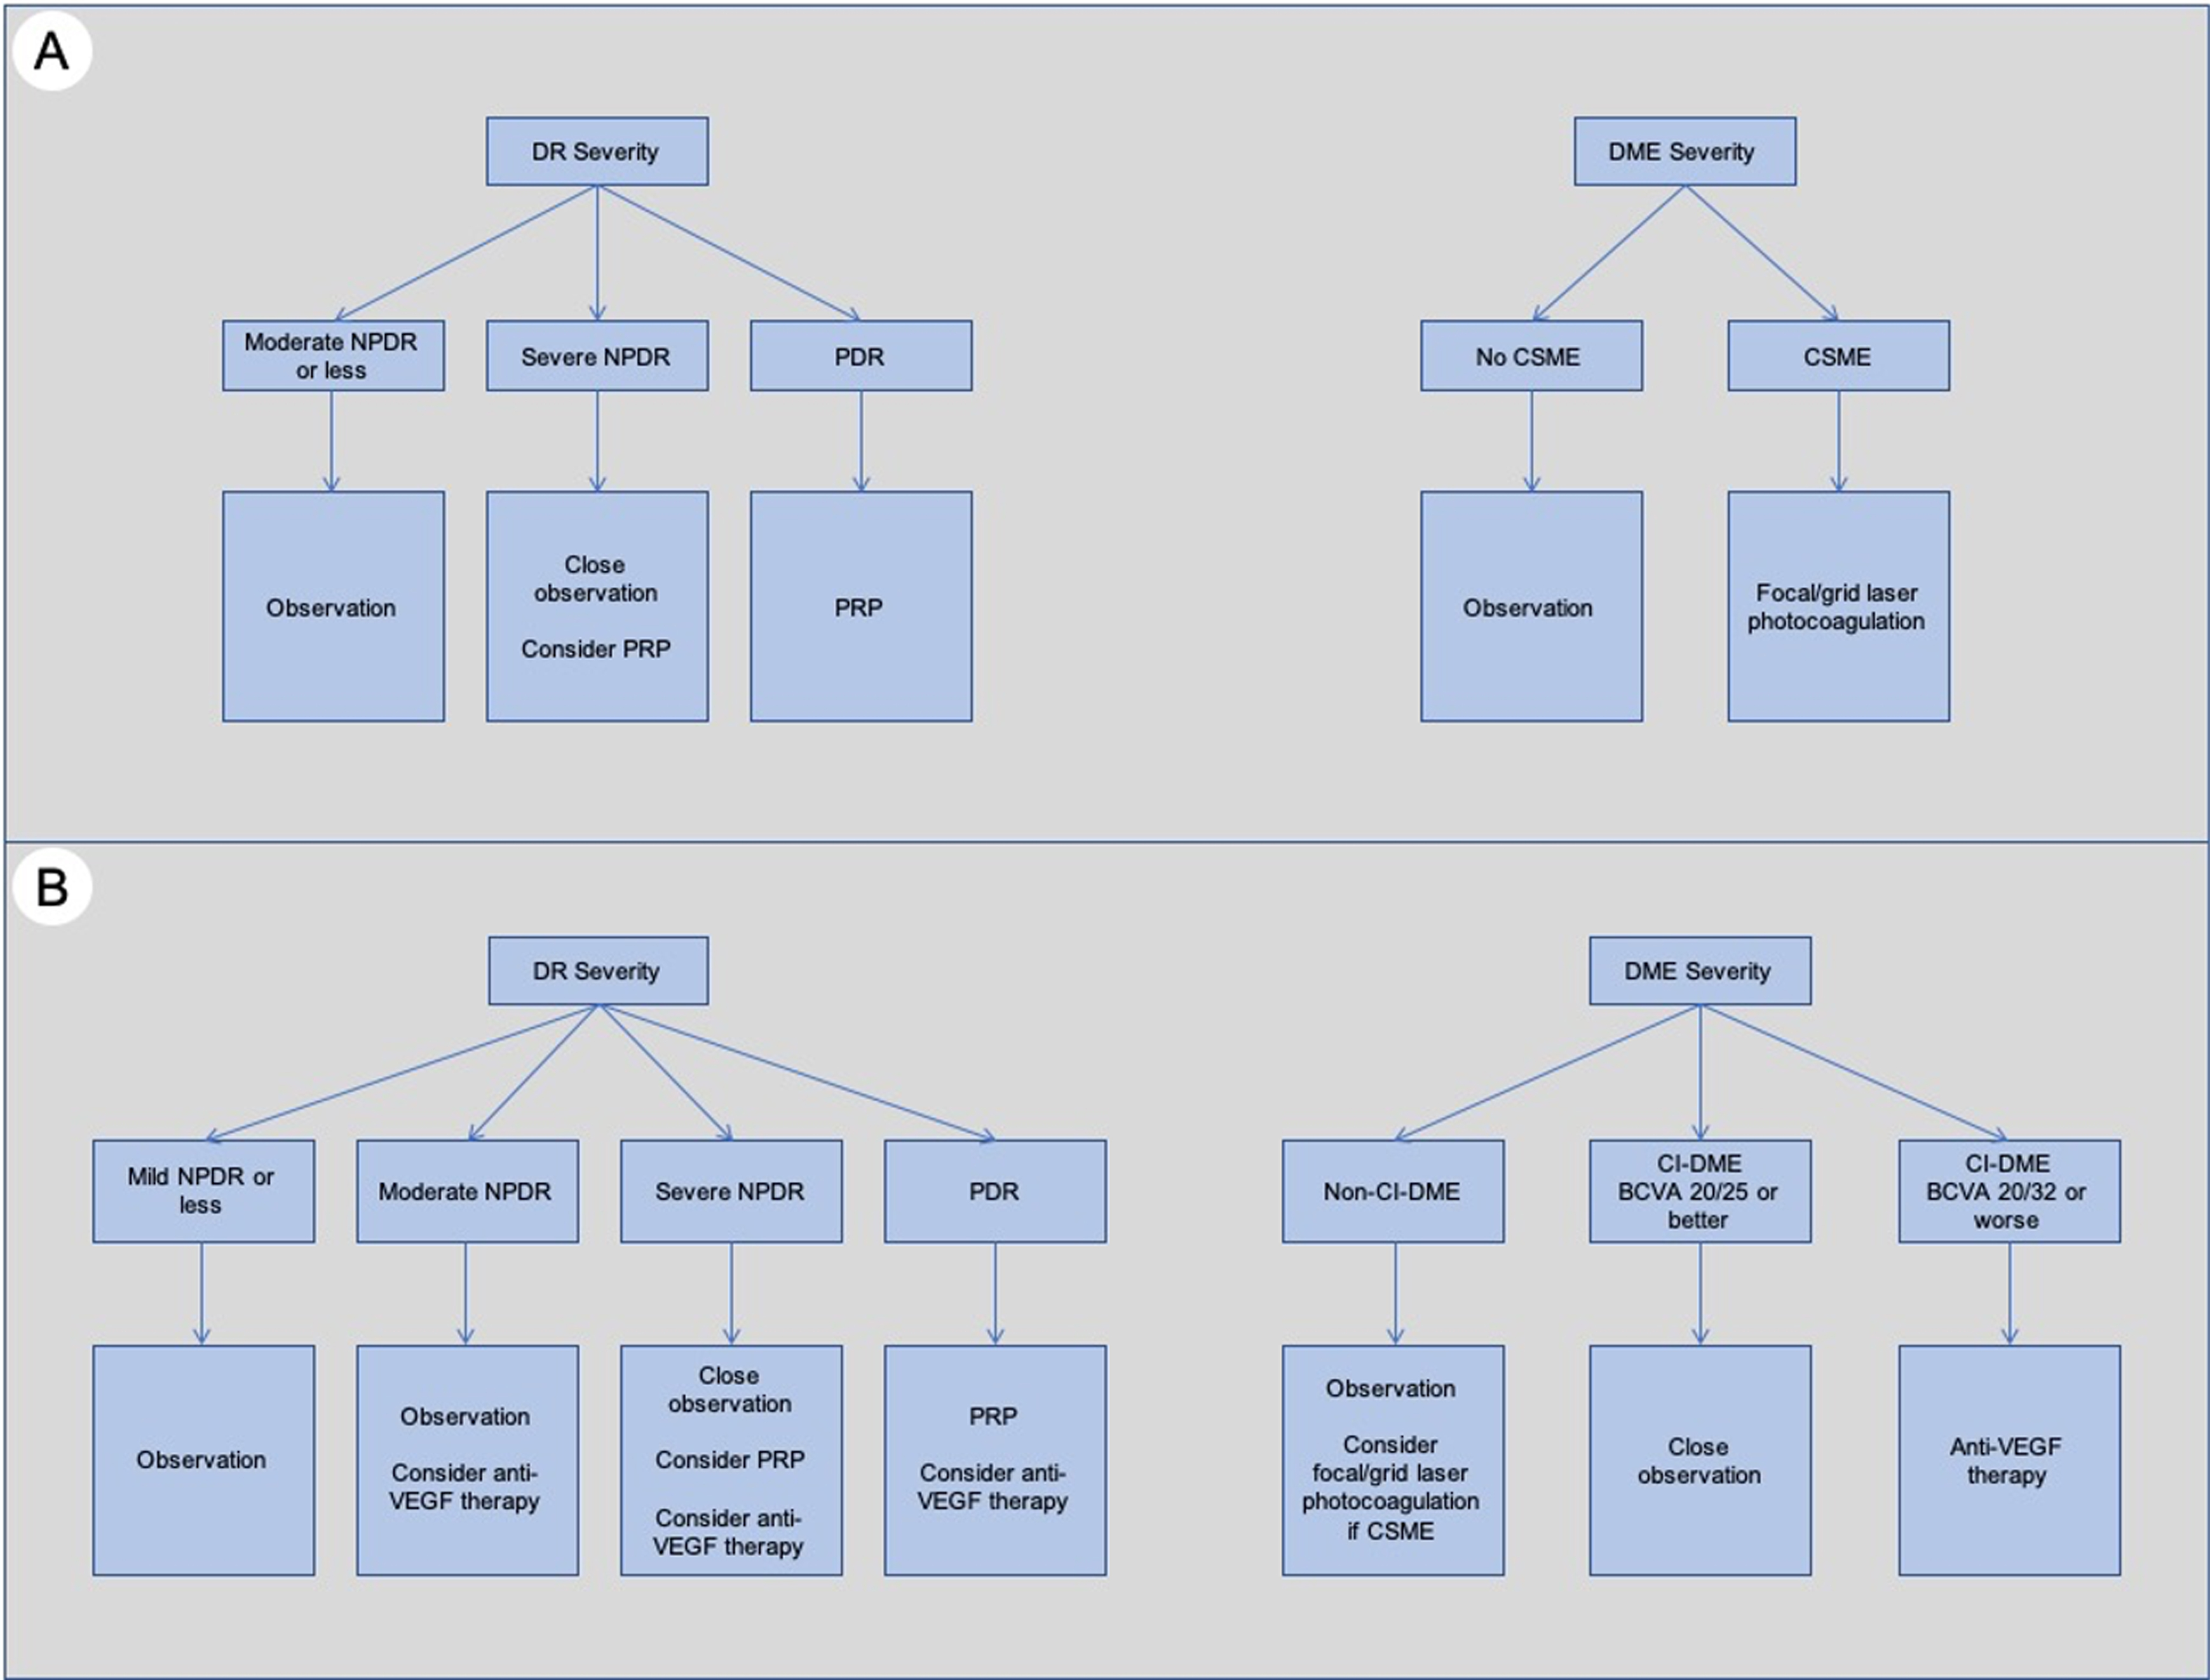
The traditional ocular treatment algorithm ( Fig. 6.6 ) for DR was established in the 1980s and 1990s, based on findings from the pivotal DRS and ETDRS trials [ ]. In essence, pan-retinal photocoagulation (PRP) was the treatment of choice to reduce severe visual loss in PDR and could be considered in high-risk cases of severe NPDR, while focal/grid laser photocoagulation was indicated for DME that met the criteria for clinically significant macular edema (CSME) [ ]. This tried-and-tested approach was in use for almost 3 decades and has been in large part responsible for the reduction in vision loss related to DR and DME. Surgical treatment (e.g., pars plana vitrectomy) in DR has been mainly used for the treatment of complications of PDR, with the most common indications being vitreous hemorrhage (VH), and tractional retinal detachments (with or without associated rhegmatogenous contribution). However, in the last decade, major developments and new landmark clinical trials have dramatically altered our treatment approach and the standard of care for DR and DME ( Fig. 6.6 ).
Related posts:
 Overview on chronic complications of diabetes mellitus
 Molecular mechanisms involved in hyperglycemia-induced cellular damage
 Epidemiology of chronic complications of diabetes: A global perspective
 Pathogenesis of diabetic atherosclerotic cardiovascular disease
 Vascular calcification in diabetes mellitus: Molecular mechanisms and clinical implications
 Macular edema: A fearful complication of diabetic eye disease
Stay updated, free articles. Join our Telegram channel

Full access? Get Clinical Tree


