1 Diabetes Mellitus: An Introduction
The aim of this introduction is to provide a general understanding of diabetes mellitus and its impact on the diabetic individual. It will focus on aspects of epidemiology, pathobiochemistry, prevention, and therapy. Given the scope covered, selectivity and bias of topics and citations have been accepted as unavoidable.
 Definition
The term “diabetes mellitus” comprises a number of chronic diseases characterized by hyperglycemia due to absolute or relative insulin deficiency. Hyperglycemia is only the most obvious biochemical marker of complex metabolic disorders that affect carbohydrate, lipid, protein, and electrolyte metabolism and may impair numerous organs and functions of the organism.
 Diagnosis
The diagnosis of diabetes mellitus is based on classical symptoms (weight loss, polyuria, thirst, muscular weakness and fatigue) and persistent hyperglycemia. Glucosuria and elevated glycosylated hemoglobin (HbAlc) levels should not be used for diagnosis. The criteria for diagnosis of hyperglycemia and the classification of diabetes mellitus are not uniformly accepted. Some physicians use the criteria of the United States National Diabetes Data Group of 1979 [1], which was endorsed by the World Health Organization Study Group on Diabetes Mellitus in 1985 [2], while others prefer the criteria of the Expert Committee on the Diagnosis and Classification of Diabetes Mellitus of the American Diabetes Association 1998 [3] (Table 1.1).
The criteria published in 1998 tend to diagnose diabetes in younger and more obese subjects than the WHO 1985 criteria, while subjects with postprandial hyperglycemia, microalbuminuria, and those with other predictors of cardiovascular disease are less likely to receive this diagnosis despite the fact that they are at similar risk of premature death [4–8].
 Classification
The diabetes mellitus classification of 1979 [1] was based “in large part on the pharmacological treatment used in its management.” This was reflected in the terms “insulin-dependent diabetes mellitus” (IDDM) and “non-insulin-dependent diabetes mellitus” (NIDDM) and the further subdivision of patients with the latter into obese and nonobese. The typing of 1998 is based on etiology and pathogenetic mechanisms (Table 1.2). About 50 different types of diabetes mellitus have been identified, the majority of cases being type 1, type 2, or gestational diabetes mellitus.
Table 1.1 Criteria for the diagnosis of diabetes according to the World Health Organization [2] and the American Diabetes Association [3]
World Health Organization | American Diabetes Association |
|---|---|
Clinical: | |
Increased thirst and urine volume, unexplained weight loss, established by casual blood glucose | Polyuria, polydipsia and unexplained weight loss plus casual plasma or capillary blood glucose ≥ 200 mg/dl (11.1 mmol/l) |
or | or |
Biochemical: | |
Casual venous plasma glucosea > 200mg/dl (11.1 mmol/l), fasting venous or capillary plasma glucose b ≥ 140 mg/dl (7.8 mmol/l) and 2 h venous or capillary plasma or capillary whole blood glucose c ≥ 200 mg/dl (11.1 mmol/l) after glucose loadd | Fasting plasma glucose ≥ 126 mg/dl (7.0 mmol/l) or capillary blood glucose ≥ 110 mg/dl or 2 h plasma or capillary blood glucose ≥ 200 mg/dl (11.1 mmol/l) during an oral glucose tolerance test |
a Values for capillary plasma > 220 mg/dl, for venous whole blood >180 mg/dl. for capillary whole blood > 200 mg/dl
b Value for venous and capillary whole blood ≥ 120 mg/dl
c Value for venous whole blood ≥ 180 mg/dl
d Performed as described by WH01985 [2] using a glucose load containing the equivalent of 75 g anhydrous glucose dissolved in water
There is a great similarity between type 1 diabetes and IDDM and between type 2 diabetes and NIDDM. However, these pairs of terms should not be used indiscriminately as being respectively synonymous. Type 1 diabetes mellitus may for a limited time after manifestation remain non-insulin-dependent, particularly when it begins in an adult (latent autoimmune diabetes in adults. LADA; see page 10). On the other hand, NIDDM, like any type of diabetes mellitus, may become insulin-dependent at an advanced or critical stage.
 Epidemiology
Epidemiological research on diabetes mellitus is hampered by methodological problems. The criteria and methods for both the diagnosis and the classification of diabetes mellitus have changed over time. Population-based studies are rare, studies based on subgroups are usually biased, and even random samples are not always representative. The epidemiology of diabetes mellitus shows considerable regional variation, so that when data from different regions are compared, the ethnicity, gender, and age structure of the groups that had been studied need to be considered-but frequently these have not been communicated. These problems are more relevant to studies on type 2 respectively NIDDM than type 1 respectively IDDM.
Type 1 Diabetes/IDDM
The incidence of IDDM varies considerably with geography and ethnicity. In Japan, China, and in African Americans the incidence (number of new cases per 100 000 person-years) in the age group of 0-14 years is below 5. In most European regions it is about 1020 per 100 000 person-years, and in Finland and Sardinia it is above 30 [2,9,10,11].
The highest incidence of IDDM is found in children below the age of 15, but IDDM or type 1 diabetes may become manifest at any age. The estimated incidence in adults is about half that observed in children of the respective population. However, the figure may be much higher if cases of LADA are included, which may comprise about 10% of all patients initially diagnosed as having type 2 diabetes mellitus [12]. Worldwide a trend to increasing incidence in children and adolescents has been observed [13–15]. According to a Finnish study the incidence is increasing more in younger than older age groups [16]. Firstborn children are at highest risk. The risk increases with the age of the mother [17].
Table 1.2 Shortened version of the classification of diabetes according to the Expert Committee on the Diagnosis and Classification of Diabetes mellitus [3]
I. Type 1 diabetes (β-cell destruction, usually leading to absolute insulin deficiency) A. Immune-mediated B. Idiopathic II. Type 2 diabetes (may range from predominantly insulin resistance with relative insulin deficiency to a predominantly secretory defect with insulin resistance) III. Other specific types A. Genetic defects of β-cell function B. Genetic defects in insulin action C. Disease of the exogenic pancreas D. Endocrinopathies E. Drug- or chemical-induced F. Infections G. Uncommon forms of immune-mediated diabetes H. Other genetic syndromes sometimes associated with diabetes IV. Gestational diabetes (GDM) |
Reliable data about the prevalence of IDDM/type 1 diabetes mellitus are not available. Type 1 diabetes is associated with genetic as well as environmental factors. The rising incidence can hardly be explained by a change in the gene pool, so environmental factors must be playing a major role. However, it is impossible at present to decide what these environmental factors are.
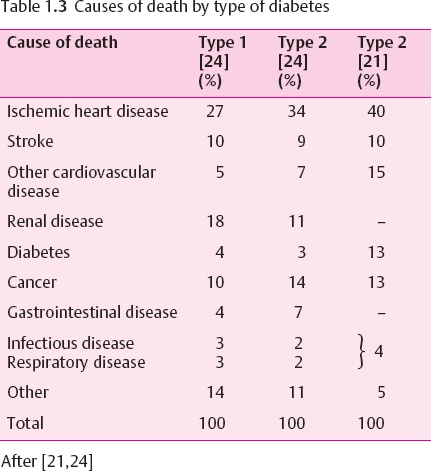
The life expectancy of IDDM subjects is reduced. The number of lost years of life depends on the age at diagnosis (it is highest in early-onset IDDM) and on the quality of care as well as on chronic complications [18–20]. In the USA, mortality “among males was 5.4 times higher and in females it was 11.5 times higher than in the total US population.” “Among people with age at diagnosis < 30 years, IDDM reduces life expectancy by at least 15 years.” In 70-90% the cause of death is related to diabetes [21]. In long-term type 1 diabetes vascular complications are the most important predictors and causes of death[22–24] (Table 1.3). In the USA, ketosis has been the cause of death in about 10% of people with IDDM who died at 0-44 years of age. Hypoglycemia may be the undiagnosed cause of sudden death. It was noted as an underlying cause of death in about 1 of 300 deaths due to diabetes [25]. Others have estimated that 2-4% of all deaths in IDDM subjects are due to hypoglycemia [26].
Type 2 Diabetes/NIDDM
Type 2 diabetes mellitus is by far the most common type of diabetes. By extrapolation from the incidence of diabetic retinopathy in recently diagnosed subjects it may be concluded that the disease will manifest a couple of years before it is diagnosed. Most cases are diagnosed in individuals under the age of 60 years. The highest prevalence is found in the age group of 65-75 years.
Since type 2 diabetes develops insidiously, it is difficult to determine its incidence. Most reliable are prevalence data of clinical NIDDM/type 2 diabetes and of impaired glucose tolerance (IGT), which is assumed to precede clinical NIDDM/type 2 diabetes. Considerable regional differences exist in the prevalence of NIDDM/type 2 diabetes depending on relative body weight, life style, ethnic origin, nutritional habits, social status, education, and the age structure of the population [27,28]. Type 2 diabetes/NIDDM used to be the disease of affluent societies in highly developed industrialized regions. This is no longer true. The highest prevalence is now found in Fiji, Micronesia, and among the Pima Indians. There is a worldwide trend towards both increasing prevalence and incidence and a lowering of the age at manifestation. It has been predicted that the number of diabetic subjects worldwide will double during the next two decades. This will be due not only to a rising incidence but also to increasing life expectancies in the growing world population.
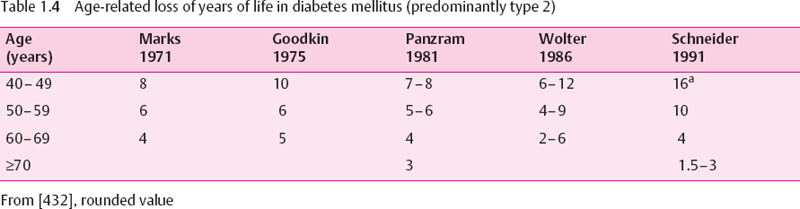
Type 2 diabetes is associated with an increased mortality. In western countries the loss of life years is about 30% of normal life expectancy (Table 1.4). Because the NIDDM/type 2 diabetes population is older as a whole, the average absolute number of lost years is smaller than in type 1 diabetes and becomes insignificant in the very old. The main cause of death is cardiovascular disease [22,29] (Table 1.3).The association between blood glucose control and the risk of dying is rather weak [30].
Other types of diabetes mellitus, such as gestational diabetes mellitus (GDM), maturity-onset diabetes in the young (MODY), malnutrition-related diabetes mellitus (MRDM), and endocrine syndromes associated with diabetes mellitus will not be discussed in this chapter.
 Etiology and Pathogenesis of Diabetes
Type 1 Diabetes
More than 20 different regions of the human genome show some linkage with type 1 diabetes mellitus [31]. Many of these genes carry a risk, others protect.
The strongest linkage is seen for the major histo-compatibility complex, which is located on chromosome 6 (IDDM1 locus). The importance of some HLA class II genes (e.g., DR7, DR9, DQA1 0301, DQB1 0201) differs among ethnic groups [9], as may be true for HLA class I genes. The physiological role of HLA molecules is to present foreign and self antigens to T lymphocytes and to other cells involved in the initiation of insulitis. The region of the insulin genes on chromosome IIp15 (IDDM2 locus) may also be involved. The importance of other type 1 diabetes mellitus-associated gene loci remains open.
Even in monozygotic twins the concordance for diabetes is not more than 50%, which indicates the importance of nongenetic factors. Environmental factors have been mainly studied in laboratory animals. The spontaneous diabetic NOD mouse is the star model, where numerous modulations of the environment or immunomodulatory protocols have been reported to lower the incidence of diabetes mellitus [32]. The ease of this success in preventing diabetes in a mouse model means that the observations cannot be simply transferred to the human situation.
In humans some seasonal variations of incidence with peaks in winter and early spring have been reported [11,33], but they seem to be absent in HLADR 3-positive and very young children [51]. The introduction of cow-milk-based diets before 3 months of age has been accused as a diabetogenic factor, but the epidemiological data remain controversial [34]. A homology of bovine serum albumin and human islet proteins and of immunogenic epitopes on β casein Al which resemble β-cell epitopes (immunogenic mimicry) have been suggested to be responsible for the induction of insulitis. Prospective or controlled intervention studies comparing feeding with cow-milk proteins and breastfeeding will be needed to answer this question [34]. Nitrosamines, various toxins, and infection with rubella, German measles, mumps, coxsackievirus B1, Epstein-Barr virus, and cytomegalovirus have also been discussed as possible causes. With the exception of congenital rubella virus infection [35], definite evidence of a causal role remains to be established.
Type 1 diabetes mellitus is an insulin deficiency syndrome caused by β-cell destruction. This is the result of an immune-mediated disease which leads to chronic inflammation of the islets of Langerhans, called insulitis. Various types of mononuclear cells are involved. On the basis of animal experiments, two types of insulitis may be distinguished [36–38]:
• Benign Th-2 (T-heiper-2 cell) type insulitis is characterized by secretion of interleukin (IL)-4, IL-10, and IL-13 and absence of aggressive immune cells. Cellular infiltration is located in the periphery of the islets and little β-cell destruction is seen.
• Destructive Th-1 (T-helper-1 cell) type insulitis is characterized by secretion of interferon (IFN)-γ;, tumor necrosis factor (TNF)-α, and IL-2 and the presence of cytotoxic T cells and activated macrophages, which migrate into the islets and cause β-cell damage by induction of apoptosis or necrosis.
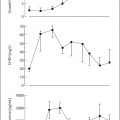
As a rule, insulitis is a chronic process which may begin in early childhood [39]. Its earliest sign seems to be the appearance of islet autoantibodies in blood, which may be detected many years before clinical diabetes can be diagnosed. Whether insulitis will proceed to clinical diabetes, and how rapidly this may occur, seems to depend on a variety of hitherto hypothetical immune modulatory factors. Th-2 cytokines suppress Th-1 cells and vice versa [40,41]. IF the Th-2/ Th-1 balance is shifted towards a Th-1 dominance, β-cell destruction will proceed until insulin release has dropped so low that blood glucose can no longer be regulated within the normal range, and clinical diabetes will become manifest [42] (Fig. 4.1).
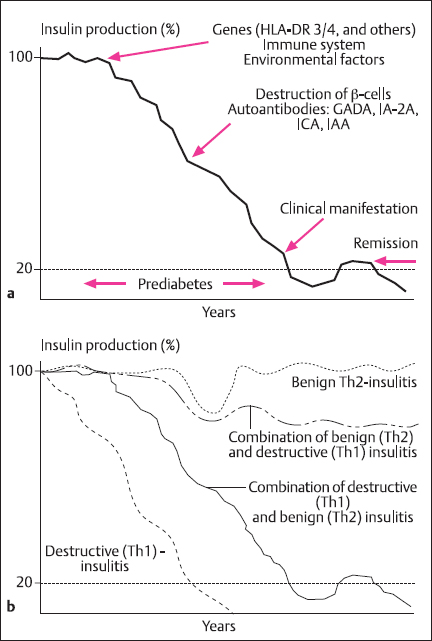
Fig. 1.1a, b Development of type 1 diabetes mellitus. a Insulin secretion in relation to clinical signs. b Insulin secretion in relation to type of insulitis. (Adapted by permission from Martin and Kolb [43])
In recent-onset diabetes, histological analysis of the pancreas shows infiltration by mononuclear cells, mostly T lymphocytes and monocytes/macrophages. Insulin-producing β cells are preferentially attacked. Other lobules of the pancreas may contain either completely insulin-deficient small islets which consist of A, D, and PP cells (A cells secrete glucagon, D cells somatostatin, and PP cells pancreatic polypeptide) or apparently normal islets. Such normal islets may persist for several years after diagnosis and could explain the remission or “honeymoon” phase and different grades of severity of the disease.
B lymphocytes and islet cell autoantibodies are not essential for β-cell destruction [433]. In the early stages of insulitis, glucose metabolism and stimulated insulin secretion are normal. When stimulated, early insulin secretion drops in autoantibody-positive subjects to the 1st percentile of normal, this indicates a loss of more than 80% of the β cells and the manifestation of diabetes mellitus in the very near future [44].
Type 2 Diabetes
Genes and Determination Factors
Type 2 diabetes mellitus is a heterogeneous group of disorders that result from the combination of insulin resistance and impaired insulin secretion. Their etiology “may range from predominantly insulin resistance with relative insulin deficiency to a predominantly secretory defect with insulin resistance” [3]. A widely accepted pathogenetic model assumes that diabetes develops in carriers of susceptibility genes if they are exposed to determination factors. The idea of a genetic basis is supported by both twin studies and differences in prevalence between ethnic groups [45]. The genetic influence is stronger than in type 1 diabetes (Table 1.5). Multiple candidate genes have been nominated, including “thrifty genes” related to the metabolic syndrome [47,48], but the type 2 diabetes genes are not yet established. The mutations that have been found in MODY [49] play no role in ordinary type 2 diabetes.
Most determination factors are related to insulin resistance (Table 1.6). Some of these factors, such as age, are beyond our control, but most can be influenced. Of outstanding importance is the metabolic syndrome, which was first described in 1967 [50] (Table 1.7). Its multifactorial etiology is not yet fully understood [52]. The metabolic syndrome precedes and accompanies overt diabetes. Its components also constitute risk factors for vascular complications. This explains why many subjects already show angiopathies at the time of diagnosis of diabetes mellitus. For this reason, it is reasonable to expand the concept of type 2 diabetes to the early disorders of the preclinical phase, which traditionally have been neglected.
Obesity is closely related to physical inactivity. Both physical inactivity and obesity are associated with type 2 diabetes [53–56]. The relationship is most pronounced in the visceral (android, truncal, abdominal central) type of obesity [57–59]. This type of obesity is in its turn related to aging [60] and to physical inactivity [61]. Increasing abdominal adipose tissue mass and weight gain are predictors of impaired glucose tolerance, dyslipoproteinemia, hypertension, and hyperuricemia [55]. Weight reduction predicts improvement of these risk factors [62] and of life expectancy [63]. This direct relationship indicates that obesity and physical activity are causal determininants rather than being accidentally associated with these disorders.
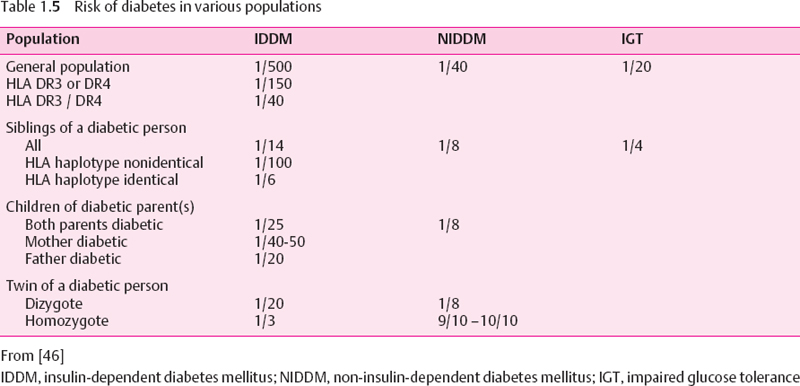
Table 1.6 Determination factors of type 2 diabetes mellitus
Family history of diabetes mellitus Age Metabolic syndrome Physical inactivity Western life style Diabetogenic drugs Endocrinopathies and pregnancy |
The importance of life style has been shown in longitudinal studies on, for example. Indians who emigrated to South Africa [64], and Japanese people who emigrated to North America [65], where they developed not only obesity but also diabetes. Thus, a genetic predisposition to diabetes may be revealed only under the influence of a diabetogenic life style. This concept has been confirmed in other populations [66,67] and by intervention studies (see p. 19). It has also been suggested that fetal malnutrition may predispose to the metabolic syndrome [68–71], but this hypothesis has been challenged [72,73].
Insulin Sensitivity
In the majority of type 2 diabetic individuals insulin resistance seems to be a very early or indeed the primary metabolic disorder [74–76]. In the general population insulin sensitivity varies over a wide range. The variation between members of a family is smaller than that between families [91], indicating a genetic determination.
The mechanisms of insulin resistance most likely involve polygenic defects [76] (Table 1.8), which cannot be discussed in this chapter. However, insulin resistance may also be acquired [77]. Some factors that enhance insulin resistance are identical with determination factors of type 2 diabetes (Table 1.6).
The biochemistry of insulin resistance has been extensively studied. Insulin acts through binding to a specific receptor which is composed of two extracellular insulin-binding α-subunits (135 kDa) and two cytoplasmic β-subunits (95 kDa) that carry a tyrosine kinase domain. Insulin binding initiates a conformational change which results in the activation of a tyrosine kinase. Important substrates of this kinase are the receptor itself and the insulin receptor substrates IRS-1 to IRS-4. Processes which are not completely understood connect the hormone to different signaling cascades which trigger either metabolic or mitogenic stimulation (Fig. 1.2).
The effects of insulin are cell-specific (Table 1.9). Insulin stimulates glucose uptake and glycogen synthesis in muscle. Insulin resistance of the muscle may precede impaired glucose tolerance. It usually begins with an impairment of nonoxidative glucose metabolism; later, oxidative glucose metabolism is also involved [91–93]. These defects may contribute to postprandial hyperglycemia.
Table 1.7 The metabolic syndrome originally [50] and today
1969 | 2000 |
|---|---|
Obesity | aObesity, abdominal type aInsulin resistance |
Hyperinsulinemia | Hyperinsulinemia |
Impaired glucose tolerance | aImpaired glucose tolerance, type 2 diabetes Dyslipoproteinemia |
Hypertriglyceridemia | aHypertriglyceridemia aLow-HDL cholesterol Small, dense LDL |
Hyperlipidacidemia | Hyperlipidacidemia |
Abnormal adipose tissue metabolism | Hypertension Activated hemostasis Platelet activation LowPAI-1 Low thromboplastin Hyperfibrinogenemia Hyperuricemia Hyperandrogenemia in women aAlbuminuria |
a WHO criteria [51]
HDL, High-density lipoprotein; LDL, low-density lipoprotein; PAI-1, plasminogen activator inhibitor-1
Table 1.8 Causes and candidate genes of primary insulin resistance
Insulin receptor Insulin binding site (α-subunit) Tyrosine kinase activity (β-subunit) |
Insulin receptor substrate |
Glucose utilization CLUT-4 (decreased expression and/or translocation) [81] Glycogen synthase? Hexokinase II? |
Others Rad [82] Glucagon receptor [83] Fatty acid binding protein (FABP) [84] β3-Adrenergic receptor [85] |
Calpain-10 [89] |
Adapted from [78]
It has been suggested that genetically determined insulin resistance of the muscle is the primary defect in the majority of type 2 diabetic individuals [74,94]. However, in cell culture, muscle cells from lean, non-diabetic, insulin-resistant subjects do not preserve their insulin resistance, suggesting that environmental factors may be of pivotal importance in the insulin sensitivity of muscle [95].
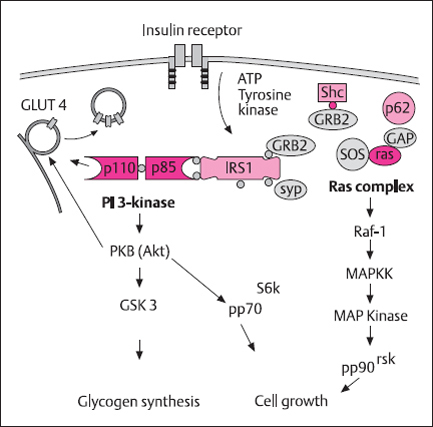
Fig. 1.2 Hypothetical insulin signaling pathways. Insulin signaling is initiated at the level of the insulin receptor. The insulin receptor tyrosine kinase activity leads to tyrosine phosphorylation of insulin receptor substrates (IRS1, IRS2, She). The phosphotyrosine residues of these proteins transfer the signal via SH2 domains and adapter molecules (Grb2, SOS, Syp) onto signal mediators like PI-3 kinase and the RAS complex. The PI-3 kinase pathway leads to translocation of glucose transporter 4 GLUT-4) and stimulation of glycogen synthesis; the RAS complex is a mediator for the activation of the MAP kinase, which is important for insulin-dependent cell growth and protein synthesis. (Adapted by permission from Holman and Kasuga [90] and from J. Eckel, personal communication)
PI 3-kinase. phosphatidylinositol 3-kinase; IRS, insulin receptor substrate; Shc, adaptor protein Shc; SH2, Src homology 2; PKB, protein kinase B; SOS. son-of-sevenless; Ras, small GTP-binding protein; Raf proteins, serine-threonine kinases with homology to PKC; MAP kinase, mitogen activated protein kinase; GSK3, glycogen synthase kinase 3; GRB2, growth factor receptor binding protein 2: Syp, SH2 domain-containing protein-tyrosine-phosphatase
Table 1.9 Effects of insulin on different tissues
Effect | Tissue |
|---|---|
Stimulation of membrane transport | |
Glucose | Muscle, adipose tissue |
Amino acids | Muscle, adipose tissue |
Ions | Muscle, adipose tissue, liver |
Stimulation of synthesis | |
Glycogen | Muscle, adipose tissue |
Protein | Muscle, adipose tissue, lactating mammary gland |
Fatty acids | Liver, adipose tissue, lactating mammary gland |
Triglycerides | Liver, adipose tissue, lactating mammary gland |
Inhibition of | |
Lipolysis | Adipose tissue |
Proteolysis | Muscle, liver |
Gluconeogenesis and glucose production | Liver |
Cell proliferation and differentiation | Stem cells, preadlpocytes, fibroblasts Differentiated cells? |
In the liver insulin suppresses gluconeogenesis and hepatic glucose release. Insulin resistance may unleash hepatic glucose output, which plays a role in fasting hyperglycemia.
In adipocytes insulin inhibits lipolysis and stimulates glucose uptake, lipid synthesis, and esterification of fatty acids. Therefore, insulin resistance results in elevated plasma free fatty acids (FFA), which in their turn contribute to insulin resistance, increased gluconeogenesis, hepatic glucose output, and very-low-density lipoprotein (VLDL) production.
The mechanism of the relationship between obesity and insulin resistance is still a matter of debate. FFA could play a major role [100]. High plasma FFA concentrations induce insulin resistance in muscle and liver [96]. The augmentation of adipose mass results in increased FFA release. Since visceral fat cells are metabolically more active and more sensitive to lipolytic stimuli, the increase of FFA is most pronounced in persons with visceral obesity. This is in line with the high diabetes rate in this type of obesity.
At the molecular level, the Randle mechanism, the inhibition of the glycogen synthase [96], the inhibition of the insulin signal cascade [97], or genomic effects which could be mediated through peroxisome proliferator-activated receptor (PPAR)-α have been discussed as possibly implicated in insulin resistance [98].
The Randle mechanism, also called the glucose-fatty acid cycle, postulates an inhibition of muscular glucose utilization by FFA [99]. Its relevance in humans is debated [92,100]. FFA are also important stimulators of hepatic gluconeogenesis and hepatic glucose output [101], which is unleashed in early impaired glucose tolerance [102]. This effect allows the enhanced hepatic glucose output to be explained without postulating genuine hepatic insulin resistance.
Another link between obesity and insulin resistance could be related to the hormonal activity of adipose tissue. Fat cells produce a variety of molecules with endocrine and paracrine activity. Some of them, including leptin, estrogens, IGF-I, FFA, and complement factors are released into the circulation. The cytokines TNF-α, interieukin-6, and angiotensinogen or angiotensin may act locally. Since metabolically active fat cells are located not only in adipose tissue but also inside the muscle, in close vicinity to myocytes, signals from these fat cells may have effects on adipocytes or muscle cells without being detectable in the circulation.
There is some evidence that signals released from fat cells are involved in insulin resistance. In laboratory animals the expression of TNF-α in adipocytes is linked to insulin resistance [86]. This cytokine stimulates phosphorylation of the serine residues of IRS-1, leading to reduced activity of the insulin receptor tyrosine kinase [88,103]. An inhibition of insulin signaling at the phosphatidylinositol 3-kinase (PI-3 kinase) level has been shown in human fat cells [88]. It could explain why TNF-α inhibits insulin-stimulated glucose transporter 4 (GLUT-4) expression and translocation [88,104,105] and may thereby impair glucose utilization. In obesity and type 2 diabetes, the expression of TNF-α and its receptors is increased in adipose and muscle tissue [86,104].
Physical activity has major effects on glucose and lipid metabolism. The sequence of metabolic changes during exercise can be summarized as follows: white muscle fiber metabolism dominates during the first few minutes of exercise. During endurance exercise red fibers dominate. Their aerobic glycolysis is increased and all endogenous and exogenous substrates are oxidized. Muscle and liver glycogen is mobilized and used up. Glucose uptake may increase up to 20-fold. Serum insulin decreases, indicating enhanced insulin sensitivity. After about 10 minutes’ exercise, oxidation of FFA becomes more important and may increase to up to 50-fold of the basal level. Finally, energy metabolism is fueled mainly by FFA and β-hydroxybutyrate/acetoacetate. After strenuous exercise (e.g., marathon), plasma FFA may stay elevated and glucose uptake may remain reduced for several hours (“post-exercise insulin resistance”). A paradoxical increase in blood glucose is seen after short-term exhaustive exercise, which is the result of stress hormone release [106,107].
Increased insulin sensitivity during exercise is due to increased muscular blood flow with greater insulin delivery to muscle, opening of closed capillaries, which enhances the surface area for glucose uptake, and translocation of glucose transporters, mainly GLUT-4 [108]. Physical training stimulates GLUT-4 synthesis [109]. Enhanced insulin sensitivity vanishes in periods of physical inactivity. This occurs as early as after a few days of strict bed rest.
Clinical experience shows that in poorly controlled diabetic individuals insulin sensitivity is decreased. It improves when metabolic control is restored towards normal. This metabolic insulin resistance has been described by the term “glucose toxicity.” The mechanism of glucose toxicity is not fully understood. One explanation is increased synthesis of glucosamine, which could cause insulin resistance by inhibition of the translocation of GLUT-4 in muscle [110–112]. Glucosamine seems also to inhibit glucose-induced insulin secretion [110]. Thus, this metabolite would mimic both the major pathogenetic mechanisms in type 2 diabetes. However, since poor metabolic control is characterized by high plasma FFA levels, the aforementioned effects of plasma FFA on liver and muscle metabolism could also explain some signs of metabolic insulin resistance.
Insulin Secretion
Instead of postulating insulin resistance and peripheral underutilization of glucose as the primary defect, some investigators have proposed that impaired insulin secretion and impaired suppression of hepatic glucose production are the important determinants of glucose intolerance [102,113]. Gerich [114] based his view on the evaluation of insulin secretion after an oral glucose load. In subjects with impaired glucose tolerance, and even more in those with clinical N1DDM, early insulin secretion is reduced and late insulin secretion increased [115]. Defective early insulin release is responsible for impaired glucose tolerance, which on its part triggers late hyperinsulinemia. The suppression of hepatic glucose production is impaired [102,116], resulting in increased hepatic glucose output. Under steady-state conditions this is equal to increased glucose disposal. Indeed, forearm muscle glucose uptake is not impaired in person with impaired glucose tolerance [116]. From these observations, Gerich concluded that peripheral insulin resistance cannot be an important pathogenetic factor [114].
Hepatic glucose output is directly related to fasting plasma glucose, supporting the view that the liver plays a major role in fasting hyperglycemia. However, increased hepatic glucose output may not be a primary defect. As mentioned before, increased hepatic glucose output can be explained as a response to enhanced lipolysis, with the primary defect being ascribed to insulin resistance of the adipocyte.
Recently, in order to elucidate the sequence of events, body weight and body composition, insulin secretion, insulin action, and endogenous glucose output were continuously monitored in a longitudinal study over several years in Pima Indians in whom normal glucose tolerance progressed to diabetes [117]. Progression to impaired glucose tolerance was associated with an increase in body weight and fat mass and a decline in both early insulin response to a glucose stimulus and insulin-stimulated glucose disposal. Progression to diabetes was accompanied by progression of these two disorders and, in addition, by an increase in basal endogenous glucose output. Subjects who retained a normal glucose tolerance in spite of weight gain (nonprogressors) were insulin-resistant but improved their early insulin secretion. According to this study, the ability to improve early insulin secretion decides progression to diabetes. Increased endogenous glucose output is a later event in the development of type 2 diabetes [117].
Genes responsible for defects of early insulin secretion and insulin secretory capacity have not yet been identified. However, the familial nature of type 2 diabetes leaves little doubt that they play a role. On the other hand, secretory defects may also be acquired due to glucose toxicity or hyperlipacidemia [118]. Thus, there is evidence for primary genetic and secondary environmental influences on insulin secretion and insulin sensitivity, respectively.
Clinical Picture of Diabetes Mellitus
Acute Symptoms
Mild hyperglycemia usually does not cause symptoms and may not be noticed by the patient, but severe hyperglycemia will always cause clinical symptoms.
People with untreated diabetes develop progressive hyperglycemia. When the renal threshold for plasma glucose of about 7 mmol/l is surpassed, glucose is excreted with the urine. Glucosuria goes along with osmotic diuresis and results in large urine volume, thirst, exsiccosis, and electrolyte disorders. Together with these effects of insulin deficiency, electrolyte imbalance is accentuated by cellular loss and renal excretion of potassium. Protein synthesis is lowered and accelerated proteolysis results in protein loss from muscle and other tissues. Increased amino acid levels in blood may be utilized for energy metabolism and gluconeogenesis. Lipid storage is blocked, while lipolysis is increased. This results in the massive appearance of FFA in blood. They are in part incorporated into lipoproteins, thus inducing hyper- and dyslipidemia. FFA also swamp into the energy metabolism. This process is enhanced by elevated levels of plasma glucagon, which activates the enzyme carnitine-palmitoyltransferase (CPT-1) and the transport of long-chain fatty acids into the mitochondria. Here they compete with glucose for the oxidative chain, thus decreasing glucose oxidation. The supply of FFA is greater than the energy need. The FFA surplus is only degraded to the level of β-hydroxybutyrate and α-ketoglutarate, which may accumulate and cause ketoacidosis.
FFA also stimulate gluconeogenesis and hepatic glucose output, they modulate signal chains (e.g., PI-3 and IRS phosphorylation depressed. PKC activated), and contribute to metabolic insulin resistance (pages 6–8).
These disorders result in the classical symptoms of insulin deficiency: polyuria, thirst, polydipsia, exsiccosis, muscle wasting, loss of lipid stores, weight loss, polyphagia, fatigue, and nausea. At diagnosis, about 1% of the subjects have developed ketoacidosis with hyperventilation and eventual coma.
Type 1 Diabetes
Five phases of type 1 diabetes mellitus may be distinguished.
Prediabetes is characterized by the presence of islet cell autoantibodies in blood serum without metabolic disorders. Clinically important types are antibodies against islet cell cytoplasm (ICA), glutamic acid decarboxylase(LGAD), and tyrosinphosphatase (IA-2) (Table 1.10). Islet cell autoantibodies can often be detected many years before clinical manifestation. Transient presence of antibodies may have no relevance, but persisting antibodies indicate that type 1 diabetes will follow with a probability that increases if more than one autoantibody is detected and if they are present at high titers. In antibody-positive persons they should be monitored once or twice per year. Tests for insulin secretory capacity may have additional predictive value [44].
At manifestation symptoms are more frequent in younger than in older individuals. In young subjects it may be only hours or a few days from the first signs until a serious clinical syndrome develops. In later adulthood, the progression from insulin deficiency to overt clinical diabetes is often retarded [120–122]. The clinical picture of these people may resemble that of type 2 diabetes, but they are islet cell antibody-positive and will usually need insulin during the first year after diagnosis. It can be expected that about 10% of newly diagnosed diabetic subjects originally classified as having type 2 in fact have this form of type 1 diabetes [12]. The term “latent autoimmune diabetes inadults” (LADA) has been used to describe this subgroup.
Table 1.10 Islet cell specific autoantibodies in type 1 diabetes. Prevalence at manifestation
Antibodies to | Prevalence (%) |
|---|---|
Islet cell cytoplasm (ICA, IgICA, ICCA) | 60-90 |
Glutamic acid decarboxylase (GAD) | 70-90 |
IA-2 | 70-90 |
IA-2β | >50% |
Insulin (IAA) | 20-100 |
Proinsulin (PAA) | 10-20 |
BSA | 60-100 |
ICA 69 | 60 |
38-kDa insulin granules | > 30 |
Glucose transporter | 80-100 |
Carboxy peptidase H | 30-50 |
Polar antigen | 30-50 |
52-kDa protein | > 30 |
150-kDa protein | 80-100 |
Islet cell surface (ICSA) | 60-80 |
Adapted from [120]
Frequently the manifestation of type 1 diabetes seems to be precipitated by coincident diseases that increase the insulin requirement, such as infections, pregnancy, hyperthyroidism, glucocorticoid treatment, or severe somatic stress (myocardial infarction, major surgery, etc,).
In about two-thirds of subjects a remission will follow the initiation of therapy. The required insulin dose decreases and metabolism stabilizes due to some recovery of insulin and C-peptide secretion together with improved insulin sensitivity. The remission period can be prolonged by experimental immunomodulatory therapy [123]. However, sooner or later the individual will become C-peptide-negative. After some weeks or months, remission is usually followed by a relapse and the development of irreversible clinical diabetes, which under unfavorable conditions may proceed to end-stage diabetes with chronic complications.
If diabetes mellitus is suspected, the diagnosis should immediately be checked by laboratory tests. If the diagnosis is confirmed, it is advisable to start therapy and normalize the metabolism promptly, because this seems to improve the chances of inducing a remission [124].
Treated type 1 diabetes mellitus is not associated with hypertension, lipid disorders, or obesity. However, this does not rule out their existence at diagnosis or that they may develop later. The further course of the disease is determined by the lability of the metabolism, problems of insulin substitution, glucose monitoring, hypoglycemia, and hyperglycemia. The quality of metabolic control is the main determinant of the prognosis.
Type 2 Diabetes
In the majority of cases the disease begins as a metabolic syndrome. In this early stage most symptoms are reversible. Progression to clinical diabetes is not inevitable. The progress of the blood glucose disorder from impaired fasting glucose or impaired glucose tolerance to overt diabetes may take years. Even when diagnostic criteria are reached, hyperglycemia may not cause the classical symptoms, and glucosuria may be minimal or lacking due to an elevated renal threshold. Other symptoms will often be misinterpreted as a normal attribute of aging. Thus, it may take a couple of years until diabetes is diagnosed.
In contrast to type 1 diabetes mellitus, glucose metabolism in type 2 diabetes mellitus is usually fairly stable. However, treatment is usually more difficult than in type 1 diabetes because it requires life-style changes. The disorder tends to increasing severity, and over the years it becomes more and more difficult to achieve near-normal metabolic control [125]. As in the case of type 1 diabetes, the prognosis of type 2 diabetes depends on the quality of metabolic control. However, in addition to glucose metabolism, the other components of the metabolic syndrome such as obesity, hypertension, and dyslipoproteinemia, and life style are equally important.
 Chronic Complications
The chronic complications of diabetes – mainly microangiopathy, neuropathy, and macroangiopathy – are major problems, because they determine the prognosis and quality of life of the patients. Although the details of their pathogenesis are not fully understood, there is no doubt that the diabetic condition is the major cause. Epidemiological studies have shown that their incidence increases with poor metabolic control [126–132] and can be reduced by lowering HbA1c[127,130,131,133]; however, the beneficial effect of strict metabolic control on macroangiopathy is rarely significant [127,130,133–135]. Many proposals have been put forward to explain “diabetes the risk factor,” which forms a network of potentially pathogenetic mechanisms. Recent articles have covered specific topics and the reader is referred to these publications [136–145]. It is not the aim of this short introduction to add another review.
In addition to insulin deficiency/hyperglycemia. other pathogenic factors such as adverse life style, hypertension, lipid disorders, proteinuria, unfavorable hemorrheology, and activated hemostasis are also involved. These will be mentioned in the context of the various clinical manifestations.
The following section outlines the role of hyperglycemia in the pathogenetic network leading to microangiopathy [146–149].
Introduction to the Pathogenesis of Microangiopathy
Hyperglycemia has three important effects that are to some extent interdependent: nonenzymatic glycation, activation of the polyol pathway, and generation of reactive oxygen species (ROS).
The formation of early glycation endproducts (Schiff base and Amadori products) is reversible, but glycated long-lived molecules like DNA and matrix/basement membrane proteins may undergo irreversible cross-linking and other not yet fully understood complex reactions to form advanced glycation endproducts (AGE).
This process leads to considerable changes in their three-dimensional structure and function. Glycated LDL (low-density lipoproteins) are more atherogenic than nonglycated LDL The charge of matrix proteins may be altered, leading to increased permeability, and basement membrane proteins may become resistant to degradation andincrease in thickness and stiffness. AGE may impair the relaxation of vessels by quenching nitric oxide [150]. Moreover, they favor coagulation and thrombosis and initiate atherosclerosis by stimulating macrophages to express AGE receptors (RAGE) and to release cytokines such as TNF-α. IL-1. and IGF.
The activation of the polyol pathway leads to the accumulation of sorbitol, which is followed by myoinositol depletion and inactivation of Na+-K+-ATPase channels. In addition, the production of fructose and sorbitol, which contribute to the formation of AGE, is increased.
There is much evidence that both advanced glycation endproducts (AGE) and high glucose are able to induce the generation of ROS in various types of vascular cells and that this process plays an important role in the initiation of vascular complications in diabetes. In addition to the autoxidation of glucose, three different mechanisms of ROS production are presently under debate:
1. Activation of a membrane-bound, macrophage-like NADH-oxidase. Activation of NADH-oxidase in endothelial cells and smooth muscle cells has been reported in subjects with hypertension and hypercholesterolemia. AGE and angiotensin II are strong activators of this enzyme in vascular cells.
2. Alternatively, it has been suggested that the electron flux in endothelial nitric oxide synthase (NOS III) becomes uncoupled in diabetes and hyperglycemia. In this uncoupled state the electrons flowing from the reductase domain to the oxygenase domain of the NOS complex are diverted to molecular oxygen rather than to L-arginine. In line with this assumption, production of ROS was prevented in human and rat endothelial cells in the presence of inhibitors of NOS.
3. Recently, Nishigawa et al. [146] demonstrated in cultured bovine aortic endothelial cells that in hyperglycemic conditions the mitochondrial electron flux becomes uncoupled from ATP synthesis, resulting in increased ROS production. ROS production was prevented by various uncouplers of the mitochondrial electron chain and overexpression of the uncoupling protein (UCP-2). The activation of protein kinase C, the polyol pathway, the transcription factor NFkB, and the increased formation of AGE and glucosamine were clearly dependent on the formation of ROS, suggesting that at least in these cultured endothelial cells the formation of ROS is the central, initiating step for the transformation of endothelial cells into an active, prothrombotic state. According to these observations, an accelerated substrate flow from either glucose or fatty acids seems to be the final cause for the generation of ROS and oxidative stress.
Against this background, the great importance of accelerated conversion of glucose to fructose by the so-called sorbitol pathway and the changes in the cellular redox state by these processes is obvious. The conversion of glucose consumes NADPH and leads to increased flow of NADH to mitochondria. Since an important cofactor of glutathione peroxidase is diminished, the regeneration of glutathione is impaired, which may limit the antioxidative capacity of the cells and contribute to the occurrence of oxidative stress in diabetes.
The generation of ROS seems to be the initiating factor for a number of processes known to be relevant to the development of vascular complication:
1. Activation of protein kinase C(PKC). The activation of PKC in cells and tissues that take up glucose independently of insulin is mediated not only by a hyperglycemia-dependent increase in diacylglycerol (DAG), but also by the enhanced formation of ROS. Activation of PKC seems to be a common downstream mechanism to which multiple cellular and functional abnormalities in the diabetic vascular tissue can be attributed, including changes in vascular blood flow, vascular permeability, extracellular matrix components, and cell growth.
2. Activation of redox-sensitive transcription factors by AGE and hyperglycemia. AGE formation has so far mostly been in discussion as a process of protein modification. From recent studies it follows, however, that interactions of AGE-modified proteins with specific AGE receptors serve not only to eliminate AGE proteins, but also to induce signal transaction pathways which lead to the generation of ROS, depletion of cellular antioxidant defense mechanisms (e. g., glutathione, ascorbate) and the activation of redox-sensitive transcription factors such as NFkB [144,151]. The activation of NFkB and presumably also other redox-sensitive transcription factors promotes the expression of a variety of kinins, such as the procoagulant tissue factor, endothelin-1, and the adhesion molecules VCAM-1 (vascular cellular adhesion molecule 1), ICAM-1 (intercellular adhesion molecule 1), and MCP-1 (monocyte chemoattracting protein 1), all of which have been found to be increased in the diabetic state. The concept of AGE-induced oxidative stress which activates transcription factors could explain the concomitant occurrence of oxidative stress and changes in the dynamic endothelial balance from an anticoagulant to a procoagulant state, from vasodilatation to vasoconstriction and impaired microcirculation.
3. Activation of the hexosamine pathway and activation of the transcription factor SP-1. ROS have been shown to inhibit glyceraldehyde 3-P-dehydrogenase. In consequence, more glucose will be metabolized to glutamine 6-phosphate. This molecule has been shown to play a role in the induction of insulin resistance. It also enhances glycosylation and activation of the transcription factor SP-1, which accelerates synthesis of plasminogen activator inhibitor 1 (PAI-1) and transforming growth factor β1 (TGF-β1), both of which contribute to the pathogenesis of vascular complications by changes in the hemostatic balance and remodeling processes of the vessel wall.
4. Quenching of nitric oxide. Oxidative stress seems thereby to initiate a vicious cycle reinforcing the imbalance in the redox state of cells and the generation of ROS. These therefore counterbalance the cytoprotective effects of nitric oxide on microcirculation, on the permeability and adhesiveness of the vessel wall, and growth inhibition of smooth muscle cells.
5. Taken together, ROS activate interrelated processes and mechanisms which play a major role in the development of vascular complications in diabetes. However, it must be borne in mind that the outcome of the processes may vary depending the site affected (large vessels, resistance vessels, capillaries).
Following the metabolic concept of pathogenesis, one would expect that the extracellular changes are ubiquitous systemic disorders and that all insulinindependentcells (for only these are exposed to intracellular hyperglycemia) are affected. However, microangiopathy is clinically evident only in the kidney and the eye, and is thought to play a role in neuropathy. Microangiopathy usually begins with reversible functional disorders and may end with irreversible loss of organ function. For this reason, early detection (screening) and monitoring are of paramount importance.
Retinopathy
Epidemiology
The prevalence of diabetic retinopathy is highest in early-onset insulin-treated diabetic subjects and lowest in late-onset non-insulin-treated diabetic subjects. The prevalence increases with the duration of diabetes. In early-onset insulin-treated subjects proliferative diabetic retinopathy is rarely seen within the first five years of diabetes, but after 15 years it is found in 25% of patients and after 20 years in more than 50%. Beyond 20 years, almost 100% of people with diabetes mellitus will develop diabetic retinopathy [152]. In late-onset diabetes retinopathy may be observed at the time the diabetes is diagnosed, but proliferative diabetic retinopathy is rare. The 10-year incidence and progression rates reflect these trends (Table 1.11). Macular edema is more common in late-onset diabetes [153]. Senilecataracts, which will not be further discussed, appear earlier in life and progress faster than in nondiabetic subjects.
Pathology
Diabetic retinopathy is a disease of the retinal vasculature. In the early stages capillary blood flow is increased. The capillary basement membrane is thickened, its composition and charge are altered, its permeability to blood-borne particles and molecules is increased, and pericytes are lost. This process is related to hyperglycemia [127,130–132] and modified by hypertension [158,159], smoking [160,161], and pregnancy [162–164].
Table 1.11 Ten years cumulative incidence of diabetic retinopathy or progression to proliferative diabetic retinopathy (PDR)
Diabetic group | 10-Year Incidence (%) | 10-Year progression to PDR (%) |
|---|---|---|
Younger-onset taking insulin: Male Female Total |
93 85 89 |
29 31 30 |
Older-onset taking insulin: Male Female Total |
77 80 79 |
25 23 24 |
Older-onset not taking insulin: Male Female Total |
69 65 67 |
7 12 10 |
Data from the Wisconsin Epidemiologic Study of Diabetic Retinopathy [434]
An early morphological sign is the presence of microaneurysms. These have been interpreted as abortive attempts to vascularize ischemic areas. Other early signs are intraretinal (flame-shaped or dotted) hemorrhages and lipoprotein deposits (hard exudates). They are indicative of increased capillary permeability, which could be due to modified LDL, free radical damage of endothelial cells, or AGE formation in the endothelial matrix proteins, which attract platelets and macrophages and stimulate the expression of vascular permeability factor (VPF) and other cytokines. Disruption and fenestrations of the endothelial layer and vascular proliferation may occur. Another important clinical sign of vascular permeability is focal or diffuse macular edema.
A later morphological sign is capillary closure. This may be caused by the activated hemostasis with expression of adhesion molecules in platelets and leukocytes as well as by procoagulatory changes of the endothelium and matrix areas exposed to the blood flow because of endothelial disrupture.
Capillary closure is followed by ischemia, which is a potent trigger of new vessel formation. This process is normally suppressed by collagen IV, but it is stimulated by collagen fragments, fibronectin, and local growth factors such as vascular endothelial growth factor (VEGF; secreted in response to hypoxia), fibroblast growth factor(FGF), and TGF-β. Formation of new vessels may not be restricted to the retina. They may grow into the preretinal space and vitreous and eventually cause retinal detachment. New vessel formation may also occur in the iris, where it causes rubeosis iridis and possibly neovascular glaucoma.
Classification
For the purposes of therapy and prognosis, diabetic retinopathy may be classified according to the Early Treatment Diabetic Retinopathy Study Research Group [165] as follows:
1. Background retinopathy, characterized by microaneurysms, hard exudates, generalized venous dilatation, intraretinal hemorrhages, and occasional cotton wool spots (retinal infarcts). Background diabetic retinopathy does not necessarily progress to more advanced stages.
2. Preproliferative retinopathy, characterized by localized irregularities of venous caliber (beading), which are strong predictors of neovascularization; venous looping and reduplication: multiple (≥ 5) cotton wool spots; and intraretinal microvascular abnormalities (IRMAs—abnormally branched vessels within the retina).
3. Proliferative retinopathy, characterized by abnormal new vessels growing into the preretinal space, vitreous, or, occasionally, on the iris. Bleeding from these vessels, retinal detachment due to contraction of fibrotic structures that develop in the hemorrhages, and neovascular glaucoma may cause impairment of vision.
Another cause of impaired vision is maculopathy due to capillary leakage (edematous, wet maculopathy) or to ischemia (dry maculopathy).
Management
The different classes of diabetic retinopathy require different action depending on the risk of loss of vision. In general, the best primary prevention is near-normal metabolic control, normal blood pressure, and giving up smoking [127,130,158,159,166,167]. In secondary prevention, abrupt normalization of poor metabolic control of long duration should be avoided because of the so-called normoglycemic re-entry phenomenon [168,169]. Dyslipoproteinemia increases the risk of hard exudates, maculopathy [170], and vascular proliferations [171] and should be effectively treated. Guidelines for ophthalmological intervention have been developed (for references see [172–174]). The most important technical methods of treating diabetic retinopathy are photocoagulation and vitreous surgery, which may save useful vision in up to 70% of cases of severe proliferative diabetic retinopathy. A difficult problem is dry (ischemic) maculopathy. Treatments based on improving the microcirculation are still experimental [175].
Any diabetic person requires an ophthalmological checkup at diagnosis and annually thereafter. Background retinopathy should be monitored every 6 months. Referral to the ophthalmologist is indicated soon in the case of preproliferative diabetic retinopathy or maculopathy. Referral is urgent if new vessels develop, particularly if they originate from the optic disk. Immediate referral is indicated if retinal detachment, vitreous hemorrhage, or neovascular glaucoma is suspected.
Nephropathy
Diabetic nephropathy is a microvascular disease of the glomerulus (diabetic glomerulosclerosis). It begins with hyperfiltration followed by proteinuria, hypertension, and progressive renal failure. The pathogenesis and clinical course of diabetic nephropathy are better known in type 1 than in type 2 diabetes. They appear to be similar but not identical.
Epidemiology
The prevalence of microalbuminuria or any more advanced stage of nephropathy in IDDM increases during the first 20 years after diagnosis (or, in children, after puberty) to > 50% and levels off thereafter. During this time only about half of the microalbuminuric subjects will develop macroproteinuria and only a minority will develop end-stage renal disease [176]. The cumulative incidence of persistent macroproteinuria is about 35% in both IDDM and NIDDM. However, endstage renal disease after 30 years of diabetes is more often present in IDDM (>20%) than in NIDDM (10%) [177–179]. About 30–50% of all patients on chronic dialysis have diabetes (which does not imply that the reason is always the diabetes). Since type 2 diabetes is much more frequent than type 1 diabetes, it contributes the majority of these subjects.
The incidence and progression of diabetic nephropathy are related to metabolic control [127,130–133] and blood pressure [158,159]. A threshold phenomenon was postulated [180], but was rejected [181,182]. Mortality is high in subjects with diabetic nephropathy. Microalbuminuria has been identified as a strong predictor of cardiovascular disease.
In proteinuric subjects coronary artery disease is about 15 times more frequent than in diabetic subjects without proteinuria [154], and cardiovascular mortality is increased nine-fold [183,184]. Ten-year survival of subjects with persistent proteinuria used to be only 20-50% [179,185]. Antihypertensive treatment and renal replacement therapy have effectively improved the prognosis. In recent studies, eight-year survival after the onset of persistent proteinuria rose to 70-87% [176,186,187].
Before renal replacement therapy was available, the main cause of death in subjects with proteinuria was uremia. About 25% died from myocardial infarction or stroke. Renal replacement therapy reduced deaths from uremia but increased deaths from cardiovascular causes [188].
Pathology
As in diabetic retinopathy, there is no doubt about the influence of hyperglycemia on the development of diabetic nephropathy. However, the causal relationship is less clear. There is no linear relation between the cumulative incidence of any sign of diabetic nephropathy and the duration of diabetes, and more than half of diabetic subjects never develop such nephropathy [176,189]. Normal kidneys transplanted into diabetic recipients may develop typical lesions, but the rate of development varies and is independent of metabolic control [155]. These observations suggest that hyperglycemia is necessary but not sufficient for the development of diabetic nephropathy. Other important pathogenetic factors are hypertension, protein intake, renal hemodynamics, smoking, and genetics.
The hyperglycemia-related pathogenetic effects discussed on pages 11 and 12 are also found in diabetic nephropathy. In addition, synthesis of the glucosaminoglycan heparan sulfate and glycoproteins is impaired [136]. These molecules contribute to the negative charge of the glomerular capillary membranes and are involved in the selectivity of glomerular filtration, which consequently may be reduced. Hemodynamics are another important pathogenetic factor. The impact of hypertension on diabetic nephropathy has been shown in epidemiological and antihypertensive treatment studies [156–159,190,191]. A significant example of direct jeopardizing of the kidney by hypertension is seen in people with unilateral renal artery stenosis, where only the kidney with the patent artery develops glomerulosclerosis [155].
Evidence for a genetic influence comes from family studies. Siblings of probands with nephropathy develop signs of nephropathy several times more often than do siblings of probands without nephropathy [192,193]. Recently epidemiological studies showed an increased incidence of diabetic nephropathy at level of a protein intake exceeding 20% of total energy [194], suggesting a pathogenetic role of nutritional protein.
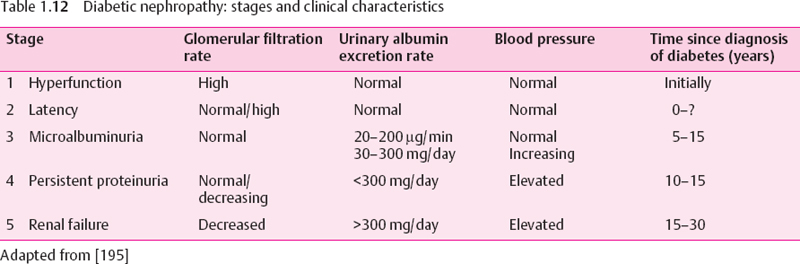
The clinical picture of diabetic nephropathy is dominated by functional disorders, which may be classified according to Mogensen [195] (Table 1.12). The functional disorders correspond to morphological changes. The early increase in glomerular filtration rate has been explained by the ubiquitously increased blood flow and peripheral vasodilation. It correlates to increased kidney size, glomerular volume, and capillary filtration surface area.
Microalbuminuria develops without apparent morphological changes. It seems to be caused by increased glomerular capillary pressure and a loss of negative charge of the glomerular basement membrane. When the pores of this membrane enlarge, filtration selectivity is lost, and (macro-)proteinuria develops. With mesangial expansion due to continuous deposition of indigestible matrix proteins (formation of AGE on collagen, laminin, fibronectin) and thickening of the endothelial layer, vascular obstruction will occur, which results in a decrease of the filtering area. Histological studies show diffuse or nodular glomerulosclerosis [196–198]. In this situation blood pressure increases, glomerular filtration rate decreases, and progressive renal failure with end stage renal disease will develop.
Management
It is essential to detect diabetic nephropathy at a reversible stage. At Mogensen’s stages 1-3 (Table 1.12) the disorders are reversible and renal function may be kept normal if effectively treated. In stages 4 and 5 it may only be possible to delay or possibly halt progression.
The most relevant diagnostic sign is microproteinuria. Microalbuminuria screening should be started not later than five years after diagnosis of type 1 diabetes, and at the time of diagnosis of type 2 diabetes. For correct diagnosis and follow-up monitoring, quantitative determination of albumin in urine collected over precisely measured time periods is essential. An albumin excretion rate (AER) below 30 mg per 24 hours (20 μg/min) is considered normal, whereas an AER above 300 mg per24 hours (200 μg/min) is considered to define macroalbuminuria or proteinuria. In between these two extremes is the range of microalbuminuria. Alternatively, the urinary albumin/creatine ratio may be determined [189].
Prevention and treatment of diabetic nephropathy is based on achieving near-normal metabolic control [127,129–131,199–202], lowering elevated blood pressure to values below 130/80 mmHg [157,158,191], a normal protein intake of 0.8-1.2 g/kg body weight [203,204], cessation of smoking (if applicable), and diagnosis and treatment of nondiabetic renal or urinary tract disease.
In normotensive diabetic subjects ACE inhibitors do not reliably prevent the development of microalbuminuria [205]. In normotensive patients with microalbuminuria, captopril and calcium channel blockers [206–212] retard the progression of nephropathy. In hypertensive subjects both the ACE inhibitor captopril and the β-adrenergic blocker atenolol retard the development of microalbuminuria [158,206]. In hypertensive diabetic subjects with micro- or macroalbuminuria, lowering blood pressure with ACE inhibitors, β-adrenergic blockers, or calcium channel blockers retards the progression of albumin excretion [213–221]. While the UK Prospective Diabetes Study (UKPDS) suggested that blood pressure reduction itself may be more important for nephroprotection than the type of drug used for treatment, recent secondary prevention studies in type 2 diabetic subjects suggest that inhibition of the renin – angiotensin system may be more advantageous than other antihyperintensive therapy. In studies with ACE inhibitors [222] and with angiotensin receptor blockers [223–225] the nephroprotective effect was beyond that attributable to blood pressure control.
Cardiovascular risk is increased at any stage of diabetic nephropathy, and the majority of patients with such nephropathy will die not of uremia but of macrovascular complications [183,184,188,226]. Prevention of these complications is mandatory, and risk factors for macroangiopathy other than hypertension should also be treated.
Diabetic nephropathy is accompanied by lipid disorders which are believed to contribute essentially to the high cardiovascular risk [227]. Treatment of dyslipoproteinemia is mandatory, as are “stop smoking” programs for smokers.
Platelet aggregation inhibition with aspirin is recommended in diabetic patients with albuminuria [228]. Radiopaque media should only be used after careful hydration of the patient [229].
Patients with endstage renal disease will need renal replacement therapy. Chronic hemodialysis, peritoneal dialysis (intraperitoneal, continual ambulatory), and renal transplantation in combination with pancreas transplantation [230] are presently the methods of choice. The prognosis of patients who have undergone transplantation has recently been improved but still is not as good as in non-diabetic subjects [176,187,230].
Almost 100% of patients with endstage renal disease also have diabetic retinopathy and/or diabetic neuropathy. Monitoring and treatment of these complications is equally important.
Macroangiopathy
The term “macroangiopathy” was introduced by Lundbaek [231] to draw attention to the fact that large-vessel disease in diabetes is not just a matter of atherosclerosis occurring in a diabetic subject, but is a facet of diabetic angiopathy as important as microangiopathy. The major clinical complications of macroangiopathy are coronary artery disease, stroke, and amputation. Only coronary artery disease will be discussed in more detail in this chapter.
Epidemiology
Due to the insidious course of macroangiopathy and the difficulties of early diagnosis, reliable population-based data on its incidence and prevalence are lacking. Some epidemiological data on the clinical manifestations are available [232]. The figures for their incidence and prevalence in diabetes depend on their occurrence in the general population to which they belong and differ considerably between countries [233]. However, clinical, epidemiological [154,234–236], and autopsy studies [237,238] and cause-of-death statistics [29,239] agree that the figures are higher in people with type 1 diabetes/IDDM and type 2 diabetes/ NIDDM than in the general population. After 30 years of IDDM, cardiovascular disease accounts for two-thirds of all deaths [21]. Macroangiopathy develops earlier in life and occurs almost independently of gender [154,240]. The increase in risk is higher in women than in men [236,241,242]. Thrombotic complications of macroangiopathy are the leading cause of death in diabetes [29,243–245].
Coronary artery disease is 3.3 times more frequent in diabetic than in nondiabetic people [246]. Myocardial infarction is 3.7 times more frequent in diabetic men and 5.9 times more frequent in diabetic women [242]. In another study [247] the increase was 6.7 times in type 2 and 12.2 times in type 1 diabetic women. The higher risk of women goes along with more atherogenic lipid profiles (see below). The standardized mortality rate (corrected for age and gender) for any heart disease is 9.1 times higher if diabetes mellitus is diagnosed before the age of 30 and 2.3 times higher if it is diagnosed later [248]. As a rough estimate, in western societies about half of diabetic people die of premature cardiac death. Stroke is about twice as frequent as in the general population, and two out of three amputations are performed in diabetic people.
Pathology
The histology of lesions in the arterial wall of diabetic subjects is similar to what is seen in the general population. However, lesions tend to be located in more distal regions of the vasculature. In diabetic subjects, the established sequence of early events in atherogenesis seems to be the same as in nondiabetic subjects:-adhesion of monocytes to endothelial cells, mediated by VCAM-1-penetration of monocytes into the vessel wall, mediated by MCP-1-activation of monocytes to form macrophages/foam cells/fatty streaks, mediated by MCSF (macrophage colony stimulating factor). The classical risk factors of atherosclerosis are also effective in diabetes mellitus [135,154,249–251], and diabetes enhances the impact of these risk factors. Hyperglycemia contributes to the pathogenesis of macroangiopathy. However, the correlation with the duration of diabetes and HbA1c is weak. There must be additional specific risk factors in diabetic people, which are absent or only weakly expressed in non-diabetic people (Table 1.13).
Activated hemostasis seems to play an important role. It results from increased plasma coagulation and decreased fibrinolysis together with a loss of physiological endothelial platelet resistance, increased thrombogenicity of the subendothelial matrix, and platelet activation [138,140,252–255]. The plasma factors involved in hypercoagulation have been summarized by Ceriello [256,257]: increase of plasma fibrinogen, factor VII and VIII, α2-macroglobulin, and PAI-1, decrease of protein C. protein S, and prostacycline, and increase in the activity of factor X, antithrombin III, heparin cofactor II. and von Willebrand factor. Only some of the mechanisms underlying these disorders are known, e.g., the regulation of PAI-1 by TNF-α, insulin. VLDL, AGE, and endothelial injury [258].
Table 1.13 Risk factors of atherosclerosis and diabetic macroangiopathy
Classical risk factors of atherosclerosis | Additional specific risk factors of diabetic macroangiopathy |
|---|---|
Hypertension, systolic and diastolic | Hyperglycemia |
Dyslipidemia | Abnormal lipoproteins |
Obesity | Platelet activation |
Smoking | Endothelial dysfunction |
Stress | Hypercoagulation (increased fibrinogen and PAI-1) |
Physical inactivity | Albuminuria |
Family history of atherosclerosis | Hyperhomocystinemia |
Age | Insulin? |
Previous myocardial infarction | Duration of diabetes? |
Stay updated, free articles. Join our Telegram channel

Full access? Get Clinical Tree


