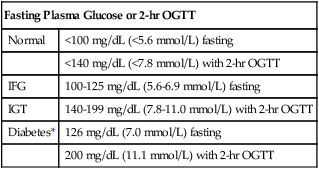
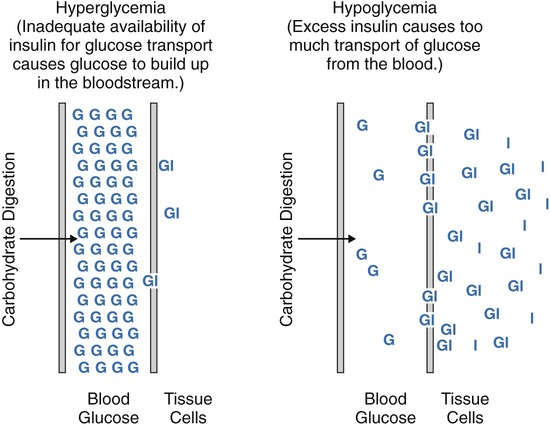
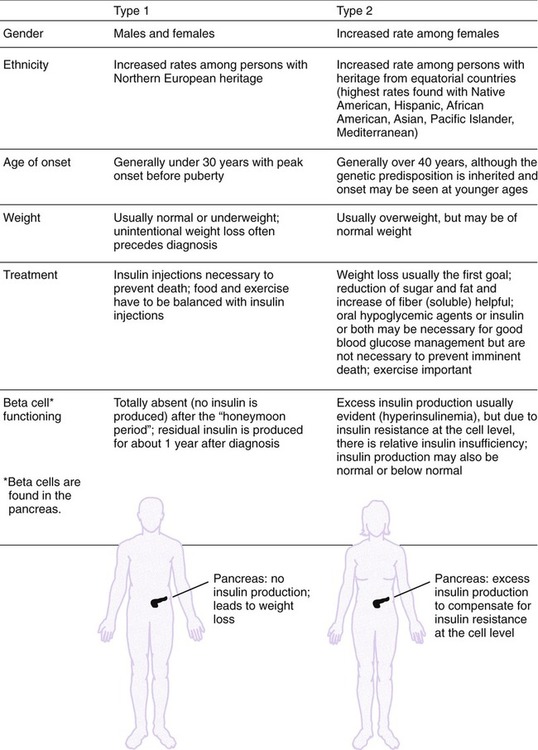
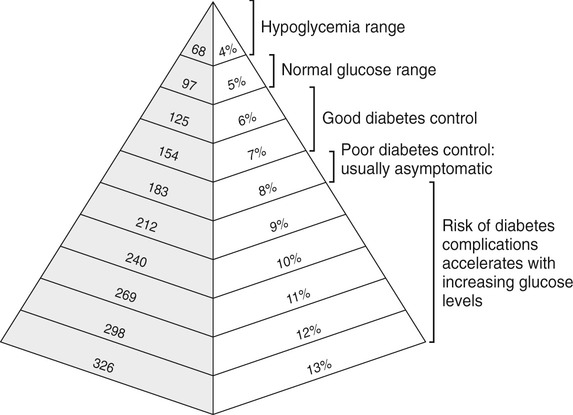
After completing this chapter, you should be able to: • Describe the different types of diabetes mellitus. • Describe the symptoms and clinical findings of diabetes mellitus. • Relate the nutritional management of diabetes mellitus to the 2005 Dietary Guidelines for Americans and the MyPyramid Food Guidance System. • Discuss differences in the nutritional management of the various forms of diabetes. • Describe the importance of the self-monitoring of blood glucose. • Discuss the role and special concerns of exercise in diabetes management. • Discuss the role of health care professionals in facilitating the nutritional aspects of diabetes management. According to the Centers for Disease Control and Prevention, almost 14 million Americans have been diagnosed with diabetes. This is more than twice the number from 1980. Many more have diabetes but don’t know it. An estimated 18 million Americans have diabetes, and 41 million have prediabetes, according to the National Diabetes Education Program. For online resources, see www.ndep.nih.gov. The connection has been made from U.S. Department of Agriculture (USDA) records that as sugar intake increased and fiber intake declined from 1909 to 1997, the incidence of type 2 diabetes followed proportionally (Gross and colleagues, 2004). The current epidemic of type 2 diabetes can be contained. For individuals at risk for developing diabetes, it would be advantageous to alter the environment to more easily incorporate physical activity and increase the availability of high-fiber foods. The person with diabetes is part of the health care team and must feel free to express concerns and personal needs with regard to achieving the goal of normal BG levels. For example, it has been recognized that spirituality is integrally tied with health beliefs among the African American population (Polzer and Miles, 2005). The Latin root of the term diabetes (to pass through) mellitus (sweet) essentially means “sweet urine.” Diabetes, sometimes referred to by the public as “having sugar,” is a serious metabolic disorder related to the use of carbohydrate and its end product, glucose (blood glucose or BG). The metabolism of protein and fat is affected by diabetes as well. Obesity, especially with diabetes, is related to higher turnover of body proteins. Evidence suggests dietary protein requirements may be greater in uncontrolled diabetes, especially in men (Gougeon and colleagues, 2008). In 1997 the American Diabetes Association changed the diagnosis of diabetes to two fasting plasma glucose (FPG) levels greater than or equal to 126 mg/dL (Table 8-1). The threshold was lowered to 126 mg/dL to better help prevent complications associated with diabetes. Screening for type 2 diabetes is important because of its slow and gradual development, which is often asymptomatic because the body appears to adjust to the increasing BG levels. Table 8-1 Diagnostic Thresholds for Diabetes and Lesser Degrees of Impaired Glucose Regulation IFG, Impaired fasting glucose; IGT, impaired glucose tolerance; OGTT, oral glucose tolerance test. *A diagnosis of diabetes needs to be confirmed on a separate day. There are several types of antibodies that are used to indicate type 1 diabetes. The most common test is for the antibody called glutamic acid decarboxylase (GAD antibody). Among middle-age persons, women have been found to have higher GAD antibody levels with more severe loss of beta-cell function than males. Women with high GAD antibodies also tend to have other autoimmune diseases, especially autoimmune thyroid disease (Lindholm, Hallengren, and Agardh, 2004). Evidence of GAD antibodies can take a few years to be detectable after initial symptoms and diagnosis of diabetes (Nagai, Imamura, and Mori, 2005). The peak age of type 1 diabetes onset is during puberty, but it can occur at any age. Winter months are a peak time of onset of type 1 diabetes. It is believed that the body’s exposure to a viral illness can precipitate the development of the autoimmune process in susceptible individuals. One study found at least one gastrointestinal viral infection in over 80% of the children who later developed antibodies related to the destruction of the beta cells (Salminen and colleagues, 2004). More recently vitamin D deficiency has been linked with increased risk of autoimmune diseases, including type 1 diabetes. This may, in part, explain the increased prevalence of type 1 diabetes among persons of Northern European descent and during the winter months with decreased sun exposure. Minnesota has the highest incidence of type 1 diabetes with its strong population with Scandinavian heritage. Persons with type 1 diabetes tend to have few relatives with diabetes but do have the genetic predisposition for its development. Persons with type 1 diabetes often have other forms of autoimmune diseases such as thyroid and celiac disease. A study of a population with Northern Italian heritage found 4% with autoimmune thyroid disease and a high prevalence of celiac disease (Spadaccino and colleagues, 2008). A study in Spain found 8% of individuals with type 1 diabetes had celiac disease. However, although a gluten-free diet had no effect on metabolic control of diabetes or growth of children, the increased risk of lymphoma and osteoporosis suggests screening, especially among persons with type 1 diabetes (Nóvoa and colleagues, 2008). In 1997 the American Diabetes Association proposed two subcategories for type 1 diabetes: type 1A diabetes, with observed autoimmunity, and type 1B, showing no autoimmunity. The latter form of diabetes was found to have variable episodes of insulin deficiency and resulting alterations in insulin requirements with some features of type 2 diabetes (Aguilera and colleagues, 2004). It is perceived in the field of diabetes that there are many variants of diabetes with different classifications and treatments that will one day be better identified. One subtype of type 1 diabetes is now referred to as latent autoimmune diabetes in adults (LADA). It has been found that in Japan there is a significant number of persons with this form of diabetes. A high level of GAD antibodies predicts the development of insulin deficiency (Kawasaki and Eguchi, 2004). The use of the C-peptide test (see Chapter 5) can rule out LADA. An elevated C-peptide level is found with type 2 diabetes. The more expensive testing for GAD antibodies can be done for those suspected of having LADA who have a low or normal C-peptide level (Bell and Ovalle, 2004). However, to establish a differential diagnosis between type 1 (LADA) and type 2 diabetes in older persons, GAD must be measured (Pfutzner and Kerner, 2005). Individual differences in detectable autoimmune factors, along with varying levels of insulin sensitivity can make the diagnosis of type 1 versus type 2 diabetes challenging, even for the most experienced endocrinologist (a physician who specializes in the study of hormones). Although most individuals with type 1 diabetes are sensitive to insulin, there are many who also have insulin resistance (Suehiro and colleagues, 2005). In some persons diagnosed with type 2 diabetes, the presence of GAD antibodies has been noted. These individuals had lower fasting insulin levels and had higher high-density–lipoprotein cholesterol (HDL-C) and lower triglyceride levels, such as found with insulin sensitivity and type 1 diabetes (Zinman and colleagues, 2004). With a positive GAD antibody test result, the diagnosis should change to type 1 diabetes. Without insulin, life cannot exist. In the days before the discovery of injectable insulin, persons with type 1 diabetes simply wasted away from malnourishment. It is for this reason that type 1 diabetes is an insulin-dependent form of diabetes. Control is accomplished only through insulin injection based on carbohydrate intake and BG levels. Persons taking insulin are best advised to consult with certified diabetes educators (CDEs)—health care professionals who specialize in diabetes management and are required to demonstrate continued proficiency or document continuing education in diabetes. Figure 8-1 shows the basic differences between type 1 and type 2 diabetes. Asian Indians have a high rate of diabetes but low rates of obesity. They do, however, have a high waist-to-hip ratio (WHR) with high levels of insulin resistance and hyperinsulinemia. In a study of Italian persons the combined incidence of diabetes and impaired glucose tolerance (IGT) was over 15% for men and 10% for women. The prevalence was greatest in the regions of central and southern Italy (Pilotto and colleagues, 2004). The known incidence of type 2 diabetes in Spain is about 6%, and the combined rate with IGT, 19% (Martinez and colleagues, 2004). In Greece the overall prevalence of diabetes type 2 was about 8% in men and 6% in women (Panagiotakos and colleagues, 2007). Gestational diabetes mellitus (GDM) is a temporary form of diabetes that occurs during the latter part of pregnancy. It is often found in women with a family history of type 2 diabetes and therefore is generally related to the genetic predisposition to insulin resistance. Because it occurs after fetal development (see Chapter 11), the risk for birth defects is different than for a woman who has type 1 or preexisting type 2 diabetes. There is virtually no difference in pregnancy outcomes for a woman who has GDM or type 1 or type 2 diabetes, as compared with a woman without diabetes, if near-normal BG level is achieved before conception and maintained throughout the pregnancy. See Chapter 11 for diagnostic criteria of GDM. Increased placental hormones, produced during the latter stages of pregnancy, that work counter to insulin (see the section on counterregulatory hormones) are the primary cause of GDM. Once the placenta has been expelled at the time of delivery, the woman’s BG is likely to normalize. Because GDM is associated with insulin resistance, there is an increased risk of eventually developing type 2 diabetes (refer to Chapter 5 for a review of prevention). A deficiency of zinc and selenium has been noted with GDM or IGT during pregnancy (Bo and colleagues, 2005). Gestational diabetes mellitus can also be associated with GAD antibodies as found in women with Scandinavian heritage. Arabian women tend to be more insulin resistant than Scandinavian women with GDM, even though the body mass index is the same (Shaat and colleagues, 2004). In reactive hypoglycemia, excess carbohydrate causes the body to produce too much insulin. However, because the overproduction of insulin is delayed, the BG level first rises too high and then falls too quickly (Figure 8-2 shows the difference between hyperglycemia and hypoglycemia). This form of glucose intolerance is felt to be a precursor to the development of type 2 diabetes. Reactive hypoglycemia is characterized by serum glucose levels in the range of 50 to 60 mg/dL, with symptoms of hypoglycemia (Box 8-1) that are relieved by eating. However, many physicians use the criteria that BG levels need to be below 50 mg/dL to make an official diagnosis. Anyone who experiences symptoms of hypoglycemia will usually note increased, almost ravenous hunger that can lead to overeating and weight gain. Regardless of the official diagnosis, the symptoms need to be taken seriously, and the person needs to be advised on how to prevent them (see medical nutrition therapy [MNT] section below). Only then can serious attempts at weight management be undertaken. Persons with hypoglycemia may begin to perspire; they may experience hunger and nervousness; their skin may become pale, cold, and clammy; and they may experience mental confusion, physical tremors, weakness, headache, rapid heartbeat, numbness in the tongue, and double or blurred vision (see Box 8-1). Hypoglycemia also alters mood states. Irritability is well known to occur with the combination of stress and hypoglycemia. Hypoglycemia can result in a severe headache, sometimes referred to as a diabetic headache. A skin condition called acanthosis nigricans (see Figure 5-1) is a risk factor for diabetes. In this condition there is a thickening of the skin, usually in the body folds, which takes on a gray, brown, black, or blue pigmentation. Screening for acanthosis nigricans is an easily performed, noninvasive method for identifying adolescents at risk for type 2 diabetes (see Chapter 5). Testing for ketones is easy using ketonuria strips. A person with type 1 diabetes who notes a very high BG reading or BG level that remains over 240 mg/dL, especially with nausea and vomiting, should check for ketonuria. Women during pregnancy are advised to test ketonuria on awakening (see Chapter 11). A health care professional should be consulted if ketones are found, because increased insulin is generally required. Fluids should be pushed with ketonuria. Increased polyuria can lead to nutritional deficiencies of the water-soluble vitamins. In one study plasma thiamin level was decreased about 75% in persons with diabetes. There was an increased renal clearance of thiamin twenty-fourfold among individuals with type 1 diabetes and sixteenfold in type 2 diabetes (Thornalley and colleagues, 2007). Impaired fasting glucose (IFG) (BG level 100 to 125 mg/dL after an overnight fast; see Table 8-1) is now considered diagnostic of prediabetes. The diagnosis of diabetes mellitus requires two FPG (fasting plasma glucose) readings greater than or equal to 126 mg/dL or any BG level greater than 200 mg/dL with signs and symptoms of diabetes. One concern with IFG is that it is not measuring the postprandial rise in BG level. A 2-hour oral glucose tolerance test (OGTT) with 75 g of carbohydrate may be helpful in preventing the complications related to hyperglycemia. IGT is the diagnosis made if the resulting BG level is between 140 and 199 mg/dL after an OGTT. Prediabetes is found with IGT. A value of 200 mg/dL or higher with an OGTT and symptoms indicates diabetes. In one study of those persons who had normal fasting glucose, almost 15% had either IGT or diabetes as determined by an OGTT (Sargeant and colleagues, 2004). Once the diagnosis is made, the laboratory test called hemoglobin A1c (Hgb A1c or now referred to simply as A1c) should be assessed. Increasingly A1c is being used as a screening test but is not considered confirmation of the diagnosis of prediabetes or diabetes because uniformity of A1c testing varies from laboratory to laboratory. For now, it has been suggested that with IFG and an Hgb A1c value of 6% or higher is indicative of diabetes, and treatment may be appropriate (Jimeno and colleagues, 2004). Most people know that hemoglobin is a component of the red blood cells used to carry oxygen throughout the body. The A1c test measures how much glucose has attached to the protein in the hemoglobin (see Figure 8-3 for correlations between Hgb A1c and average BG level). The A1c is referred to as a 3-month test, because it measures the average BG level 24 hours a day, 7 days a week, for about 3 months. Because hemoglobin has a lifespan of about 3 months, measuring how much protein has attached to it gives an indication of control over the previous 3 months. The goal is to have the A1c less than 7% for good diabetes control; the 5% range is normal. It appears that individuals with average fasting glucose level less than 85 mg/dL, A1c of about 6%, and normal triglyceride levels are significantly less likely to develop diabetes within 5 years than those with average fasting blood glucose level of 100 mg/dL, A1c near 7%, triglyceride level over 170 mg/dL, and low HDL-C average of 55 mg/dL (Schulze and colleagues, 2008). The need for screening for type 2 diabetes has been noted for children as young as 12 years old (Whitaker, Davis, and Lauer, 2004). Persons with a strong family history of diabetes or those with health problems associated with the metabolic syndrome should be screened earlier. Because the incidence of diabetes increases with age, screening should begin by at least age 50 for all persons. Among adolescents and young adults who had type 1 diabetes for 13 years, a mean A1c level of 8.4% was noted with a prevalence of neuropathy of almost 60%, retinopathy was found in about 1 in 4, and nephropathy in 1 in 20 (Nordwall, Hyllienmark, and Ludvigsson, 2006). The DCCT study set the goal of A1c less than 7.2%, but increasingly the goal is routinely in the 6% range, or, if there is no risk of hypoglycemia, a 5% range of A1c to achieve the greatest reduction in diabetes-associated complications. Although all persons with type 1 diabetes are advised to do SMBG, it is also potentially beneficial with type 2 diabetes. One study of SMBG among persons with type 2 diabetes was associated with decreased diabetes-related morbidity and mortality, and this association remained even among those who were not receiving insulin therapy (S Martin and colleagues, 2006). Use of SMBG can allow a person to recognize direct impacts of types of meals on BG outcomes and plan accordingly. Often by using SMBG to determine carbohydrate tolerance in a person with type 2 diabetes, weight loss will result. However, there appears to be less benefit for persons with non–insulin-treated type 2 diabetes who have A1c at target (Schütt and colleagues, 2006). Testing postprandial BG (PPG) level further promotes A1c goals. One study found that almost all persons maintaining PPG level of less than 140 mg/dL achieved A1c of less than 7%, whereas only about two thirds of those achieving fasting BG (FPG) targets of less than 100 mg/dL achieved this target. In the majority of persons, achieving an A1c of less than 6.2% was related to PPG levels. Control of postprandial hyperglycemia is essential for achieving recommended Hgb A1c goals (Woerle and colleagues, 2007). As discussed in Chapter 5, factors found to increase the risk of type 2 diabetes are related to evidence of the metabolic syndrome. Other factors associated with risk for type 2 diabetes include excess weight, physical inactivity, low fiber and high saturated fat and trans fatty acid intake, and either no alcohol or excessive alcohol intake. It is estimated that diabetes can be prevented for the majority of persons at risk with diet and lifestyle changes, including a 5% weight loss for those with excess weight, increased fiber intake, and increased exercise. Following the minimum servings of MyPyramid.gov promotes moderate intake while promoting high nutritional quality and is especially good if they are consumed in several small meals throughout the day. Based on general public health recommendations for diet and exercise, diabetes incidence can be reduced by 58% among persons with prediabetes (Roumen and colleagues, 2008). There is still some controversy regarding the amount of fat in the diet. A 6-month study with up to 45% fat kilocalories but greater than 20% monounsaturated fat had better impact on FBG levels and insulin levels than a low-fat diet with less than 30% fat kcalories. Keeping saturated fat low was important for achieving these goals (Due and colleagues, 2008). Vitamin D deficiency has been implicated in the development of both type 1 and type 2 diabetes. This finding resulted in part from recognition of vitamin D receptors in the pancreas. Maintaining normal plasma calcium levels through adequate vitamin D intake is necessary to regulate beta-cell function and insulin production (Palomer and colleagues, 2008). Elevated intracellular calcium level found with primary hyperparathyroidism induces glucose intolerance via insulin resistance (Yamaguchi and Sugimoto, 2006). A multitude of research has now implicated arsenic toxicity as a causal agent. Insulin resistance and beta-cell dysfunction can be induced by chronic arsenic exposure, which may be responsible for arsenic-induced diabetes mellitus (Tseng, 2004). Many areas in the world have excess arsenic in the water supplies, partly because of mining and agricultural practices. A low magnesium level, both inside the cell and out, is implicated in the development of diabetes. Magnesium plays a key role in promoting cellular uptake of glucose and regulating insulin action (Barbagallo and Dominguez, 2007). Aside from dietary deficiency of magnesium, there also may be an inherited structural defect in the plasma membranes of cells of individuals who have type 2 diabetes and sodium-sensitive essential hypertension. Abnormal accumulation of saturated fatty acids in cell membranes further inhibits the entrance of magnesium into the cell (Wells, 2008). Another explanation of low serum magnesium levels has been linked with excess caffeine. This appears primarily true with acute intake of caffeine pills with ultimate impairment in glucose metabolism. Generally, chronic intake of caffeine exclusively from diet has little effect on glucose metabolism (Du and colleagues, 2007). Uncontrolled celiac disease (refer back to Chapter 4) may have a role in the development of type 1 diabetes. Persons with celiac disease with chronic exposure to gluten have a significantly higher prevalence of anti–islet cell antibodies, found with type 1 diabetes (Verbeke and colleagues, 2004). Type 2 diabetes and the metabolic syndrome in general have been linked with inflammation. Elevated levels of C-reactive protein may be of particular importance in the development of type 2 diabetes in women (Thorand and colleagues, 2007).
Diabetes Mellitus
INTRODUCTION
WHAT ARE THE BASIC FACTS ON PHYSIOLOGY AND TYPES OF DIABETES MELLITUS?
Fasting Plasma Glucose or 2-hr OGTT
Normal
<100 mg/dL (<5.6 mmol/L) fasting
<140 mg/dL (<7.8 mmol/L) with 2-hr OGTT
IFG
100-125 mg/dL (5.6-6.9 mmol/L) fasting
IGT
140-199 mg/dL (7.8-11.0 mmol/L) with 2-hr OGTT
Diabetes*
126 mg/dL (7.0 mmol/L) fasting
200 mg/dL (11.1 mmol/L) with 2-hr OGTT

TYPE 1 DIABETES
TYPE 2 DIABETES
GESTATIONAL DIABETES
WHAT ARE THE SYMPTOMS AND CLINICAL FINDINGS OF DIABETES?
Reactive Hypoglycemia

Acanthosis Nigricans
Ketonuria
Polydipsia and Polyuria
WHAT ARE MEASURES OF GOOD DIABETES MANAGEMENT?
LABORATORY VALUES
Screening Criteria
Monitoring Criteria
Hemoglobin A1c (A1c)
Self-Monitoring of Blood Glucose
WHAT IS THE MEDICAL NUTRITION THERAPY OF DIABETES?
PREVENTION OF DIABETES
![]()
Stay updated, free articles. Join our Telegram channel

Full access? Get Clinical Tree


Oncohema Key
Fastest Oncology & Hematology Insight Engine


 .” Typically a person with type 2 diabetes actually overproduces insulin and has the associated central obesity found with the metabolic syndrome. It is the insulin resistance at the cellular level that can allow both hyperglycemia and hyperinsulinemia. Heredity plays a critical role in the development of type 2 diabetes. Persons with this form of diabetes generally have many family members with a history of diabetes and the other correlates


