Highlights
- •
The hybrid model designed in this study could serve as an alternative tool for noninvasive progression-free survival prediction of ccRCC patients.
- •
The predictive performance of habitat imaging-based hybrid model was superior to the conventional radiomics model with a better C-index (0.79 vs. 0.49) for PFS prediction in the external validation set.
- •
UMOD, CLCNKB, and SLC12A3 were identified as the significant genes which had strong correlation with postoperative progression-free survival by analyzing the RNA sequencing data of ccRCC patients in TCGA.
Abstract
Purpose
To develop and validate a clinicoradiomics model based on intratumoral habitat imaging for preoperatively predicting of progression-free survival (PFS) of clear cell renal cell carcinoma (ccRCC) and analyzing progression-associated genes expression.
Methods
This retrospective study included 691 ccRCC patients from multicenter databases. Entire tumor segmentation was performed with handcrafted process to generate habitat subregions based on a pixel-wise gray-level co-occurrence matrix analysis. Cox regression models for PFS prediction were constructed using conventional volumetric radiomics features (Radiomics), habitat subregions-derived radiomics (Rad-Habitat), and an integration of habitat radiomics and clinical characteristics (Hybrid Cox). Training ( n = 393) and internal validation ( n = 118) was performed in a Nanjing cohort, external validation was performed in a Wuhan and Zhejiang cohort ( n = 227) and in a TCGA-KIRC ( n =71) with imaging-genomic correlation. Statistical analysis included the area-under-ROC curve analysis, C-index, decision curve analysis (DCA) and Kaplan-Meier survival analysis.
Results
Hybrid Cox model resulted in a C-index of 0.83 (95% CI, 0.73–0.93) in internal validation and 0.79 (95% CI, 0.74–0.84) in external validation for PFS prediction, higher than Radiomics and Rad-Habitat model. Patients stratified by Hybrid Cox model presented with significant difference survivals between high-risk and low-risk group in 3 data sets (all P < 0.001 at Log-rank test). TCGA-KIRC data analysis revealed 37 upregulated and 81 downregulated genes associated with habitat imaging features of ccRCC. Differentially expressed genes likely play critical roles in protein and mineral metabolism, immune defense, and cellular polarity maintenance.
Introduction
Clear cell renal cell carcinoma (ccRCC) represents the most prevalent histological subtype of renal cell carcinoma, contributing to approximately 60% to 85% of all renal cell carcinomas [ , ]. Compared to chromophobe and papillary cell renal carcinoma subtypes, ccRCC presents a more malignant profile and is associated with a poorer prognosis [ , ]. Despite most ccRCC patients being temporarily cured through surgery, nearly 15% of these patients suffer from postoperative recurrence or distant metastasis. Tragically, the 5-year survival rate of recurrent ccRCC patients stands at a measly 10% [ , ].
Intratumoral heterogeneity refers to the fact that during the growth process of a tumor, after multiple division and proliferation, its daughter cells show molecular biological or genetic changes, resulting in genetic variation and phenotypic related characteristics differences among different regions of the tumor [ ]. Spatial heterogeneity within tumors is regarded as a primary driving factor that culminates in varying degrees of chemotherapy-induced adaptive resistance in patients, a condition that is intimately affiliated with postoperative tumor development and reduced patient survival rates [ ].
Radiomics involves the extraction of high-throughput features from images to quantify tumor lesions, as well as the potential correlation of these features with clinically relevant characteristics through machine learning methods. Conventional radiomics studies take the entire tumor area as the region of interest, providing information about the cancer phenotype and tumor microenvironment. Although this method can measure intratumoral heterogeneity to a certain degree, the features extracted by this method tend to ignore the phenotypic variation of different regions within the tumor due to harmonious interregional fusion within the tumor [ ]. Xie et al. first attempted to use subregion-based radiomics analysis to predict the survival of patients with esophageal cancer who received simultaneous chemoradiotherapy. They fully considered the impact of intratumoral heterogeneity on radiomics analysis and better quantified tumor subregions that were more related to tumor growth or invasion [ ]. However, the overall postoperative recurrence rate of ccRCC is relatively low in comparison to other highly aggressive tumors. In addition, due to high intratumoral heterogeneity, the postsurgical outcome of ccRCC is different in individual patients [ ]. Hence, how to accurately evaluate the prognostic outcome of individual ccRCC patient before surgery remains a great challenge.
The aim of this study was to develop and validate a clinicoradiomics model for preoperatively predicting of progression-free survival (PFS) of ccRCC and analyzing progression-associated genes expression based on intratumoral habitat imaging.
Material and methods
Study cohort
We retrospectively collected data from 620 patients with ccRCC through postoperative pathology in 3 medical centers which were utilized for model training and validation. The exclusion criteria included: 1) Patients who did not undergo a contrast-enhanced CT (CECT) examination within 4 weeks prior to the surgery; 2) The image quality was poor or the lesion was not visible or too small to be divided on arterial CT images; 3) Patients who did not have a 5-year follow-up or who missed the follow-up. In addition, to revel the association of habitat imaging features with genomic phenotypes, RNA sequencing data from the Cancer Genome Atlas (TCGA)-KIRC cohort ( n = 71) were included for radio-genomic correlation. This multicenter, retrospective study was in compliance with the Declaration of Helsinki and had received approval from local Institutional Ethics Review Board (grant 2022-SR-408). Patient’s clinical information was retrieved from the Hospital Information System (HIS). Utilizing a stratified random sampling method, we divided the data from Nanjing cohort ( n = 393) into a training set ( n = 275) and a test set ( n = 118) maintaining a ratio of 7:3. Data from Wuhan and Zhejiang cohorts ( n = 227) were combined for external validation. Details of patient admission criteria are detailed in Fig. 1 A .
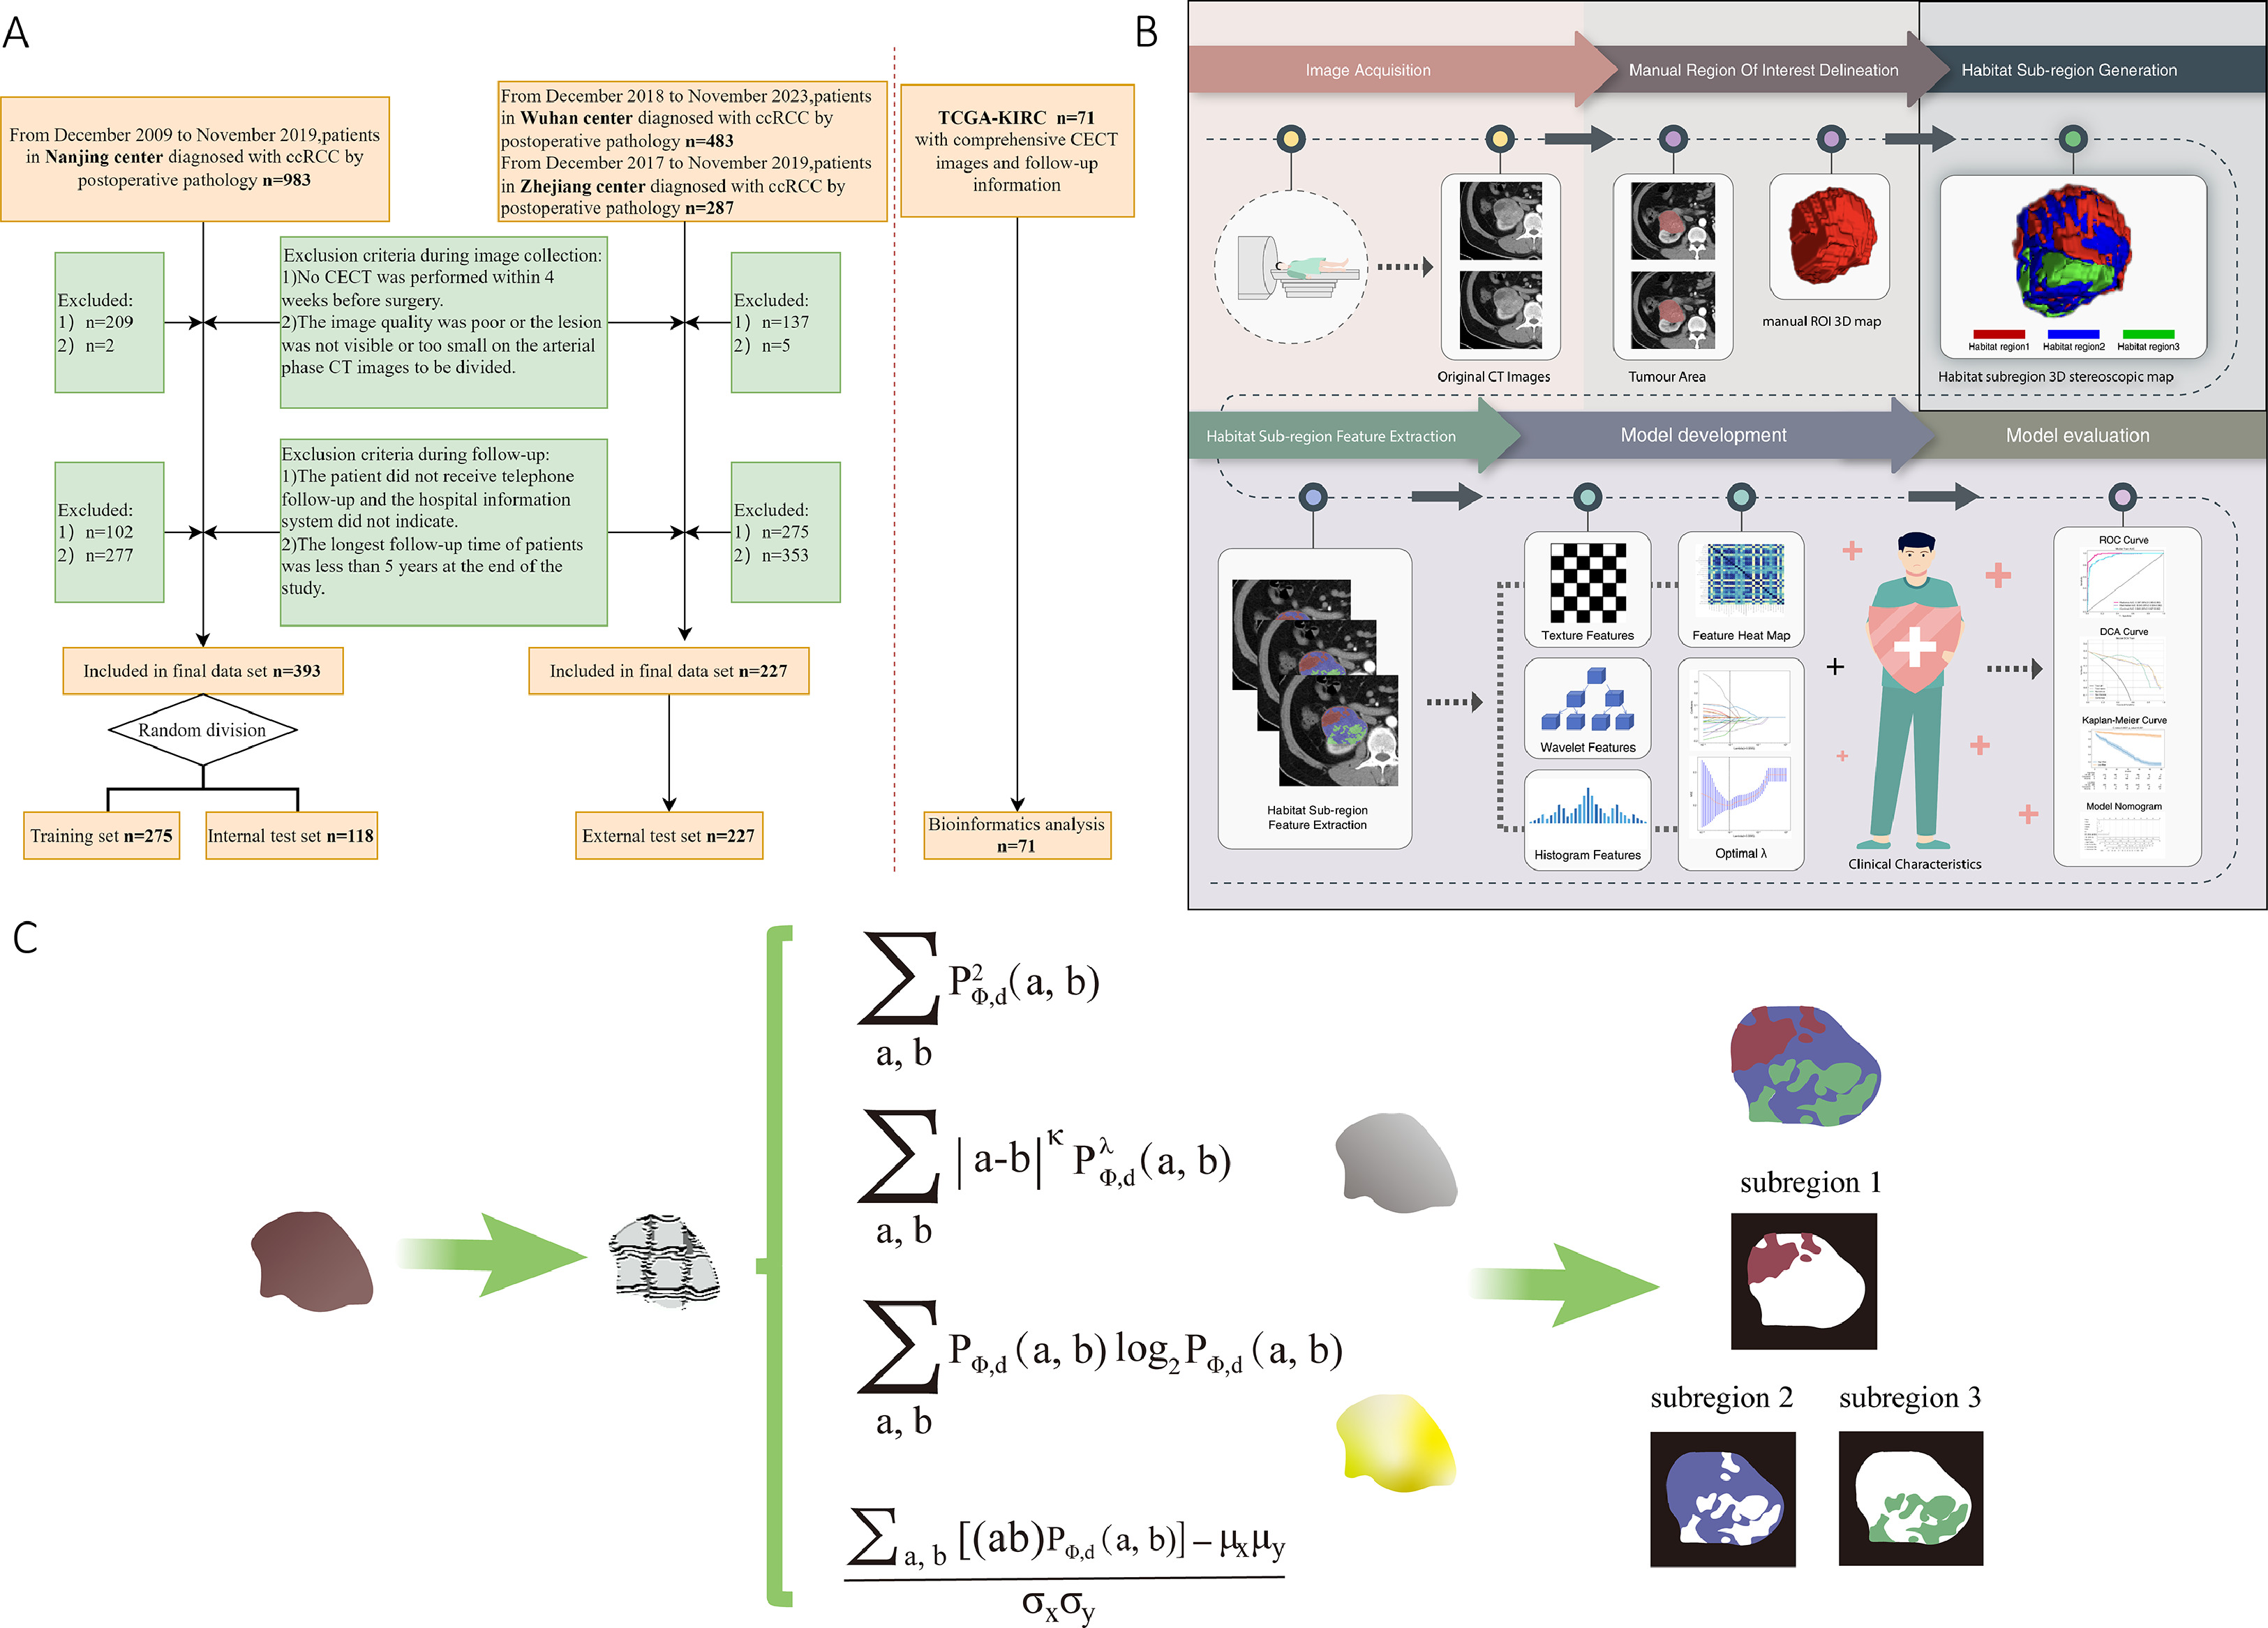
Image acquisition
A CT scan was performed with patients by using multidetector CT scanners (Siemens SOMATOM Definition AS 128 CT, TOSHIBA Aquilion/ONE 320 CT, GE Discovery CT750 HD). The scanned range covered both kidneys and any detectable masses, with the patients being in supine position during a breath-holding scan. The scanning parameters were: tube voltage at 120 kV, tube current ranging from 150 to 320 mA, slice thickness and layer spacing both set at 5 mm, field of view at 360 mm, and a matrix of 512 × 512.
Following the noncontrast phase (NCP) scan, the contrast agent was injected into the anterior cubital vein using a high-pressure injector. This was at a dose of 1.5 ml/kg and an injection rate of 2.5 ml/s. Cortical and medullary scans were performed automatically 10 seconds after the CT value of the abdominal aorta reached the preset trigger attenuation threshold of 100 HU. Following the cortical and medullary phase, renal parenchymal scanning was commenced, with a delay of 40 seconds.
Patient management and follow-up
All patients included into the study underwent the surgical treatments, in which, 413 were the partial nephrectomy, 188 were radical nephrectomy, and 19 of whose surgical approach is not available. All surgical specimens in each center were prepared and examined by institution uropathologists according to the seventh ver. (before 2017) or eighth ver. (after 2017) AJCC staging system of renal cell tumors [ ]. The tumor size, Furhman nuclear grade, surgical margin, pathological stage, vascular and lymphatic invasion were indicated per usual protocol according to expert consensus or guidelines at each institution.
Upon surgical intervention, patients were monitored according to their postoperative pathological T stage. Patients in stages T1 to T2 were reviewed every 6 months, while those in stages T3 to T4 had quarterly follow-ups. The maximum follow-up duration was set at 5 years for all patients. We obtained patients’ follow-up information through the HIS and telephone interviews, including imaging and physical examination results. The primary endpoint, i.e., PFS, was defined as the time interval ranging from the date of surgery to the detection of disease progression. In case of patients who died from causes other than the specific disease or did not manifest disease progression, the timeframe was considered from the date of surgery to the date of the last follow-up. Baseline clinical characteristics including age, sex, bad habits (smoking, and alcohol drinking), and underlying diseases (hypertension, diabetes, hyperlipidemia and coronary heart disease) were also included into the multimodal analysis. The entire workflow of the study is illustrated in Fig. 1 B .
Image segmentation
Two juniors (S.S. and Q.L. with 3 and 5 years of experience in abdominal radiology, respectively) were tasked without prior knowledge of the pathological findings for the lesion segmentation. They used the domestically developed software-SRhythm Muti Label and Oncology Imaging Analysis (Oncology Imaging Analysis v2; Shanghai Key Laboratory of MRI, ECNU, Shanghai, China) to delineate focal edges layer-by-layer on axial arterial-phase CT images and subsequently fused these into a 3D volumetric region of interest (VOI). All sketches abovementioned were then calibrated by a senior radiologist (Y.D.Z.) with 15 years of experience in abdominal radiology.
Habitat subregions generation
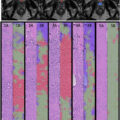
In order to objectively delineate the intratumoral subregions of the lesion, 5 parameters (Contrast, Difference Entropy, Joint Energy, Joint Entropy, and Correlationy) based gray-level co-occurrence matrix (GLCM) were fixed to calculate pixel-wise images covering entire tumor volume for the generation of habitat subregions. According to the local features of each pixel, the pixels in the tumor region were clustered, and the best number of clusters was fixed to 3 [ ], which led to maximum stability and repeatability. The clustering algorithm was a Gaussian mixture model, and different color labels were assigned to each cluster to generate a cluster label graph, which visually represented the global distribution pattern of the intratumoral habitat subregions. The detailed analyzing algorithm for the generation of habitat subregions are descripted in Fig. 1 C.
Feature extraction and data preprocessing
The PyRadiomics third-party library ( Version 2.7.7, Python 3.7 ) was employed for the extraction of radiomics features from the manually delineated mask from general VOI and habitat subregions. When extracting features, resampling voxel spacing was set at 3-mm, bin width at 5, and normalized scale at 1000. A total of 8 filters including Wavelet, LoG, Gradient, LocalBinaryPattern-3D, Exponential, Square, Square Root and Logarithm, were used to extract original and filtered features for analysis. A comprehensive set of 1,561 features was extracted and subdivided into several feature categories: 306 first-order features, 14 shape features, 374 features from GLCM, 272 features from the gray-level size zone matrix (GLSZM), 272 features from the gray-level run length matrix (GLRLM), 82 features from the neighboring gray-tone differencematrix (NGTDM), and 238 features from the gray-level dependence matrix(GLDM).
Feature reduction and model construction
In order to extract the radiomics features with good reproducibility and low redundancy, independent sample T test was first performed on the radiomics features, and the features with a P -value > 0.05 were removed. Secondly, for features with high repeatability, the Pearson correlation coefficient was calculated to express the relationship between the features, and one of any pair of features with a correlation coefficient greater than 0.9 was retained. Finally, using the least absolute shrinkage and selection operator(LASSO) algorithm, stable radiomics features were incorporated into LASSO regression analysis by constructing a penalty function λ to shrink some regression coefficients in purpose of forcing some features to zero. Ten-fold cross validation was performed to determine the best λ value based on the minimum value criteria. According to the model corresponding to the optimum λ value, the radiomics features with nonzero coefficients were screened. Thus, independent and stable radiomics features were obtained. All filtered features were normalized using the Z-score method, and the mean and variance of each column features were calculated. Each column of features was converted to a standard normal distribution by subtracting the mean and dividing the variance. Finally, according to the features selected by LASSO regression algorithm and their corresponding coefficients, the bar chart of feature coefficients weas drawn to evaluate the importance of each feature. After feature fusion and filtering, we used scikit-learn machine learning library to construct machine learning classification model. Synthetic minority over-sampling technique (SMOTE) was used to synthesize a few kinds of data for positive and negative sample balance when training the model. Machine learning classification models included Logistic Regression (LR), Support Vector Machine (SVM), Decision Tree (DT), Random Forest (RF), Extreme Randomized Tree (ExtraTree), Extreme Gradient Boosting (XGBoost), Multi-Layer Perceptron (MLP) and LightGBM(Light Gradient Boosting Machine). In order to reduce overfitting, a 5-fold cross validation was performed to select the best parameter for the classification model in the training sequence. The receiver operating characteristic curve (ROC) was plotted and the area under the curve (AUC) was calculated. In particular, the optimal prediction model established by extracting features from whole-tumor based region was denoted as conventional radiomics model (Radiomics), and the optimal prediction model established by extracting features from intratumoral habitat subregions was denoted as habitat radiomic model (Rad-Habitat). Univariate and multivariate logistic regression analyses were performed for clinical characteristics to identify risk factors associated with postoperative progression. Compared with the modeling results of conventional radiomics and habitat radiomics, the optimal model output was selected as the radiomics signature. A multivariate Cox hybrid model was established to analyze postoperative PFS by combining clinically relevant risk factors and habitat radiomics signatures, and a nomogram was constructed to visualize the model for clinical use.
Bioinformatics analysis-biologic functions exploring
The contrast-enhanced CT images of each ccRCC patient in TCGA-KIRC were imported into the habitat radiomics model for external validation. After extracting the habitat features and obtaining the corresponding coefficients of each patient’s respective lesion, we calculated the Rad-sig of each patient. Among them, a Rad-sig greater than 0.5 was defined as a high risk for disease progression. Conversely, it was assigned to low-risk group. In addition, transcriptomic data of TCGA-KIRC was extracted from TCGA database. Differential gene expression between 2 the groups (low-risk and high-risk) was identified using the DESeq2 package, setting the threshold for significance at an adjusted P -value of less than 0.05 and an absolute log2 fold change greater than 1. Subsequently, the “cluster Profiler” R package was employed to perform Gene Ontology (GO) and Kyoto Encyclopedia of Genes and Genomes (KEGG) pathway analyses on these differential genes to identify affected biological processes and signaling pathways. Significance and expression differences were visualized using bubble charts. Additionally, the protein-protein interaction (PPI) network of differential genes was constructed using tools from the STRING database, and key genes within the network were identified using the Cytoscape software with the cytoHubba plugin. Finally, Gene Set Variation Analysis (GSVA) was conducted to estimate the enrichment of cell-type specific gene sets for each immune cell type in each sample, and to assess differences among groups.
Statistical analysis
Continuous variables were presented as median and IQR (interquartile range), whereas categorical variables were described in terms of counts ( n ) and percentages (%). Continuous data with normal distribution was analyzed using independent sample T-tests, while classified data distributions between groups were compared using Chi-square tests. The performance of the classification model was assessed by constructing ROC curves and calculating the AUCs. Concurrently, the concordance index (C-index) was implemented to differentiate the performance of the 2 individual radiomics model and the multivariate Cox proportional hazards model. An increased C-index value indicated a more precise prediction for postoperative PFS.
In order to quantify the net benefit under a variety of threshold probabilities, decision curve analysis (DCA) was employed to evaluate the clinical utility of our model. Kaplan-Meier curves were charted for patients classified into the high- and low-risk group, with the Log-rank test facilitating the comparison of PFS curves between these 2 groups. All statistical tests were 2-tailed tests. A P -value of less than 0.05 was deemed statistically significant, with a confidence interval (CI) of 95%. Statistical analyses and modeling were performed with Python ( version 2.7.7; https://www.python.org ) and R software ( version 4.1.0 ).
Results
Baseline characteristics
A total of 691 patients with ccRCC from 4 cohorts were included into the study, with ages ranging from 21 to 86 years, and an average age of 54.6 ± 13.3 years. The overall 5-year PFS rate for all patients was 87%. Table 1 summarized the demographic and clinical characteristics of the patient cohorts. Clinically relevant risk factors identified through univariate and multivariate logistic regression analyses were presented in Table 2 .
| Characteristics | Training Set n = 275 | Internal Validation Set n = 118 | External Validation Set n = 227 | TCGA Set n = 71 |
|---|---|---|---|---|
| Patient demographics | ||||
| Age (y) a | 55 (17.5) | 54 (17.0) | 55 (14.5) | 63 (17.5) |
| Gender (male) | 188 (68.36) | 73 (61.86) | 149 (65.93) | 46 (64.79) |
| Bad Habits (present) | 39 (14.18) | 27 (22.88) | 65 (28.76) | NA |
| Underlying Diseases (present) | 151 (54.91) | 63 (53.39) | 80 (35.40) | NA |
| Postoperative no-progression time≤5 years | 72 (26.18) | 21 (17.80) | 65 (28.63) | 15 (21.13) |
| Clinical parameters | ||||
| Pathological T Staging (T1-2) | 246 (89.45) | 102 (86.44) | 206 (91.15) | 43 (60.56) |
| WHO/ISUP Grading (III&IV) | 19 (6.91) | 7 (5.93) | 82 (36.28) | 45 (63.38) |
| M1 before operation (present) | 12 (4.36) | 5 (4.24) | 7 (3.10) | NA |
| Pathological features | ||||
| RVAI (present) | 7 (2.55) | 5 (4.24) | 6 (2.65) | 26 (36.62) |
| IRSH (present) | 78 (28.36) | 30 (25.42) | 105 (46.46) | NA |
| ECE (present) | 33 (12.00) | 15 (12.71) | 87 (38.50) | 28 (39.44) |
| N (+) (present) | 6 (2.18) | 1 (0.85) | 2 (0.88) | 2 (2.82) |
| D Max (cm) a | 3.50 (2.050) | 3.00 (2.075) | 4.53 (2.960) | 5.50 (4.400) |
| Calcification (present) | 16 (5.82) | 7 (5.93) | 47 (20.80) | NA |
| Sarcomatoid feature (present) | 3 (1.09) | 0 (0.00) | 2 (0.88) | 4 (5.63) |
| Cystic dengeneration (present) | 26 (9.45) | 8 (6.78) | 30 (13.27) | 10 (14.08) |
Related posts:
 A systematic review of family history, race/ethnicity, and genetic risk on prostate cancer detection and outcomes: Considerations in PSA-based screening
 Prostate-specific antigen screening for prostate cancer: Diagnostic performance, clinical thresholds, and strategies for refinement
 Neoadjuvant chemotherapy before radical cystectomy in patients with organ-confined and non-organ-confined urothelial carcinoma
Comparison of outcomes between single-port and multiport retroperitoneal robotic partial nephrectomy
Neoadjuvant chemotherapy before radical cystectomy in patients with organ-confined and non-organ-confined urothelial carcinoma
Comparison of outcomes between single-port and multiport retroperitoneal robotic partial nephrectomy
 Prevalence and management of castration-resistant prostate cancer of unknown metastatic status in the real-world setting: The AfroDiTA study
 Intraoperative margin assessment with near real time pathology during partial gland ablation of prostate cancer: A feasibility study
Stay updated, free articles. Join our Telegram channel

Full access? Get Clinical Tree


