Demography and Epidemiology: Introduction
Over the past century, there have been truly remarkable changes in the numbers and characteristics of older persons throughout the world. The growth of the older population has resulted from a general increase in the overall population size but has been particularly affected by major declines in several of the leading causes of mortality. The increased survival of older persons has also been accompanied by declining birth rates; so the proportion of the population aged 65 years and older has increased dramatically and will continue to increase for the next 50 years. These demographic transformations have an effect on society that reverberates well beyond the increased medical care needs associated with an older population.
As more people live to advanced old age, it is important to gain a greater understanding of more than just the individual diseases that affect them. It is critical to appreciate the global picture of older persons who may have multiple chronic conditions, decrements in functional abilities, and social and psychological problems that may have an impact on many facets of their health and quality of life. In contrast to the previous stereotype, older people become more heterogeneous, not more alike, as they age, and understanding this process is a key challenge of geriatric medicine. Adding to the clinical perspective on single patients or small samples of patients, geriatric epidemiology has provided a useful tool with which to approach these challenges by studying representative populations of older persons. Going beyond the demographic focus of counting and projecting the number of older people in the population, epidemiology has made additional contributions to our understanding of the health status and functional trajectory of the older population. Since the 1980s, epidemiologic researchers either have utilized previously initiated cohort studies that include persons who have aged during the study or have begun new cohorts focusing on older people. These epidemiologic studies have assessed the distribution and determinants of specific diseases and have evaluated issues of relevance to an aging population, such as quality of life, geriatric syndromes, comorbidity, functional status, and end-of-life issues. Many of the chapters in this book refer to epidemiologic research on specific diseases and conditions. This chapter focuses on the more general or “geriatric” outcomes, particularly disability, that have also been the subject of much epidemiologic investigation.
The chapter begins by documenting the rapid growth and impressive increases in the number of older persons in the United States and other countries. It then examines improvements in survival and life expectancy. Selected demographic characteristics are then considered, including living situation and labor force participation across many developed countries.
The second section, on mortality, depicts current causes of death in the older population in the United States and considers the change in death rates with increasing age. Data on overall and disease-specific changes in mortality rates from 1950 through 2004 show the dramatic changes in these rates. The third section addresses chronic disease in the older population by using data from national surveys on self-reporting of chronic conditions, ambulatory medical visits, and hospital discharges. Data are then presented for two conditions, cancer and dementia, as examples of conditions where the use of only mortality data would provide an incomplete picture. The fourth section presents epidemiologic data on disability in older persons. This section describes the prevalence of disability, its causes and consequences, individual transitions in functional status, population changes in disability prevalence, and measurement issues. Finally, the chapter provides a description of important behavioral risk factors for chronic disease, injury, and disability and the prevalence rates of these risk factors in the older population.
Demographics
One-hundred-fifty years of aging in America are summarized in Table 5-1, beginning with 1900 and including projections till 2050. This table demonstrates how the older population has grown, as well as how the oldest segment of the older population has grown even more rapidly. In 1900, only 4.1% of the 76 million persons in the United States were aged 65 years and older, and among those in this age group only 3.2% were aged 85 years and older. By 1950, more than 8% of the total population was aged 65 years and older, and by 2000, this percentage had increased to 12.6%. The U.S. Census Bureau creates several alternative mortality scenarios when developing population projections, and according to their middle mortality assumption, there will be 82 million persons aged 65 years and older in the United States in 2050. If mortality declines faster than projected under this assumption, the number of older people will be even higher. In 2050, one in five Americans will be aged 65 years or older. The growth of the 85 years and older population, termed by some the oldest old, will be even more dramatic. By 2050, when the current baby boom generation will be in this age group, it is projected that over 19 million persons, representing nearly a quarter of all persons aged 65 years and older, will be 85 years and older. There will be more than four times as many people in the 85 years and older age group as there are now, and almost 200 times as many as there were in 1900. Thus, the number of older people is rising dramatically; the proportion of the total population aged 65 years and older is increasing; and the older population itself is getting older, with increasing proportions in the 85 years and older subgroup.
≥65 YEARS | ≥85 YEARS | ||||
|---|---|---|---|---|---|
TOTAL POPULATION (ALL AGES) | Number | % of Total | Number | % of ≥65 | |
1900 | 76.1 | 3.1 | 4.1 | 0.1 | 3.2 |
1950 | 152.3 | 12.3 | 8.2 | 0.6 | 4.9 |
2000 | 276.1 | 34.9 | 12.6 | 4.4 | 12.6 |
2050 | 403.7 | 82.0 | 20.3 | 19.4 | 23.7 |
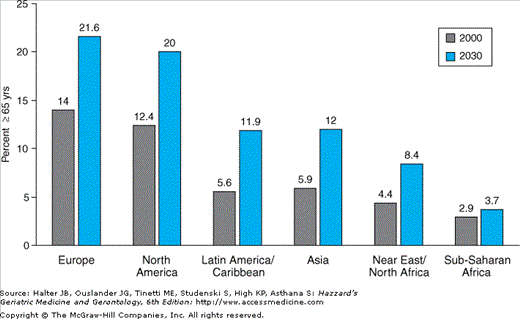
Population aging is taking place throughout the world. Figure 5-1 presents data on the current and projected percentage of the population aged 65 years and older for six regions of the world. Change in the proportion of a population that is elderly depends on changes both in the survival of older persons and in the birthrate. Improved survival at older ages and a low birthrate have resulted in European countries having the oldest populations in the world. In fact, the Population Research Bureau estimates that of the world’s 25 countries with the oldest populations (not including small island countries), 24 are in Europe. Italy and Germany are estimated to have the oldest populations in Europe and the second and third oldest in the world at approximately 19% each. Sometime around 2004, Japan surpassed Italy to become the oldest major country in the world, with 20% of its population being 65 years or older. Japan remains the only major country not in Europe on the list of the oldest 25 populations. Considering countries of all sizes, the tiny country of Monaco surpasses Japan to become the country with the highest proportion of the population aged 65 years and older, at approximately 22%. Europe will continue to have the oldest populations in the world in the twenty-first century, with almost one in four Europeans projected to be aged 65 years or older by 2030. The current percentage aged 65 years and older in Latin America, the Caribbean, Asia, the Near East, and North Africa is low, ranging from about 4% to 6%. However, growth of the older population will be rapid in these countries, and it is projected that in 2030, the proportion of the population in this age range will double. Sub-Saharan Africa has few older persons, and it is expected that the percentage of older people in the general population will not grow substantially in the future.
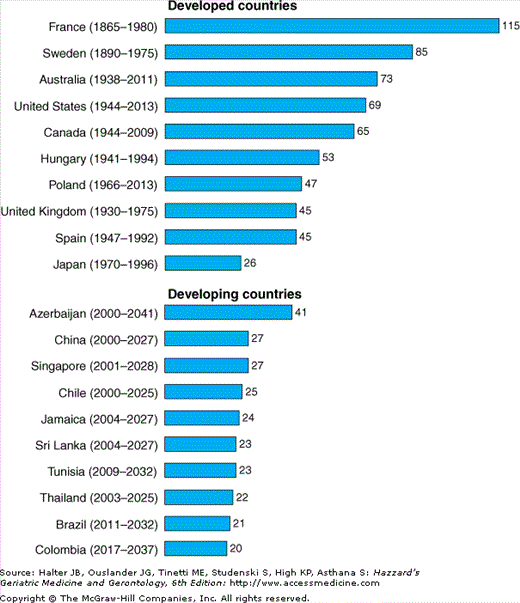
Populations have aged at different speeds and during different time periods throughout the world. Figure 5-2 shows the number of years it took, or is projected to take, for specific countries to progress from having 7% of the population aged 65 years and older to having 14% of the population in this age range. The United States is expected to reach 14% in 2013 and will have taken 69 years to make the transition. Sweden and the United Kingdom reached the 14% level in 1975, with Sweden taking 85 years to go from 7% to 14% and the United Kingdom taking about half that time. Japan has already reached the 14% mark and took only 26 years to do so.
Figure 5-2.
Speed of aging: number of years and time period in which percent of population aged 65 and over doubled or will double from 7% to 14%. Reprinted with permission from Kinsella K, Velkoff VA. An Aging World: 2001. U.S. Census Bureau, Series P95/01–1. Washington, DC: US Government Printing Office; 2001.
A particularly clear message about the speed of aging in developing countries is presented in Figure 5-2. Although the developing countries shown will generally not reach the 14% mark until the third decade of this century, they will have spent less than 27 years making the transition. The rapid aging of these countries will certainly have a large societal impact, with less ability to adapt than in countries that have aged more slowly.
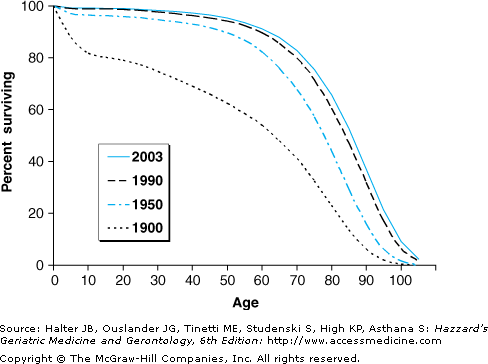
Better survival at all ages has had a major impact on the size and age distribution of the older population. Figure 5-3 depicts survival curves for the total U.S. population over the course of the twentieth century and into the twenty-first century. In 1900, there was substantial mortality in infancy and early childhood, with the survival curve in midlife being somewhat steeper than at the end of the twentieth century. By 1950, a large proportion of early-life mortality had been removed, although survival in this age range was still improving by the end of the century. By 1990, a large proportion of persons were living to age 60 years, and only at age 70 years did the survival curve start to fall rapidly. The survival curve continued to shift to the right through 2003. The change observed in the shape of survival curves has been termed the rectangularization of survival, and it has been proposed that at some point in time full rectangularization will be reached, with no further increases in life expectancy. When this will occur is not yet clear, but the U.S. Census Bureau and Social Security Administration are projecting continued increases in survival for at least the next 50 years.
Life expectancy at age x is defined as the average number of years remaining to be lived by a member of a survivorship group who is exactly age x. Most life expectancy estimates use current life tables, meaning that they use the age-specific mortality experience of the current population. With this approach, life expectancy at birth gives an estimate of the average length of life of a cohort of children who are born now and then experience today’s age-specific mortality rates as they proceed through life. This is an artificial construct, but it provides a way to represent the overall mortality experience of a current population and allows us to compare this experience across countries and over time. If mortality rates continue to decline, as is expected, the average child born today will live considerably longer than the estimate shown on a current life table. Given these caveats, it is nonetheless useful to examine changes in life expectancy over the last century and life expectancy at specific ages. Life expectancy at birth was only 47.3 years in 1900 and rose to 68.2 years by 1950, affected to a large extent by improvements in infant and child mortality. Life expectancy continued to rise through the second half of the twentieth century, driven mainly by increases in survival in middle and old age. Table 5-2 shows life expectancy at birth and at ages 65, 75, and 85 years for the year 2003. At every age, females have a higher life expectancy than males, with the differential at birth being 5.3 years. The gender differential for blacks (7.1 years) is greater than for whites (5.2 years). Blacks have a lower life expectancy than whites through age 75 years and then have a higher life expectancy at age 85 years. The observations of importance to geriatric medicine in these estimates are that the average 75-year-old man will live about 10 more years and the average 75-year-old woman will live more than 12 additional years. At age 85, the average person can still expect to live another 6 to 7 years.
The estimates shown in Table 5-2 do not include Hispanics. Although the National Center for Health Statistics does publish data on Hispanic mortality rates, these data come with warnings of problems associated with their accuracy. The denominator for Hispanic rates comes from the U.S. Census, where Hispanic ethnicity is self-reported. At the time of death, Hispanic ethnicity is reported by the person completing the death certificate, and there is likely a large amount of underreporting. It is also known that a not insignificant number of Hispanic persons return to their native countries to spend the last years of their lives, and so their deaths are not enumerated as deaths in the United States. Thus, there is substantial underascertainment of the numerator for Hispanic death rate calculations, leading to an underestimation of the true rates.
The improvements in survival over the last century are relevant to the field of geriatric medicine, as the decline in mortality rates throughout life has resulted in a population with a large proportion of individuals who will survive to advanced old age. This point is made compellingly by the data shown in Figure 5-4. This figure was generated using data from 1900, 1950, and 2003 life tables and illustrates the proportion of 50-year-old men and women who can expect to live to age 90 years or older. Only about 3% of 50-year-olds could expect to live to this age in 1900. By 1950, this proportion had hardly risen at all in men but had gone up to nearly 10% in women. The large decreases in old-age mortality in the second half of the century led to large changes by 2003, when over 16% of 50-year-old men and more than 28% of 50-year-old women could expect to reach the age of 90 years or older. All these estimates are derived from current life tables; so if mortality continues to decline, these percentages will be even higher in the current cohort of 50-year-olds. The consequence of these changes is that an unprecedented proportion of the current middle-aged population will live to very old age.
There has always been a fascination with extreme longevity, but the demographics of very long life have been formally studied only in recent years. Examples of persons who lived to 100 years are mentioned at the time of the Imperial Rome and, although these reports cannot be directly validated, there is no reason to believe that a few rare individuals might not have reached extreme longevity. However, as the percentage of centenarians has risen, especially in the last century, centenarians are no longer rare and virtually all geriatricians have dealt with a centenarian patient. Studying centenarians provides a magnified view of the aging process, but the study of long-lived individuals can also provide results that are important in geriatric practice. In fact, little is known about the factors that predict decline in health status, disability, and mortality in individuals in their nineties.
Previous claims for the world record for longevity were often unsubstantiated, and pockets of the world where claims were made for general high longevity usually turned out to be no different than other parts of the world. However, recent data from places like Sardinia, Italy, have identified areas of increased longevity that have been meticulously validated. There is currently no solid explanation about why centenarians are concentrated in these geographical areas.
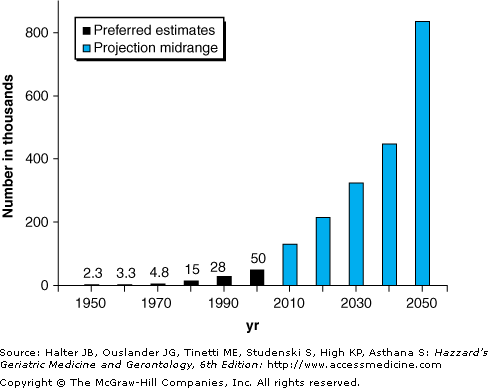
Better age documentation has made it possible to be more confident about the numbers of centenarians and changes in these numbers. It has been estimated that the number of centenarians in western Europe has doubled every decade since 1950, and estimates for the United States also show a doubling between 1980 and 1990 and again from 1990 to 2000, when the total number of centenarians rose from 28,000 to more that 50,000 (Figure 5-5). In 2005, the United States had 55,000 centenarians, more than any other country in the world and about 12% of the estimated living world centenarians. In comparison, the population of the United States represents only 4.6% of the world population. However, future increases will be spectacular. It has been estimated that between 2000 and 2050, the number of centenarians will increase more than 16-fold, with a projected 850,000 centenarians in the United States in 2050.
Figure 5-5.
Number (thousands) of centenarians in the United States using preferred estimates (1950–2000) and midrange projections (2010–2050). Projected numbers adapted from Day JC. Population Projections of the United States by Age, Sex, Race, and Hispanic Origin: 1995–2050, U.S. Bureau of the Census, Current Population Reports, P25–1130. Washington, DC: U.S. Government Printing Office; 1996. Preferred estimates for 1950–2000 acquired from He W, Sungupta M, Velkoff VA, DeBarros KA. U.S. Census Bureau, Current Population Reports, P23-209, 65+ in the United States, 2005. Washington, DC: U.S. Government Printing Office; 2005.
In 1990, 78% of U.S. centenarians were non-Hispanic whites. However, since then, the Hispanic and black population have expanded much faster than the white population. Thus, centenarians in the future are expected to be much more ethnically diverse. In all reported series, with the single exception of Sardinia, there are fewer male than female centenarians. However, men reaching this age are considerably less likely to have significant mental and cognitive disability than women.
Although family and twin studies suggest a strong genetic predisposition to extreme longevity and candidate genes have been described, the full mechanism is not understood. The secret is probably a combination of favorable genetic background and environmental factors that exert their influence in critical periods over the life span. In fact, many centenarians report that they were completely independent in self-care activities of daily living and free of disabling condition up to their late nineties. In addition, a sizable proportion of centenarian “escapers” are totally independent and free of major medical condition. Super-centenarians, individuals 110 years old or older, appeared around 200 years ago and their number is currently estimated at about 300 to 400. However, age has been validated in less than 100 of these people. In spite of many claims, only two persons have been clearly documented to have lived to 120 years.
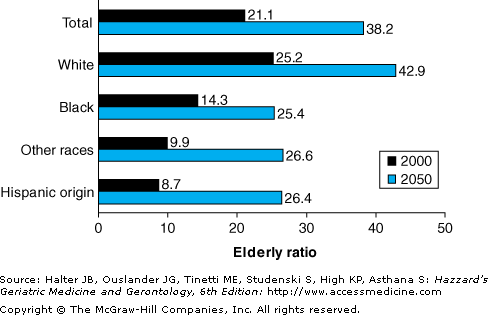
Further demographic characteristics relevant to the social environment in which older persons find themselves living are shown in Figures 5-6 and 5-7. In Figure 5-6, the elderly ratio, defined as the number of persons aged 65 years and older divided by the number of persons aged 20 to 64 years, multiplied by 100, is shown for the total population and racial and ethnic subgroups in 2000 and projected to 2050. With the faster growth of the older population and the less rapid increase in the younger population, this ratio will rise dramatically in the future. Currently there are about 21 older people for every 100 persons aged 20 to 64 years. By 2050, there will be 38 older people for every 100 persons in the younger age group, the group who will be called on to care for older parents and grandparents and whose Social Security payments will be used to provide for retirees. Now and in the future, the elderly ratio is highest in whites. Blacks currently have a higher ratio than Hispanics, but by 2050 there will be about 26 elderly blacks, Hispanics, and persons of other races for every 100 people aged 20 to 64 years.
Figure 5-6.
Elderly ratio: number of persons aged 65 yrs and older divided by number of persons aged 20 to 64, times 100. He W, Sungupta M, Velkoff VA, DeBarros KA. U.S. Census Bureau, Current Population Reports, P23-209, 65+ in the United States, 2005. Washington, DC: U.S. Government Printing Office; 2005.
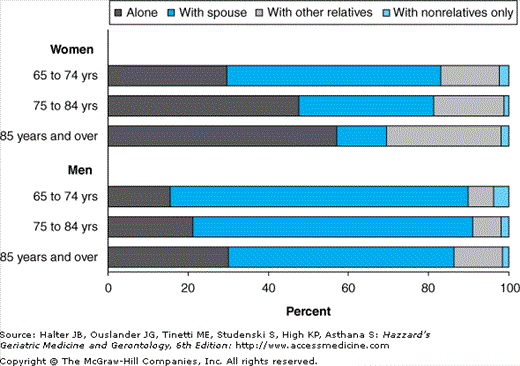
Living situation is determined by health, financial factors, and widowhood and varies considerably by gender and age, as seen in Figure 5-7. Among community-living persons in the United States, women are much more likely to live alone, with almost 60% of women aged 85 years and older living alone. A large proportion of men live with their spouses. Women are more likely to outlive their husbands not only because they live longer but also because they tend to marry older men. Modest percentages of older persons live with other relatives, and a very small proportion live with nonrelatives.
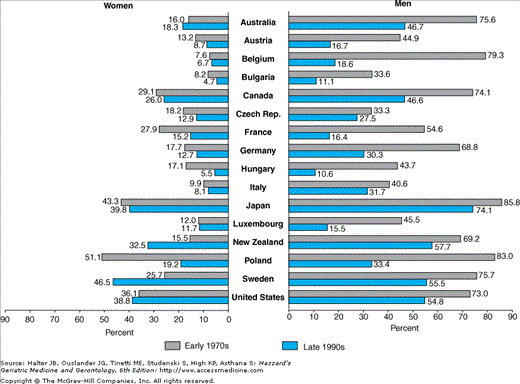
In recent years, the percentage of older people who work and the average age of retirement have fallen throughout the developed countries. In Figure 5-8, the percentage of persons working is shown for the early 1970s and the late 1990s for the 60 to 64-year age group, the group that was traditionally preretirement. Overall, women work less than men, but in a few countries, including the United States, the percentage of women working rose during this time. In many countries, there have been extremely large declines in the percentage of men in this age group who work. For example, the percentage of men 60 to 64 years old who were employed declined over this 25-year period from 76% to 47% in Australia, from 79% to 19% in Belgium, from 55% to 16% in France, and from 69% to 30% in Germany. An increase in societal wealth has been the main driving force for decreased workforce participation, but other factors include obsolescence of the skills of older workers, pressure for older workers to leave their jobs to make room for younger workers in countries with high unemployment, and the growth of financial incentives for early retirement. The percentage of persons in the 65 years and older age group who work has also declined. For example, in the United States, the percentage of men in this age group who work dropped from 24.8% in the early 1970s to 16.9% in the late 1990s. The corresponding percentages for men in Germany were 16% and 4.5%, in France 10.7% and 2.3%, and in Japan 54.5% and 35.5%. With earlier retirement and longer life expectancy, the number of years people live after retirement has increased greatly. The Organization for Economic Cooperation and Development (OECD) has estimated that in 1960 men in developed countries could expect to spend 46 years in the labor force and a little more than 1 year in retirement. By 1995, years in the labor force had decreased to 37, whereas years in retirement had increased to 12.
Mortality
The increasingly greater life expectancy of the population has been driven in part by reduced mortality at older ages. It is instructive to review the U.S. vital statistics data on causes of death in the older population, changes in these rates with increasing age, and trends in overall and disease-specific mortality over time. Table 5-3 lists the leading causes of death in the population age 65 years and older in 2004. It employs the ICD-10 classification system, which was first used for national data in 1999. As in younger individuals, heart disease is by far the most common cause of death, followed by cancer. The five leading causes of death—heart disease, cancer, stroke, chronic lower respiratory tract disease, and Alzheimer’s disease account for 69.5% of all deaths. Alzheimer’s disease, which in the past was rarely assigned as the underlying cause of death and was not on the list of leading causes of death, was the seventh leading cause of death in older persons in 2000 and in 2003 rose to the fifth leading cause of death, responsible for 3.7% of deaths. This is still likely a gross underestimation. The contribution of Alzheimer’s disease in the future will probably grow substantially. It is well recognized that assigning a single underlying cause of death is fraught with problems when an individual dies in advanced old age and has multiple chronic conditions. What is surprising is that despite this difficulty the distribution of causes of death in the United States remains quite stable from year to year.
CAUSE OF DEATH | NUMBER OF DEATHS | DEATH RATE (PER 100,000 POPULATION) | % OF ALL DEATHS IN PERSONS ≥65 YRS |
|---|---|---|---|
Heart disease | 533 302 | 1536.5 | 30.4 |
Malignant neoplasms | 385 847 | 1111.6 | 22.0 |
Cerebrovascular disease | 130 538 | 376.1 | 7.4 |
Chronic lower respiratory disease | 105 197 | 303.1 | 6.0 |
Alzheimer’s disease | 65 313 | 188.2 | 3.7 |
Diabetes mellitus | 53 956 | 155.5 | 3.1 |
Influenza and pneumonia | 52 760 | 152.0 | 3.0 |
Nephritis, nephrotic syndrome, and nephrosis | 35 105 | 101.1 | 2.0 |
All other accidents | 27 939 | 80.5 | 1.6 |
Septicemia | 25 644 | 73.9 | 1.5 |
Motor vehicle accidents | 7 081 | 20.4 | 0.4 |
All other causes (residual) | 332 987 | 959.4 | 19.0 |
Total | 1 755 669 | 5058 | 100.0 |
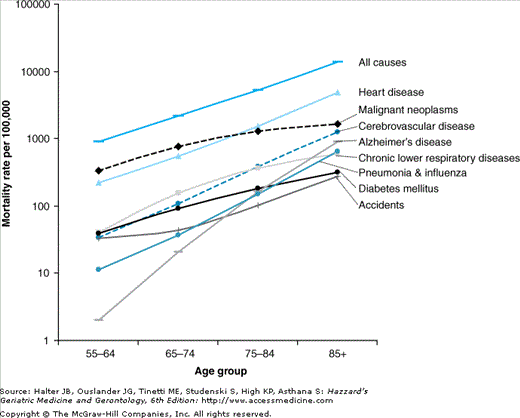
Age-specific mortality rates for selected leading causes of death are depicted in Figure 5-9. On this logarithmic scale, a straight-line increase indicates an exponential increase in mortality rate with age. An exponential increase is present for all causes of death and parallel increases are seen for heart disease, cerebrovascular disease, and pneumonia and influenza. The exponential rise with age for Alzheimer’s disease mortality is substantially steeper. The mortality rates for cancer and lower respiratory tract disease do not maintain as steep a rise with increasing age, perhaps because the people who contribute in large part to these categories are smokers, who die at younger ages and are less represented in the oldest segment of the population. Diabetes mortality rates also do not show an exponential increase with advancing age, again because diabetic patients may die disproportionately at younger ages. The one condition in this figure for which the mortality rate slope becomes steeper with advancing age is accidents. Although motor vehicle accidents are an issue of real concern in older persons, it is important to note, as shown in Table 5-3, that there are four times as many deaths from other types of accidents, primarily falls, as from motor vehicle accidents.
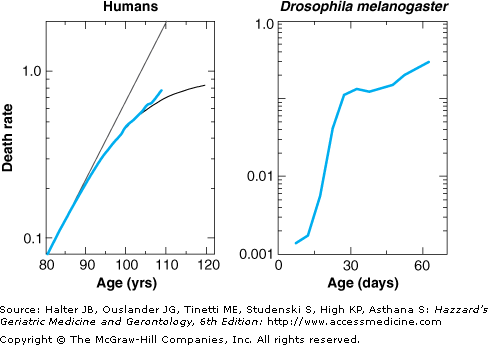
The graph of the exponential rise in mortality with increasing age, which has been described for many species, has been termed the Gompertz curve. It has been difficult to evaluate whether the exponential increase is maintained to the very end of life, as the numbers of extremely old individuals available for study have traditionally been quite small. Recently, larger populations of very old humans and other species have been evaluated to examine whether the Gompertz curve continues to describe mortality rates at advanced old age. Figure 5-10 shows death rates for humans and fruit flies at the extremes of old age, and in both these examples the Gompertz function, which is represented as a straight line in the human example, is not consistent with the data. The conclusion from these studies and from studies on a variety of other species is that the force of mortality declines somewhat in individuals who survive to very old age, although the causes of this phenomenon remain unclear.
Figure 5-10.
Death rates at advanced old age in women and from age 0–60 days for a genetically homogeneous line of Drosophila melanogaster. Human estimates come from data aggregated from 14 countries for which data were available over the period from 1950 to 1990 for ages 80–109, and to 1997 for ages 110 and over. Data on Drosophila are from 6333 flies reared under usual laboratory conditions. Reprinted with permission from Vaupel JW, Carey JR, et al. Biodemographic trajectories of longevity. Science. 1998;280:855.
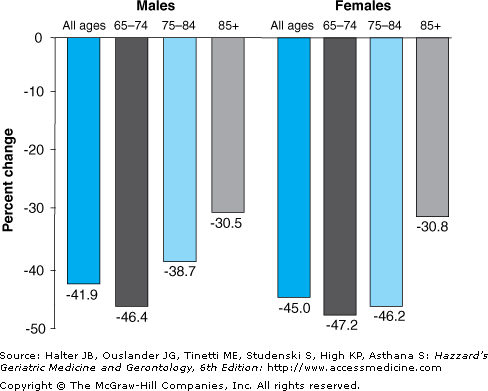
The first half of the twentieth century saw large declines in mortality in infants and children, but in the second half of the century, there were unprecedented declines in mortality in the older segment of the population. In the total population, mortality rates between 1950 and 2004 fell by 41.9% in males and 45.1% in females (Figure 5-11). What was notable during the latter half of the century was that this magnitude of decline was also seen in men and women in the 65- to 74-year-old and 75- to 84-year-old age groups. Even for people 85 years and older, there was a mortality rate decline that exceeded 30%.
Figure 5-11.
Percent change in mortality rates, United States, 1950–2004, for all ages (age-adjusted using yr 2000 standard population) and for older age groups. Calculated from data in National Center for Health Statistics. Health, United States, 2006 with Chartbook on Trends in the Health of Americans. Hyattsville, MD: National Center for Health Statistics; 2006.
Mortality change over this time period is further explored in Table 5-4, which lists 1950 and 2004 death rates and percentage changes in these rates for heart disease, stroke, and cancer, diseases that account for 60% of deaths in older adults. For the total population, heart disease mortality declined more than 60%, and stroke mortality dropped more than 70%, a truly remarkable decline in these diseases that reflects major advances in both prevention and treatment as well as a secular trend that is not fully understood. For both these diseases, the declines in the 65- to 74-year-old and 75- to 85-year old age groups generally exceeded the percentage decline seen for the total population. In persons aged 85 years and older, heart disease mortality declined by more than 45%, with stroke mortality dropping by more than 60% in men and more than 55% in women, impressive declines in this very old segment of the population. Unfortunately, the declines in mortality seen for heart disease and stroke were not seen for cancer. In women, the overall population showed a modest decline in cancer mortality, but the older population had a slight rise in rates. Cancer mortality rates rose in older men, with increases of 25% in men 75 to 84 years and 40% in men 85 years and older. Heavy cigarette smoking in the cohort of men who were in the older age groups at the end of the last century was probably a major contributing factor to this increase in cancer rates. Figure 5-12 depicts change in mortality from cancers of the lung, trachea, and bronchus over the past half century. Mortality in men was much higher than in women and rose very steeply in men 75 to 84 years and 85 years and older until the early 1990s, when it leveled off. Cancer mortality rose less steeply in men 65 to 74 years, leveled off in the late 1980s and is now showing a downturn. Mortality from cancer of the lung, trachea, and bronchus in older women rose slowly after 1960, with a slightly steeper rise in those 75 to 84 years beginning in the 1980s.
1950 | 2004 | CHANGE | ||
|---|---|---|---|---|
Diseases of the Heart | ||||
Males | ||||
All ages | 697.0 | 267.9 | –61.6 | |
65–74 | 2292.3 | 723.8 |
||
