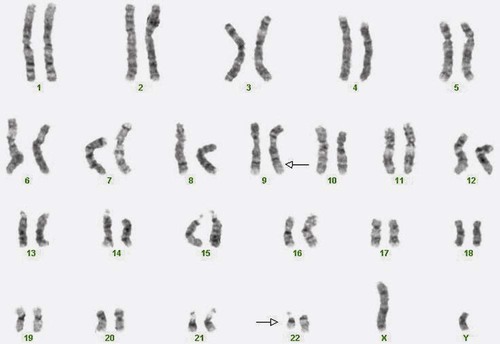
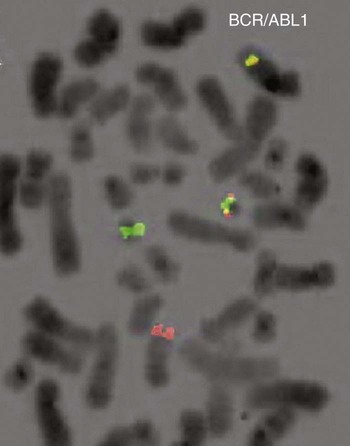
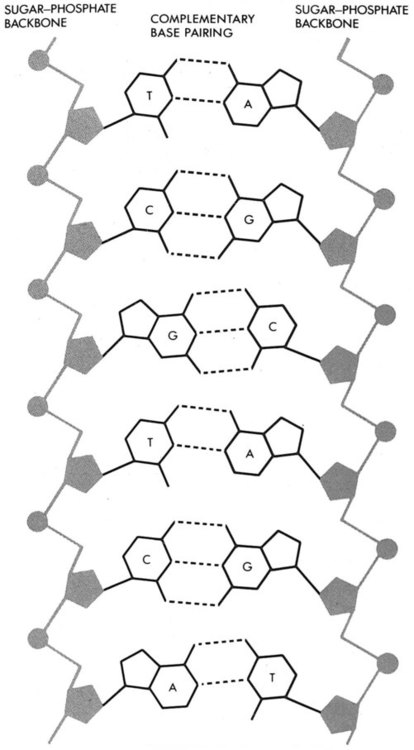
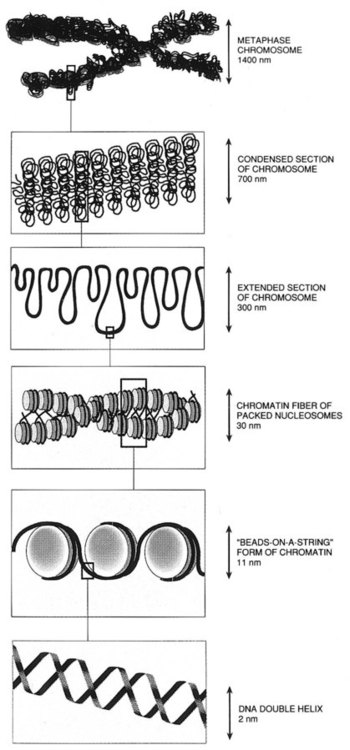
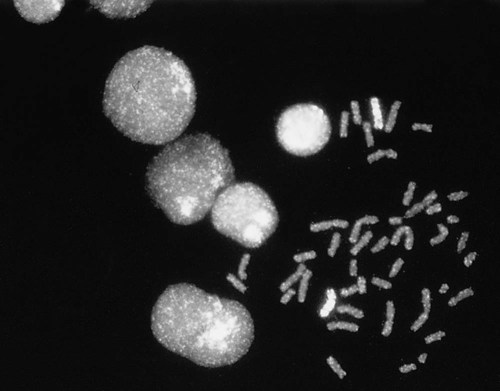
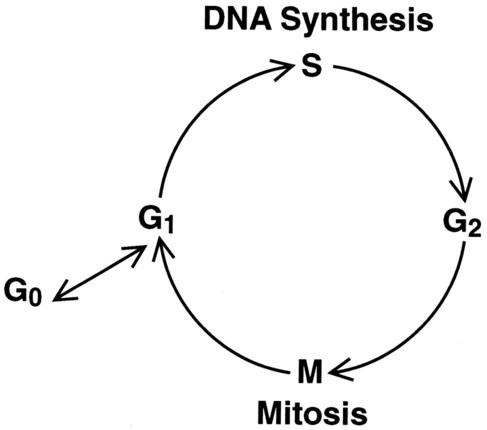
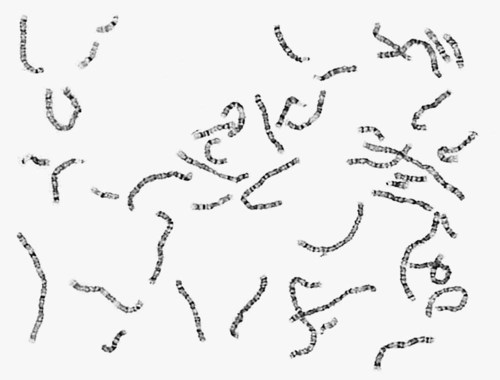
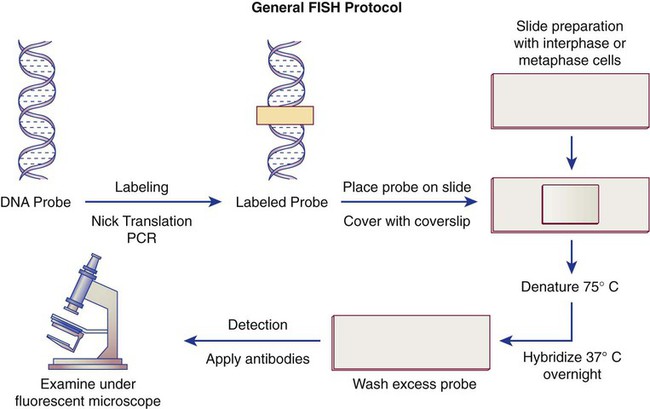
After completion of this chapter, the reader will be able to: 1. Describe chromosome structure and the methods used in G-banded chromosome identification. 2. Explain the basic laboratory techniques for preparing chromosomes for analysis. 3. Differentiate between numeric and structural chromosome abnormalities. 4. Discuss the importance of karyotype in the diagnosis of hematologic cancer. 5. Explain the basic technique of fluorescence in situ hybridization (FISH). 6. Discuss the advantage of using FISH analysis in conjunction with G-banded analysis of cells. 7. Describe the types of chromosomal abnormalities that are detectable with cytogenetic methods. 8. Given the designation of a chromosome mutation, be able to determine whether the abnormality is numeric or structural, which chromosomes are affected, what type of abnormality it is, and what portion of the chromosome is affected. 9. Given a diagram of a G-banded generic chromosome, name the structures identifiable by light microscopy. A 54-year-old man came to his physician with a history of fatigue, weight loss, and increased bruising over a 6-month period. His WBC count was elevated at 200 × 109/L. A bone marrow aspirate was sent for cytogenetic analysis. G-banded chromosome analysis of 20 cells from bone marrow cultures showed all cells to be positive for the Philadelphia chromosome, t(9;22)(q34;q11.2), as seen in chronic myelogenous leukemia (Figure 31-1). FISH studies using the BCR and ABL gene probes (Abbott Molecular, Des Plaines, Ill.) produced dual fusion signals, one located on the derivative chromosome 9 and one on the derivative chromosome 22, characteristic of the translocation between chromosomes 9 and 22 leading to the rearrangement of BCR and ABL1 oncogenes (Figure 31-2). The patient was treated with imatinib mesylate for the next 2 months. Another cytogenetic study was performed on a second bone marrow aspirate. This analysis showed that 12 of 20 cells analyzed were normal, 46,XY[12]; however, there were still 8 cells positive for the Philadelphia chromosome, 46,XY,t(9;22)(q34; q11.2)[8]. Human cytogenetics is the study of chromosomes, their structure, and their inheritance. There are approximately 25,000 genes in the human genome, most of which reside on the 46 chromosomes normally found in each somatic cell.1 Chromosome disorders are classified as structural or numerical and involve the loss, gain, or rearrangement of either a piece of a chromosome or the entire chromosome. Because each chromosome contains thousands of genes, a chromosomal abnormality that is observable by light microscopy involves, on average, 3 to 5 megabases of DNA and represents the disruption or loss of hundreds of genes. Such disruptions often have a profound clinical effect. Chromosomal abnormalities are observed in approximately 0.65% of all live births.2 The gain or loss of an entire chromosome, other than a sex chromosome, is usually incompatible with life and accounts for approximately 50% of first-trimester spontaneous abortions.3 In leukemia, cytogenetic abnormalities are observed in more than 50% of bone marrow specimens.4 These recurring abnormalities often define the leukemia and frequently indicate clinical prognosis. Physicians who care for patients of all ages may order chromosome analysis or karyotyping for patients with mental retardation, infertility, ambiguous genitalia, short stature, fetal loss, risk of genetic or chromosomal disease, and cancer. In the following discussion, basic cytogenetic concepts are presented. This field is in a period of tremendous growth. Supplementation of this chapter with the material in Chapter 32 is recommended. The cell cycle is divided into four stages: G1, the growth period before synthesis of deoxyribonucleic acid (DNA); S phase, the period during which DNA synthesis takes place; G2, the period after DNA synthesis; and M, the period of mitosis or cell division, the shortest phase of the cell cycle (Figure 31-3). During mitosis, chromosomes are maximally condensed. While in mitosis, cells can be chemically treated to arrest cell progression through the cycle so that the chromosomes can be isolated and analyzed. A chromosome is formed from a single long DNA molecule that contains a series of genes. The complementary double-helix structure of DNA was established in 1953 by Watson and Crick.5 The backbone is a sugar-phosphate-sugar polymer. The sugar is deoxyribose. Attached to the backbone and filling the center of the helix are four nitrogen-containing bases. Two of these, adenine (A) and guanine (G), are purines; the other two, cytosine (C) and thymine (T), are pyrimidines (Figure 31-4). The chromosomal DNA of the cell resides in the cell’s nucleus. This DNA and its accompanying proteins are referred to as chromatin. During the cell cycle, at mitosis, the nuclear chromatin condenses approximately 10,000-fold to form chromosomes.6 Each chromosome results from progressive folding and compaction of the entire nuclear chromatin. This condensation is achieved through multiple levels of helical coiling and supercoiling (Figure 31-5). Metaphase is the stage of mitosis where the chromosomes align on the equatorial plate. Electron micrographs of metaphase chromosomes have provided models of chromosome structure. In the “beads-on-a-string” model of chromatin folding, the DNA helix is looped around a core of histone proteins.7 This packaging unit is known as a nucleosome and measures approximately 11 nm in diameter.8 Nucleosomes are coiled into twisted forms to create an approximately 30-nm chromatin fiber. This fiber, called a solenoid, is condensed further and bent into a loop configuration. These loops extend at an angle from the main chromosome axis.9 In 1956, Tijo and Levan10 identified the correct number of human chromosomes as 46. This is the diploid chromosome number and is determined by counting the chromosomes in dividing somatic cells. The designation for the diploid number is 2n. Gametes (ova and sperm) have half the diploid number (23). This is called the haploid number of chromosomes and is designated as n. Different species have different numbers of chromosomes. The reindeer has a relatively high chromosome number for a mammal (2n = 76), whereas the Indian muntjac, or barking deer, has a very low chromosome number (2n = 7 in the male and 2n = 6 in the female).11 In the 1960s, before the discovery of banding, chromosomes were categorized by overall size and the location of the centromere (primary constriction) and were assigned to one of seven groups, A through G. Group A includes chromosome pairs 1, 2, and 3. These are the largest chromosomes, and their centromeres are located in the middle of the chromosome (i.e., they are metacentric). Group B chromosomes, pairs 4 and 5, are the next largest chromosomes; their centromeres are off center, or submetacentric. Group G consists of the smallest chromosomes, pairs 21 and 22, whose centromeres are located at the ends of the chromosomes and are designated as acrocentric (Figure 31-6). Tissues used for chromosome analysis contain cells with an inherently high mitotic rate (bone marrow cells) or cells that can be stimulated to divide in culture (peripheral blood lymphocytes). Special harvesting procedures are established for each tissue. Mitogens such as phytohemagglutinin or pokeweed mitogen are added to peripheral blood cultures. Phytohemagglutinin primarily stimulates T cells to divide,12 whereas pokeweed preferentially stimulates B lymphocytes.13 Analysis of each chromosome is made possible by staining with a dye. The name chromosome is derived from the Greek words chroma, meaning “color,” and soma, meaning “body.” Hence chromosome means “colored body.” In 1969, Caspersson, Zech, Modest, et al14 were the first investigators to stain chromosomes successfully with a fluorochrome dye. Using quinacrine mustard, which binds to adenine-thymine–rich areas of the chromosome, they were able to distinguish a banding pattern unique to each chromosome. This banding pattern, called Q banding, differentiates the chromosome into bands of differing widths and relative brightnesses (Figure 31-7). The most brightly fluorescent bands of the 46 human chromosomes include the distal end of the Y chromosome, the centromeric regions of chromosomes 3 and 4, and the short arms of the acrocentric chromosomes (13, 14, 15, 21, and 22). Other stains are used to identify chromosomes, but in contrast to Q banding, these methods normally necessitate some pretreatment of the slide to be analyzed. Giemsa (G) bands are obtained by pretreating the chromosomes with the proteolytic enzyme trypsin. GTG banding means “G banding by Giemsa with the use of trypsin.” Giemsa, like quinacrine mustard, stains AT-rich areas of the chromosome. The dark bands are called G-positive (+) bands. Guanine-cytosine–rich areas of the chromosome have little affinity for the dye and are referred to as G-negative (−) bands. G+ bands correspond with the brightly fluorescing bands of Q banding (Figures 31-8 and 31-9). G banding is the most common method used for staining chromosomes. C banding stains the centromere (primary constriction) of the chromosome and the surrounding condensed heterochromatin. Constitutive heterochromatin is a special type of late-replicating repetitive DNA that is located primarily at the centromere of the chromosome. In C banding, the chromosomes are treated first with an acid and then with an alkali (barium hydroxide) before Giemsa staining. C banding is most intense in human chromosomes 1, 9, and 16 and the Y chromosome. Polymorphisms are also observed in the C bands from different individuals. These polymorphisms have no clinical significance (Figure 31-10). Chromosome banding is visible after chromosome condensation, which occurs during mitosis. The banding pattern observed depends on the degree of condensation. By examination of human chromosomes early in mitosis, it has been possible to estimate a total haploid genome (23 chromosomes) with approximately 2000 AT-rich (G+) bands.15 The later the stage of mitosis, the more condensed the chromosome and the fewer total G+ bands observed. Fluorescence in situ hybridization (FISH) is a molecular technique commonly used in cytogenetic laboratories. FISH studies are a valuable adjunct to the diagnostic workup. In FISH, the DNA or RNA probe is labeled with a fluorophore. Target DNA is treated with heat and formamide to denature the double-stranded DNA, which renders it single-stranded. The target DNA anneals to a similarly denatured, single-stranded, fluorescently labeled DNA or RNA probe with a complementary sequence. After hybridization, the unbound probe is removed through a series of stringent washes, and the cells are counterstained for visualization (Figure 31-11). In situ hybridization with centromere or whole-chromosome painting probes can be used to identify individual chromosomes (Figure 31-12). Marker chromosomes represent chromatin material that has been structurally altered and cannot be identified by a G-band pattern. FISH using a centromere or paint probe, or both, is often helpful in identifying the chromosome of origin (Figure 31-13).16 Specific loci probes can be used to detect both structural and numerical abnormalities but are especially helpful in identifying chromosomal translocations or inversions.
Cytogenetics
Case Study
Reasons for Chromosome Analysis
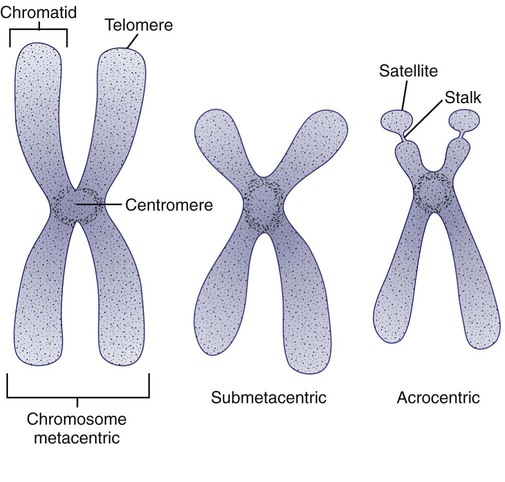
Chromosome Structure
Cell Cycle
Chromosome Architecture
Metaphase Chromosomes
Chromosome Identification
Chromosome Number
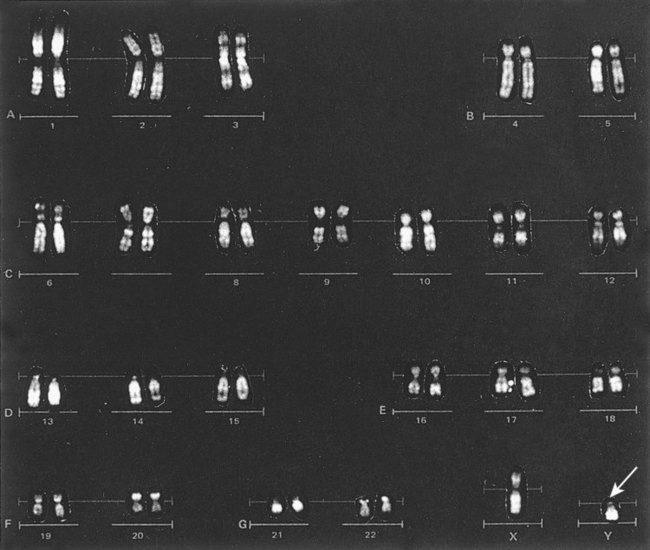
Chromosome Size and Type
Techniques for Chromosome Preparation and Analysis
Chromosome Preparation
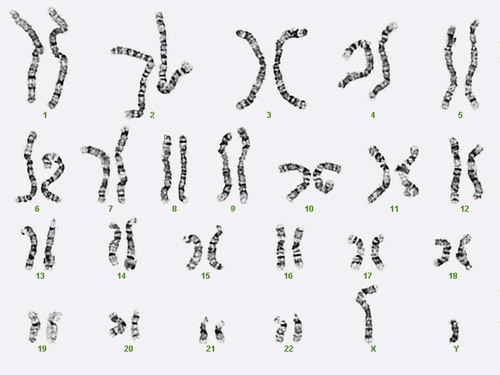
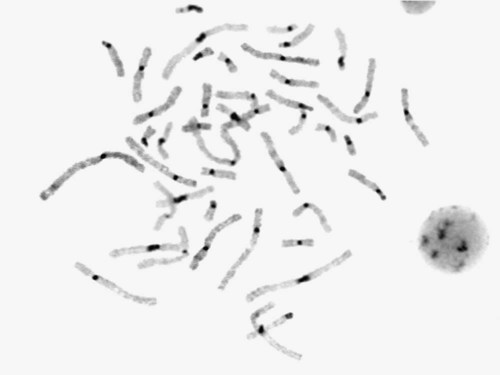
Chromosome Banding
Nonradioactive in Situ Hybridization
![]()
Stay updated, free articles. Join our Telegram channel

Full access? Get Clinical Tree


Cytogenetics