Fig. 13.1
Number of patients undergoing MNC-IVF and number of cycles performed
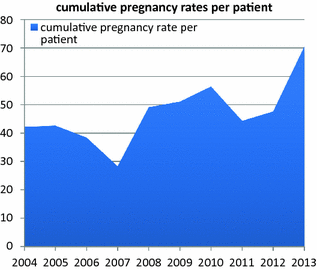
Fig. 13.2
Cumulative pregnancy rates per patient
In this chapter, results of our original studies and cumulative pregnancy rates after 6 cycles of MNC in a larger series of patients are discussed.
What Would Be the Optimal Number of MNC Cycles?
In comparing the results of modified natural cycle IVF to other treatment modalities, it is important to consider that although the pregnancy rate per cycle in general is rather low, duration of treatment is short and treatment can be easily repeated in consecutive cycles. Obviously, compared to standard IVF with ovarian stimulation, a higher number of cycles is necessary to obtain similar pregnancy rates. In our experience, patients are quite willing to accept the necessity of a higher number of cycles, mainly based on anxiety for hormonal stimulation.
The additional value of an increase in the number of MNC-IVF cycles to be offered to patients will depend mainly on the willingness of patients to undergo these cycles. In order to determine the optimal number of cycles per patient, it is also important to evaluate whether or not the pregnancy rate per cycle decreases in higher cycle numbers.
In order to evaluate the optimal number of MNC-IVF cycles, a study was done in our centre in which a maximum of nine cycles of MNC-IVF was offered to 268 patients. Dropout rates after unsuccessful treatment cycles and pregnancy rates according to cycle number were evaluated [3]. This study is discussed in detail in the following section.
Cumulative Pregnancy Rates After Nine Cycles of MNC-IVF and Analysis of Patient Dropout
For details on methodology, we refer to the original publication [3]. In short, patients aged 18–36 years with an indication for conventional IVF and proven ovulatory cycles were included in this study. Only conventional IVF was performed, and no ICSI was done. All embryo transfers were done on day 3 after oocyte retrieval.
Patients were offered a maximum of nine treatment cycles. Treatments were performed in consecutive menstrual cycles (unless patients requested otherwise) and took place between March 2001 and September 2005. All treatments were offered for free.
End point in this study was pregnancy. Results according to cycle number and actual observed cumulative pregnancy rates per patient were calculated and life table analysis was done.
Patient Characteristics and Results of Treatment Cycles
Patient characteristics are shown in Table 13.1. Of 268 included patients, twelve withdrew from the study before starting treatment, in five of these because of the occurrence of a spontaneous pregnancy. Results according to cycle number are shown in Table 13.2. Overall, 256 patients started 1048 treatment cycles (4.1 per patient). Median duration of treatment was 5.0 months (range 1–24). Ninety-four cycles (9.0%) were cancelled before the planning of oocyte retrieval. Reasons for cancellation were LH rise or ovulation before or during cetrorelix administration (46 cycles), lack of follicular development or problems with monitoring due to difficult visualization of the ovary (28 cycles), or other reasons (28 cycles).
Table 13.1
Patient characteristics
No. of patients | 268 |
|---|---|
Female patient age (years)a | 33.3 (23–36) |
BMI (kg/m2)a | 23.0 (16–34) |
Duration of subfertility (months)a | 46.0 (0–121) |
Subfertility (%) | |
Primary | 164 (61.2) |
Secondary | 104 (38.8) |
Indication (%) | |
Tubal | 82 (30.6) |
Unexplained | 106 (39.6) |
Male factor | 41 (15.3) |
Endometriosis | 22 (8.2) |
Cervical factor | 8 (3.0) |
Failed AID | 9 (3.4) |
Table 13.2
Results according to cycle number of modified natural cycle IVF
Cycle number | 1 | 2 | 3 | 4 | 5 | 6 | 7 | 8 | 9 | Total |
|---|---|---|---|---|---|---|---|---|---|---|
Cycles started | 256 | 217 | 181 | 127 | 92 | 69 | 51 | 32 | 23 | 1048 |
OR not planned (%/cycle) | 23 (9.0) | 21 (9.7) | 21 (11.6) | 12 (9.4) | 5 (5.4) | 8 (11.6) | 4 (7.8) | – | – | 94 (9.0) |
Planned OR cancelled (%/planned OR) | 23 (9.9) | 18 (9.2) | 13 (8.1) | 17 (14.8) | 10 (11.5) | 5 (8.2) | 6 (12.8) | 4 (12.5) | 2 (8.7) | 98 (10.3) |
OR performed (%/cycle) | 210 (82.0) | 178 (82.0) | 147 (81.2) | 98 (77.2) | 77 (83.7) | 56 (81.2) | 41 (80.4) | 28 (87.5) | 21 (91.3) | 856 (81.7) |
OR successful (%/attempt) | 152 (72.4) | 134 (75.3) | 111 (75.5) | 70 (71.4) | 56 (72.7) | 36 (64.3) | 32 (78.0) | 18 (64.3) | 16 (76.2) | 625 (73.0) |
Cycles with fertilization (%/successful OR) | 116 (76.3) | 93 (69.4) | 73 (65.8) | 52 (74.3) | 42 (75.0) | 29 (80.6) | 21 (65.6) | 13 (72.2) | 14 (87.5) | 453 (72.5) |
Embryo transfer (%/cycle) | 99 (38.7) | 76 (35.0) | 60 (33.1) | 43 (33.9) | 37 (40.2) | 25 (36.2) | 19 (37.7) | 11 (34.4) | 12 (52.2) | 382 (36.5) |
Single ET | 94 | 73 | 57 | 43 | 35 | 23 | 16 | 9 | 12 | 362 |
Double ET | 5 | 3 | 3 | – | 2 | 2 | 3 | 2 | – | 20 |
Pregnancy rate (%/cycle) | 27 (10.5) | 20 (9.2)a | 19 (10.5) | 12 (9.4)ab | 11 (12.0)a | 5 (7.2)a | 5 (9.8)a | 3 (9.4)a | 2 (8.7) | 104 (9.9) |
Ongoing pregnancy rate (%/cycle) | 25 (9.8) | 12 (5.5) | 16 (8.8) | 11 (8.7)ab | 10 (10.9)a | 5 (7.2)a | 3 (5.9) | – | 1 (4.3) | 83 (7.9) |
Live birth (%/cycle) | 24 (9.4) | 12 (5.5) | 15 (8.3) | 11 (8.7) | 10 (10.9) | 5 (7.2) | 3 (5.9) | – | 1 (4.3) | 81 (7.7) |
Further 98 cycles (10.3% per planned oocyte retrieval) were cancelled at the time of planned oocyte retrieval, in one case because of inaccessibility of the ovary and in 97 cases because unexpected ovulation had occurred. Out of 856 oocyte retrievals, 625 were successful (73.0% per attempt). In most cases, one or two oocytes were obtained (576 and 44 cycles, respectively). In five cycles, three or more oocytes were obtained (three, three, six, nine and twenty oocytes, respectively).
In 453 cycles, fertilization occurred (72.5% per successful oocyte retrieval). Due to aberrant fertilization or defective embryo development, no embryo transfer was done in 71 of these. In 382 cycles, embryo transfer was done (36.5% per started cycle; 61.1% per successful oocyte retrieval). In 20 cycles, two or more embryos were available for transfer and in all of these, double embryo transfer (DET) was done. In all other cycles, one single embryo was transferred (SET).
In 104 cycles, a pregnancy was obtained. One of these occurred spontaneously during a treatment cycle that was cancelled because of an LH surge, six occurred after IUI in cases where oocyte retrieval was cancelled because of unexpected ovulation, and 97 pregnancies occurred after embryo transfer (91 after SET and six after DET). The pregnancy rate was 9.9% (95% CI: 8.1–11.8) per started cycle. Three out of 104 pregnancies were twins (2.9%), of which one occurred after the transfer of one single embryo and two occurred after DET. Ongoing pregnancy rate was 7.9% (95% CI: 6.3–9.6) per started cycle. One pregnancy was interrupted because of severe congenital abnormalities. One pregnancy ended in foetal death at 17 weeks’ gestation. Live birth was thus 7.7% (95% CI: 6.1–9.4) per cycle. OHSS did not occur after any of the cycles. Results according to cycle number were not significantly different.
Dropout Rates and Cumulative Pregnancy Rates
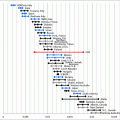
Dropout rates and cumulative pregnancy rates are specified in Table 13.3 and Fig. 13.3.
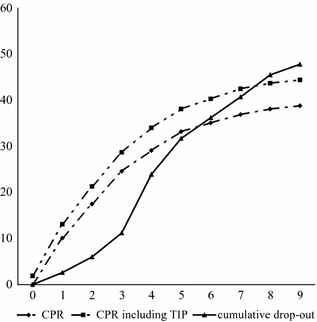
Table 13.3
Dropout rates and cumulative pregnancy rates
Cycle number | Patients | Pregnancy | CPRa | TIP | CPR including TIPb | DO | CPR life tablec | CPR life tabled |
|---|---|---|---|---|---|---|---|---|
0 | 268 | – | – | 5 (1.9) | 5 (1.9) | 7 (2.6) | – | 1.9 |
1 | 256 | 27 (10.5) | 27 (10.5) | 3 (1.2) | 35 (13.1) | 9 (3.5) | 10.5 | 13.4 |
2 | 217 | 20 (9.2) | 47 (18.4) | 2 (0.09) | 57 (21.3) | 14 (6.5) | 18.8 | 22.1 |
3 | 181 | 19 (10.5) | 66 (25.8) | 1 (0.06) | 77 (28.7) | 34 (18.8) | 27.3 | 30.8 |
4 | 127 | 12 (9.4) | 78 (30.5) | 2 (1.6) | 91 (34.0) | 21 (16.5) | 34.2 | 38.4 |
5 | 92 | 11 (12.0) | 89 (34.8) | – | 102 (38.1) | 12 (13.0) | 42.1 | 45.8 |
6 | 69 | 5 (7.2) | 94 (36.7) | 1 (1.4) | 108 (40.3) | 12 (17.4) | 46.3 | 50.5 |
7 | 51 | 5 (9.8) | 99 (38.7) | 1 (2.0) | 114 (42.5) | 13 (25.5) | 51.5 | 56.3 |
8 | 32 | 3 (9.4) | 102 (39.8) | – | 117 (43.7) | 6 (18.8) | 56.1 | 60.4 |
9 | 23 | 2 (8.7) | 104 (40.6) | – | 119 (44.4) | na | 59.9 | 63.8 |

Fig. 13.3
Cumulative pregnancy rates and cumulative dropout rates. CPR cumulative pregnancy rate. TIP—treatment-independent pregnancy
Out of 268 included patients, 102 (38.1%) left the study before completing nine cycles because a pregnancy was obtained. Fifteen (5.6%) left the study because of a treatment-independent pregnancy. Of the remaining 151, 128 (84.8%) dropped out of the study after 0-8 unsuccessful cycles. Of these, 86 (67.2%) proceeded with standard IVF treatment and 42 (32.8%) stopped treatment altogether.
The dropout rate (not including those who stopped treatment because of treatment-independent pregnancy) was low after the first and second cycles (3.5 and 6.5%, respectively) and rose sharply thereafter to 13.0–25.5% in further cycles. Cumulative pregnancy rate per patient starting treatment was 40.6% (95% CI: 34.5–46.8). Including treatment-independent pregnancies, cumulative pregnancy and ongoing pregnancy rate per patient included in the study was 44.4% (95% CI: 35.2–53.6) and 34.7% (95% CI: 28.9–40.5) per patient.
Cumulative pregnancy rates were calculated with life table analysis according to two methods. In the first method, all patients who stopped treatment were censored, leading to a cumulative pregnancy rate of 59.9% (95% CI: 53.9–65.9). In the second method, patients who stopped treatment because of a spontaneous pregnancy were not censored and considered pregnant in the calculation. All other patients who stopped treatment were censored. Cumulative pregnancy rate according to this method was 63.8% (95% CI: 57.9–69.7).
Analysis of Dropout
To analyse whether selective dropout occurred, patients were divided in four groups (patients where a treatment-independent pregnancy occurred excluded): A. patients dropping out after completing 1–4 unsuccessful cycles; B. patients dropping out after completing 5–8 unsuccessful cycles; C. patients who completed nine unsuccessful cycles and D. patients whose treatment led to pregnancy (cycles in which the pregnancy occurred excluded).
Patient and cycle characteristics of these four groups are presented in Table 13.4. Age, percentage of primary subfertility and duration of subfertility were not significantly different between groups. The number of oocyte retrievals performed per cycle was significantly lower in group A compared to groups C and D. Fertilization rate and embryo transfer rate both were significantly lower in group A compared to groups C and D. When comparing group B to groups C and D, the same trend was seen for a number of oocyte retrievals and embryo transfer but differences were not significant. Fertilization rate was significantly lower in group B compared to groups C and D.
Table 13.4
Patient and cycle characteristics of dropouts, non-dropouts and pregnant patients
Groupa | A | B | C | D | P |
|---|---|---|---|---|---|
No. of patients | 78 | 43 | 21 | 77 | |
Age (mean ± SD) | 32.6 (3.2) | 33.0 (2.6) | 33.4 (2.3) | 32.1 (3.0) | 0.20b |
Subfertility primary (%) | 50 (64.1) | 27 (62.8) | 15 (71.4) | 47 (61.0) | 0.85c |
Duration subfertility (mean ± SD) | 51.6 (23.6) | 46.8 (19.6) | 45.8 (20.8) | 43.7 (20.6) | 0.16b |
No of cycles | 223 | 271 | 189 | 230 | |
OR performed (%/cycle) | 162 (72.6; 66.7–78.6) | 211 (77.9; 72.8–82.9) | 160 (84.7; 79.4–89.9) | 199 (86.5; 82.0–91.0) | |
OR successful (%/attempt) | 123 (75.9; 69.2–82.6) | 148 (70.1; 63.8–76.4) | 112 (70.0; 62.8–77.2) | 129 (64.8; 58.1–71.6) | |
Fertilization (%/successful OR) | 64 (52.0; 43.0–61.0) | 90 (60.8; 52.8–68.8) | 90 (80.4; 72.8–87.9) | 101 (78.3; 71.0–85.6) | |
ET (%/cycle) | 44 (19.7; 14.4–25.1) | 72 (26.6; 21.2–31.9) | 73 (38.6; 31.5–45.7) | 89 (38.7; 32.3–45.1) |
In order to analyse whether cancellation of oocyte retrieval, fertilization failure or failure to reach embryo transfer are repeating phenomena in further cycles, results of cycles 2–9 of patients where these events occurred were compared to those of patients where they did not. Results of this analysis are shown in Table 13.5. The number of performed oocyte retrievals as well as the embryo transfer rate was significantly lower in cycles 2–9 in the group where no oocyte retrieval was performed in the first cycle as compared to the group where oocyte retrieval was performed in the first cycle. Patients where fertilization failure occurred in the first cycle showed significantly lower fertilization rate and embryo transfer rate in cycles 2–9 as compared to those where fertilization did occur in the first cycle. In patients who failed to reach embryo transfer in the first cycle, fertilization rate and embryo transfer rate were significantly lower in subsequent cycles compared to patients where embryo transfer was done in the first cycle.
Table 13.5
Results of subsequent cycles after cancellation of oocyte retrieval, fertilization failure or no embryo transfer in the first cycle
Results of first cycle | OR not performed | OR performed | Fertilization failure | Fertilization | No ET performed | ET performed |
|---|---|---|---|---|---|---|
No. of patients | 46 | 210 | 36 | 116 | 157 | 99 |
Results of cycles 2–9 | ||||||
No of cycles | 138 | 654 | 109 | 333 | 520 | 272 |
OR performed (%/cycle) | 97 (70.3; 62.5–78.1) | 549 (83.9; 81.1–86.8) | 92 (84.4; 77.5–91.4) | 281 (84.4; 80.4–88.4) | 418 (80.4; 76.9–83.9) | 228 (83.8; 79.4–88.3) |
OR successful (%/attempt) | 72 (74.2; 65.3–83.1) | 401 (73.0; 69.3–76.8)
Stay updated, free articles. Join our Telegram channel
Full access? Get Clinical Tree
 Get Clinical Tree app for offline access

|
