Fig. 7.1
Flowchart for a generic CADe scheme for the detection of lesions in diagnostic images. Boxes with solid lines indicate four core steps in the CADe scheme, and those with dashed lines indicate optional, yet important steps
To improve the performance of CADe schemes, researchers sometimes adopt an additional step that is enhancement of lesions after step 1 of the segmentation of the organ of interest. This additional step aims to improve the sensitivity for the detection of lesion candidates in the subsequent step. It also often helps improve the specificity. Researchers also often adopt an additional step of reduction of FPs at the end of the steps. The FP reduction step aims to improve the specificity of the CADe scheme. Reduction of FPs is very important, because a large number of FPs could adversely affect the clinical application of CADe. A large number of FPs is likely to confound the radiologist’s task of image interpretation and thus lower his/her efficiency. In addition, radiologists may lose their confidence in CADe as a useful tool.
After the development of a CADe scheme, the evaluation of the stand-alone performance of the developed scheme is the last step in CADe development. CADe research does not end by this step: the evaluation of radiologists’ performance with the use of the developed CADe scheme is the important last step in CADe research.
7.3 Machine Learning (ML) in CADe
7.3.1 Feature-Based (Segmented-Object-Based) ML (Classifiers)
An ML technique is generally used in the step of classification of lesion candidates. The ML technique is trained with sets of input features and correct class labels. This class of ML is referred to as feature-based ML, segmented-object-based ML, or simply as a classifier. Because classifiers (or feature-based ML) are described in detail in many pattern-recognition and computer-vision textbooks, this chapter does not repeat the details of the techniques. Please refer to such textbooks, e.g., [30], [12, 34, 48, 145, 146], for details. The task of ML here is to determine “optimal” boundaries for separating classes in the multidimensional feature space which is formed by input features [30]. A standard classification approach is illustrated in Fig. 7.2. First, lesions (lesion candidates) are segmented by the use of a segmentation method. Next, features are extracted from the segmented lesions. Features may include shape-based (morphologic) features, gray-level-based features (including histogram-based features), and texture features. Some researchers consider texture features in the category of the gray-level-based features. Then, extracted features are entered as input to an ML model such as linear discriminant analysis [34], quadratic discriminant analysis [34], a multilayer perceptron (or artificial neural network) [97, 98], and a support-vector machine [145, 146]. When an artificial neural network is used as a classifier, the structure of the artificial neural network may be designed by the use of an automated design method such as sensitivity analysis [110, 125]. The ML model is trained with sets of input features and correct class labels. A class label of 1 is assigned to the corresponding output unit when a training sample belongs to a certain class (e.g., class A), and 0 is assigned to the other output units (e.g., classes B, C, etc.). In the case of two-class classification, one output unit instead of two output units is often used with the output value 0 being class A, and 1 being class B. After training, the class of the unit with the maximum value is determined to be the corresponding class to which an unknown sample belongs.
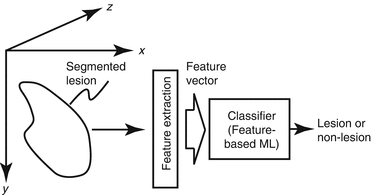
Fig. 7.2
Feature-based (segmented-object-based) ML (classifier) for classification of a detected and segmented lesion candidate
Feature selection has long been an active research topic in machine learning, because it is one of the main factors that determine the performance of a classifier. In general, multiple or often many features are extracted from segmented lesions as the classifier input. Not all of the features, however, would be useful for a classifier to distinguish between lesions and nonlesions, because some of them might be highly correlated with each other or redundant; some of them may not be strongly associated with the given classification task. For designing a classifier with high performance, it is crucial to select “effective” features. Therefore, feature selection is often used to select “effective” features for a given task. One of the most recent, promising feature selection methods is feature selection under the criterion of the maximal area under the receiver-operating-characteristic curve [160].
7.3.2 Patch-/Pixel-Based Machine Learning (PML)
7.3.2.1 Overview
Recently, as available computational power has increased dramatically, patch-/pixel-based machine learning (PML) [114] emerged in medical image processing/analysis which uses values in image patches (i.e., pixel values and/or features calculated from the image patches), instead of features calculated from segmented regions, as input information; thus, segmentation is not required. PML has been used in the classification of the detected lesion candidates in CADe schemes. Recently in the computer-vision field, deep learning and deep neural networks [11, 54] have been attracting researchers’ attentions as a breakthrough technology in computer vision. Deep learning and deep neural networks use PML architecture.
PMLs were first developed for tasks in medical image processing/analysis and computer vision. There are three classes of PMLs: (1) neural filters [126, 129] including neural edge enhancers [128, 130], (2) convolution neural networks (NNs) [62, 68, 69, 71, 73, 88, 100] including shift-invariant NNs [153, 171, 172], and (3) massive-training artificial neural networks (MTANNs) [89, 111, 120, 121, 140] including multiple MTANNs [3, 121, 126, 129, 131, 134], a mixture of expert MTANNs [132, 139], a multiresolution MTANN [120], a Laplacian eigenfunction MTANN (LAP-MTANN) [141], and a massive-training support vector regression (MTSVR) [159]. The class of neural filters was used for image-processing tasks such as edge-preserving noise reduction in fluoroscopy, radiographs and other digital pictures [126, 129], edge enhancement from noisy images [128], and enhancement of subjective edges traced by a physician in cardiac images [130]. The class of convolution NNs was applied to classification tasks such as false-positive (FP) reduction in CAD schemes for the detection of lung nodules in chest radiographs (CXRs) [68, 69, 73], FP reduction in CAD schemes for the detection of microcalcifications [71] and masses [100] in mammography, face recognition [62], and character recognition [88]. The class of MTANNs was used for classification, such as FP reduction in CAD schemes for the detection of lung nodules in CXR [134] and thoracic CT [3, 65, 121], distinction between benign and malignant lung nodules in CT [131], and FP reduction in a CAD scheme for polyp detection in CT colonography [132, 139–141, 159]. The MTANNs were also applied to pattern enhancement and suppression such as separation of bones from soft tissue in CXR [19, 89, 120], and enhancement of lung nodules in CT [111]. There are other PML approaches in the literature. An iterative, pixel-based, supervised, statistical classification method called iterated contextual pixel classification has been proposed for segmenting posterior ribs in CXR [74]. A pixel-based, supervised regression filtering technique called filter learning has been proposed for separation ribs from soft tissue in CXR [75].
7.3.2.2 Massive-Training Artificial Neural Network (MTANN)
An MTANN was developed by extension of neural filters to accommodate various pattern-recognition tasks [121]. A two-dimensional (2D) MTANN was first developed for distinguishing a specific opacity from other opacities in 2D images [121]. The 2D MTANN was applied to reduction of FPs in computerized detection of lung nodules on 2D CT images in a slice-by-slice way [3, 65, 121] and in CXR [134], the separation of ribs from soft tissue in CXR [89, 119, 120], and the distinction between benign and malignant lung nodules on 2D CT slices [131]. For processing of three-dimensional (3D) volume data, a 3D MTANN was developed by extending the structure of the 2D MTANN, and it was applied to 3D CT colonography data [132, 139–141, 159] in CADe of polyps.
The generalized architecture of an MTANN is shown in Fig. 7.3. An MTANN consists of an ML model (typically a regression model) such as a linear-output ANN regression model [128] and a support vector regression model [159], which is capable of operating on pixel/voxel data directly [128]. The linear-output ANN regression model uses a linear function instead of a sigmoid function as the activation function of the output-layer unit because the characteristics of an ANN were improved significantly with a linear function when applied to the continuous mapping of values in image processing [128]. Note that the activation functions of the hidden layer units are a sigmoid function for nonlinear processing, and those of the input layer units an identity function, as usual. The pixel/voxel values of the input images/volumes may be normalized from 0 to 1. The input to the MTANN consists of pixel/voxel values in a subregion/subvolume (image patch or local window), R, extracted from an input image/volume. The output of the MTANN is a continuous scalar value, which is generally associated with the center voxel in the subregion (image patch), and is represented by
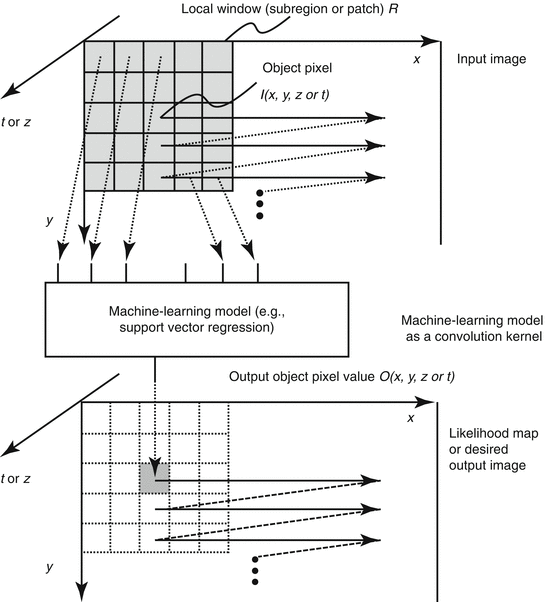
where x, y, and z or t are the coordinate indices, ML(·) is the output of the ML model, and I(x, y, z or t) is a pixel/voxel value of the input image/volume. A three-layer structure may be selected as the structure of the ANN, because it has been proved that any continuous mapping can be approximated by a three-layer ANN [10, 55]. More layers can be used for efficient solving of a complicated problem. The structure of input units and the number of hidden units in the ANN may be designed by the use of sensitivity-based unit-pruning methods [110, 125]. Other ML models such as support vector regression [145, 146] can be used as a core part of the MTANN. ML regression models rather than ML classification models would be suited for the MTANN framework, because the output of the MTANN are continuous scalar values (as opposed to nominal categories or classes, e.g., 0 or 1). The entire output image/volume is obtained by scanning with the input subvolume (local window) of the MTANN on the entire input image/volume. The input subregion/subvolume and the scanning with the MTANN can be analogous to the kernel of a convolution filter and the convolutional operation of the filter, respectively.
Fig. 7.3
Architecture of an MTANN which is a class of PML
(7.1)
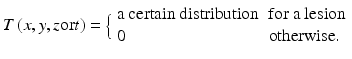
The MTANN is trained with input images/volumes and the corresponding “teaching” (designed) images/volumes for enhancement of a specific pattern and suppression of other patterns in images/volumes. The “teaching” images/volumes are ideal or desired images for the corresponding input images/volumes. For enhancement of lesions and suppression of nonlesions, the teaching volume contains a map for the “likelihood of being lesions,” represented by
To enrich the training samples, a training region, R T , extracted from the input images is divided pixel by pixel into a large number of overlapping subregions. Single pixels are extracted from the corresponding teaching images as teaching values. The MTANN is massively trained by the use of each of a large number of input subregions (image patches) together with each of the corresponding teaching single pixels, hence the term “massive-training ANN.” The error to be minimized by training of the MTANN is represented by
where c is a training case number, O c is the output of the MTANN for the cth case, T c is the teaching value for the MTANN for the cth case, and P is the number of total training voxels in the training region for the MTANN, R T . The expert 3D MTANN is trained by a linear-output back-propagation (BP) algorithm [128] which was derived for the linear-output ANN model by the use of the generalized delta rule [98]. After training, the MTANN is expected to output the highest value when a lesion is located at the center of the subregion of the MTANN, a lower value as the distance from the subregion center increases, and zero when the input subregion contains a nonlesion.
(7.2)
(7.3)
7.3.3 Difference Between PML and Feature-Based ML (Classifiers)
One of the two major differences between PMLs and ordinary classifiers (i.e., feature-based ML or segmented-object-based ML) is the input information. Ordinary classifiers use features extracted from a segmented object in a given image, whereas PMLs use pixel values in an image patch in a given image as the input information. Although the input information to PMLs can be features (see addition of features to the input information to neural filters in [129], for example), these features are obtained from an image patch pixel by pixel (as opposed to ones from a segmented object or by object). In other words, features for PMLs are features at each pixel in a given image, whereas features for ordinary classifiers are features from a segmented object. In that sense, feature-based classifiers can be referred to as segmented-object-based classifiers. Because PMLs use pixel/voxel values in image patches in images directly instead of features calculated from segmented objects as the input information, segmentation or feature extraction from the segmentation results is not required. Although the development of segmentation techniques has been studied for a long time, segmentation of objects is still challenging, especially for complicated objects, subtle objects, and objects in a complex background. Thus, segmentation errors may occur for such complicated objects. Because with PMLs, errors caused by inaccurate segmentation and inaccurate feature calculation from the segmentation results can be avoided, the performance of PMLs can be higher than that of ordinary classifiers for some cases, such as complicated objects.
The other major difference between PMLs and ordinary classifiers is the output information. The output information from ordinary classifiers, convolution NNs, and the perceptron used for character recognition is nominal class labels such as normal or abnormal (e.g., 0 or 1), whereas that from neural filters, MTANNs, and shift-invariant NNs is pixels or images, namely, continuous values. With the scoring method in MTANNs, output images of the MTANNs are converted to likelihood scores for distinguishing among classes, which allow MTANNs to do classification. In addition to classification, MTANNs can perform pattern enhancement and suppression as well as object detection, whereas the other PMLs cannot.
7.4 CADe in Thoracic Imaging
7.4.1 Thoracic Imaging for Lung Cancer Detection
Lung cancer continues to rank as the leading cause of cancer deaths in the United States and in other countries such as Japan. Because CT is more sensitive than chest radiography in the detection of small nodules and of lung carcinoma at an early stage [52, 60, 81, 105], lung cancer screening programs are being investigated in the United States [53, 142], Japan [60, 105], and other countries with low-dose (LD) CT as the screening modality. Evidence suggests that early detection of lung cancer may allow more timely therapeutic intervention for patients [51, 105]. Helical CT, however, generates a large number of images that must be interpreted by radiologists/physicians. This may lead to “information overload” for the radiologists/physicians. Furthermore, they may miss some cancers during their interpretation of CT images [46, 66]. Therefore, a CADe scheme for the detection of lung nodules in CT images has been investigated as a tool for lung cancer screening.
7.4.2 CADe of Lung Nodules in Thoracic CT
7.4.2.1 Overview
In 1994, Giger et al. [38] developed a CADe scheme for the detection of lung nodules in CT based on comparison of geometric features. They applied their CADe scheme to a database of thick-slice diagnostic CT scans. In 1999, Armato et al. [5, 6] extended the method to include 3D feature analysis, a rule-based scheme, and LDA for classification. They tested their CADe scheme with a database of thick-slice (10 mm) diagnostic CT scans. They achieved a sensitivity of 70 % with 42.2 FPs per case in a leave-one-out cross-validation test. Gurcan et al. [45] employed a similar approach, i.e., a rule-based scheme based on 2D and 3D features, followed by LDA for classification. They achieved a sensitivity of 84 % with 74.4 FPs per case for a database of thick-slice (2.5–5 mm, mostly 5 mm) diagnostic CT scans in a leave-one-out test. Lee et al. [63] employed a simpler approach which is a rule-based scheme based on 13 features for classification. They achieved a sensitivity of 72 % with 30.6 FPs per case for a database of thick-slice (10 mm) diagnostic CT scans.
Suzuki et al. [121] developed a PML technique called an MTANN for reduction of a single source of FPs and a multiple MTANN scheme for reduction of multiple sources of FPs that had not been removed by LDA. They achieved a sensitivity of 80.3 % with 4.8 FPs per case for a database of thick-slice (10 mm) screening LDCT scans of 63 patients with 71 nodules with solid, part-solid, and nonsolid patterns, including 66 cancers in a validation test. This MTANN approach did not require a large number of training cases: the MTANN was able to be trained with ten positive and ten negative cases [17, 99, 123], whereas feature-based classifiers generally require 400–800 training cases [17, 99, 123]. Arimura et al. [3] employed a rule-based scheme followed by LDA or by the MTANN [121] for classification. They tested their scheme with a database of 106 thick-slice (10 mm) screening LDCT scans of 73 patients with 109 cancers, and they achieved a sensitivity of 83 % with 5.8 FPs per case in a validation test (or a leave-one-patient-out test for LDA). Farag et al. [32] developed a template-modeling approach that uses level sets for classification. They achieved a sensitivity of 93.3 % with an FP rate of 3.4 % for a database of thin-slice screening LDCT scans of 16 patients with 119 nodules and 34 normal patients. Ge et al. [36] incorporated 3D-gradient field descriptors and ellipsoid features in LDA for classification. They employed Wilks’ lambda stepwise feature selection for selecting features before the LDA classification. They achieved a sensitivity of 80 % with 14.7 FPs per case for a database of 82 thin-slice CT scans of 56 patients with 116 solid nodules in a leave-one-patient-out test. Matsumoto et al. [79] employed LDA with eight features for classification. They achieved a sensitivity of 90 % with 64.1 FPs per case for a database of thick-slice diagnostic CT scans of five patients with 50 nodules in a leave-one-out test.
Yuan et al. [170] tested a commercially available CADe system (ImageChecker CT, LN-1000, by R2 Technology, Sunnyvale, CA; Hologic now). They achieved a sensitivity of 73 % with 3.2 FPs per case for a database of thin-slice (1.25 mm) CT scans of 150 patients with 628 nodules in an independent test. Pu et al. [93] developed a scoring method based on the similarity distance of medial axis-like shapes for classification. They achieved a sensitivity of 81.5 % with 6.5 FPs per case for a database of thin-slice screening CT scans of 52 patients with 184 nodules, including 16 nonsolid nodules. Retico et al. [94] used a voxel-based neural approach (i.e., a class of the MTANN approach) with pixel values in a subvolume as input for classification. They obtained sensitivities of 80–85 % with 10–13 FPs per case for a database of thin-slice screening CT scans of 39 patients with 102 nodules. Ye et al. [163] used a rule-based scheme followed by a weighted SVM for classification. They achieved a sensitivity of 90.2 % with 8.2 FPs per case for a database of thin-slice screening CT scans of 54 patients with 118 nodules including 17 nonsolid nodules in an independent test. Golosio et al. [44] used a fixed-topology ANN for classification, and they evaluated their CADe scheme with a publicly available database from the Lung Image Database Consortium (LIDC) [8]. They achieved a sensitivity of 79 % with four FPs per case for a database of thin-slice CT scans of 83 patients with 148 nodules that one radiologist detected from an LIDC database in an independent test.
Murphy et al. [86] used a k-nearest-neighbor classifier with features selected from 135 features for classification. They achieved a sensitivity of 80 with 4.2 FPs per case for a large database of thin-slice screening CT scans of 813 patients with 1,525 nodules in an independent test. Tan et al. [143] developed a feature-selective classifier based on a genetic algorithm and ANNs for classification. They achieved a sensitivity of 87.5 % with four FPs per case for a database of thin-slice CT scans of 125 patients with 80 nodules that four radiologists agreed from the LIDC database in an independent test. Messay et al. [80] developed a sequential forward selection process for selecting the optimum features for LDA and quadratic discriminant analysis (QDA). They obtained a sensitivity of 83 % with three FPs per case for a database of thin-slice CT scans of 84 patients with 143 nodules from the LIDC database in a sevenfold cross-validation test. Riccardi et al. [95] used a heuristic approach based on geometric features, followed by an SVM for classification. They achieved a sensitivity of 71 % with 6.5 FPs per case for a database of thin-slice CT scans of 154 patients with 117 nodules that four radiologists agreed on from the LIDC database in a twofold cross-validation test.
Thus, various approaches have been proposed for CADe schemes for lung nodules in CT. Sensitivities for the detection of lung nodules in CT range from 70 to 95 %, with from a few to 70 FPs per case. Major sources of FPs are various-sized lung vessels. Major sources of false negatives are ground-glass nodules, nodules attached to vessels, and nodules attached to the lung wall (i.e., juxtapleural nodules). Ground-glass nodules are difficult to detect, because they are subtle, are of low contrast, and have ill-defined boundaries. The MTANN approach was able to enhance and thus detect ground-glass nodules [121]. The cause of false negatives due to vessel-attached nodules and juxtapleural nodules is mis-segmentation and thus inaccurate feature calculation. Because the MTANN approach does not require segmentation or feature calculation, it was able to detect such nodules [121].
7.4.2.2 Illustration of a CADe Scheme
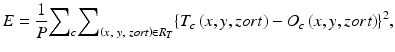
Figure 7.4a illustrates an axial slice of a CT scan of the lungs with a lung cancer. The lung cancer on the CT image is the target that we want to detect with a CADe scheme. As shown in the flowchart in Fig. 7.1, the first step in a CADe scheme is segmentation of the organ of interest, in this case, the lungs. For a high-contrast image with a stable gray scale over different patients like the lung CT image, thresholding often works. To avoid missing nodules attached to the lung walls, mathematical morphology operations are often performed. Figure 7.4b illustrates lung segmentation by simple thresholding followed by mathematical morphology filtering.
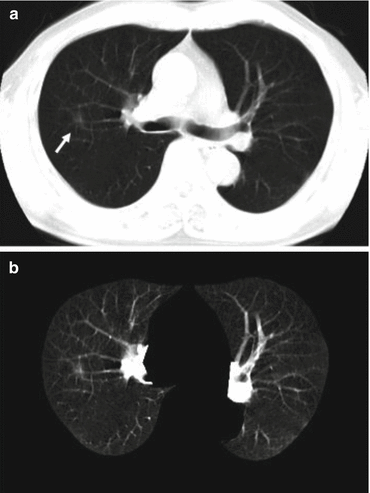
Fig. 7.4
(a) Axial slice of a CT scan of the lungs with a lung cancer (indicated by an arrow) and (b) a lung segmentation result
To improve the performance of CADe schemes, an optional step of enhancement of lesions is sometimes employed. Suzuki [111] developed a supervised “lesion enhancement” filter based on an MTANN for enhancing lesions and suppressing nonlesions in medical images. Figure 7.5b illustrates the enhancement of a lung nodule in a CT image by means of a trained MTANN lesion-enhancement filter for the original axial CT slice shown in Fig. 7.5a. In the output image, the lung nodule in the original CT image is enhanced, while normal structures such as lung vessels are suppressed substantially. Figure 7.5c shows the detection and segmentation result for the lung nodule by using simple thresholding followed by removal of small regions. After thresholding, connected-component labeling [49, 50, 127] was performed to calculate the area of each isolated region (i.e., connected component). By removing small regions, the lung nodule was detected correctly with no FP detection. By the use of the MTANN lesion-enhancement filter, the performance of the initial nodule candidate detection step was substantially improved from a 96 % sensitivity with 19.3 FPs per section to a 97 % sensitivity with 6.7 FPs per section.
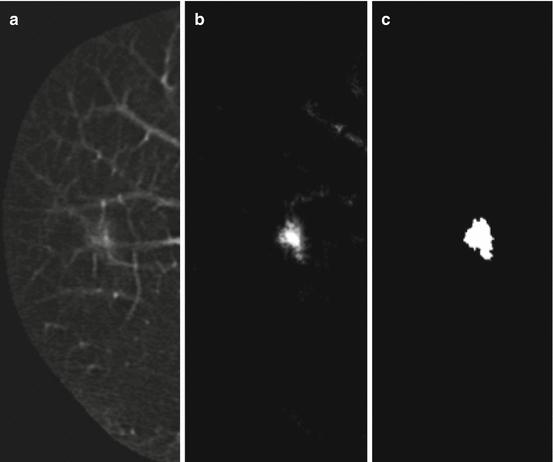
Fig. 7.5
Lesion enhancement by means of a supervised MTANN lesion-enhancement filter. (a) Original axial CT slice with a lung nodule. (b) Output image of the trained MTANN nodule-enhancement filter. In the output image (b), the lung nodule in the original CT image (a) is enhanced, whereas normal structures such as lung vessels are suppressed substantially. (c) Detection and segmentation of the nodule by using thresholding followed by removal of small regions
Morphologic and gray-level-based features such as contract, area, and circularity were calculated from the segmented nodule candidates. The extracted features were then inputted to a classifier (feature-based ML) to classify the candidates into nodules or non-nodules. At this stage, there were a lot of FPs (non-nodules) that the classifier had not been able to distinguish from nodules.
To reduce remaining FPs, Suzuki et al. developed an FP reduction technique based on MTANNs [121]. The architecture of the MTANN for FP reduction is shown in Fig. 7.6. For enhancement of nodules (i.e., true positives) and suppression of non-nodules (i.e., FPs) on CT images, the teaching image contains a distribution of values that represent the “likelihood of being a nodule.” For example, the teaching volume contains a 3D Gaussian distribution with standard deviation σ T for a lesion and zero (i.e., completely dark) for nonlesions, as illustrated in Fig. 7.6. This distribution represents the “likelihood of being a lesion”:
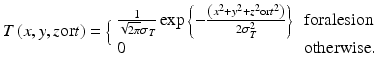
Fig. 7.6
Architecture of an MTANN for FP reduction. The teaching image for a lesion contains a Gaussian distribution; that for a nonlesion contains zero (completely dark). After the training, the MTANN expects to enhance lesions and suppress nonlesions
(7.4)
A scoring method is used for combining of output voxels from the trained MTANNs, as illustrated in Fig. 7.7. A score for a given region-of-interest (ROI) from the MTANN is defined as
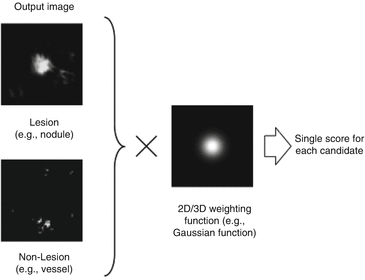
where
is a 3D Gaussian weighting function with standard deviation σ, and with its center corresponding to the center of the volume for evaluation, R E , and O is the output image of the trained MTANN, where its center corresponds to the center of R E . The use of the 3D Gaussian weighting function allows us to combine the responses (outputs) of a trained MTANN as a 3D distribution. A 3D Gaussian function is used for scoring, because the output of a trained MTANN is expected to be similar to the 3D Gaussian distribution used in the teaching images. This score represents the weighted sum of the estimates for the likelihood that the ROI (lesion candidate) contains a lesion near the center, i.e., a higher score would indicate a lesion, and a lower score would indicate a nonlesion. Thresholding is then performed on the scores for distinction between lesions and nonlesions.
Fig. 7.7
Scoring method for combining pixel-based output responses from the trained MTANN into a single score for each ROI
(7.5)
(7.6)
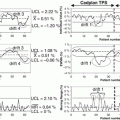
The MTANNs were trained to enhance lung nodules and suppress various types of FPs (i.e., non-nodules) such as lung vessels. Figure 7.8 shows the results of the enhancement of various lung nodules such as nonsolid (ground-glass), part-solid (mixed-ground-glass), and solid nodules (a) and those of the suppression of various-sized lung vessels (b). Figure 7.9 shows a free-response receiver operating characteristic (FROC) curve [13] indicating the performance of the trained MTANNs in the CADe scheme. With the MTANNs, the specificity of the CADe scheme was improved from 0.98 to 0.18 FPs per case without sacrificing the original sensitivity of 80.3 %.
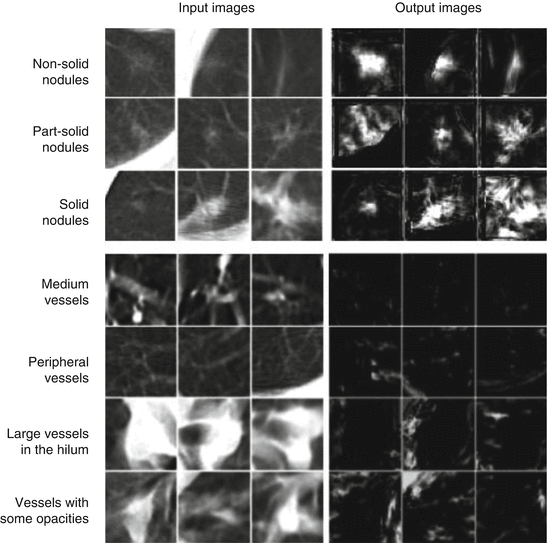
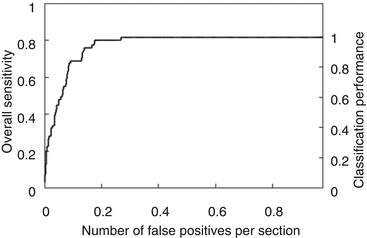
Fig. 7.8
Enhancement of lung nodules and suppression of FPs (i.e., lung vessels) by the use of MTANNs for FP reduction. Once lung nodules are enhanced, and FPs are suppressed, FPs can be distinguished from lung nodules by the use of scores obtained from the output images
Fig. 7.9
FROC curve indicating the performance of the FP reduction by MTANNs in a CADe scheme for the detection of lung nodules in CT. With the trained MTANNs, FPs were removed without any removal of true positives
Figure 7.10 shows an example of CADe outputs on a CT image of the lungs. A CADe scheme detected a lung nodule correctly with one FP which was a branch of the lung vessels.
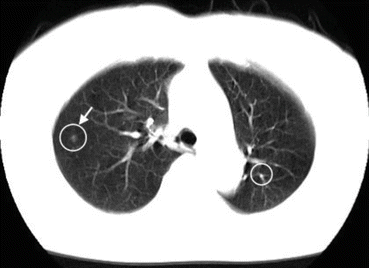
Fig. 7.10
CADe outputs (indicated by circles) on an axial CT slice of the lungs. A lung nodule (indicated by an arrow) was detected correctly by a CADe scheme with one FP detection (branch of lung vessels) on the right
7.4.3 CADe of Lung Nodules in CXR
Chest radiographs (CXRs) is the most commonly used imaging examination for chest diseases because they are the most cost-effective, routinely available, and dose-effective diagnostic examination [85, 173]. Because CXRs are widely used, improvements in the detection of lung nodules in CXRs could have a significant impact on early detection of lung cancer. Studies have shown that, however, 30 % of nodules in CXRs were missed by radiologists in which nodules were visible in retrospect. Therefore, CADe schemes [40, 144] for nodules in CXRs have been investigated for assisting radiologists in improving their sensitivity. A wide variety of approaches in CADe schemes for nodule detection in CXRs have been developed. Giger et al. developed a difference-image technique to reduce complex anatomic background structures while enhancing nodule-like structures for initial nodule candidate detection [37, 40]. Lo et al. used a technique similar to the difference-image technique to create nodule-enhanced images, which were then processed by a feature-extraction technique based on edge detection, gray-level thresholding, and sphere profile matching [70, 72]. Then a convolution neural network was employed in the classification step. Penedo et al. then improved the performance of the scheme by incorporating two-level ANNs that employed cross-correlation teaching images and input images in the curvature peak space [91]. Coppini et al. developed a CADe scheme based on biologically inspired ANNs with fuzzy coding [22]. Shiraishi et al. incorporated a localized searching method based on anatomical classification and automated techniques for the parameter setting of three types of ANNs into a CADe scheme [103].
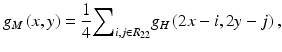
Studies showed that 82–95 % of the missed lung cancers in CXR were partly obscured by overlying bones such as ribs and/or a clavicle [9, 101]. To address this issue, Suzuki et al. [118, 120] developed a multiresolution MTANN for separation of bones such as ribs and clavicles from soft tissue in CXRs. They employed multiresolution decomposition/composition techniques [2, 106] to decompose an original high-resolution image into different-resolution images. First, one obtains a medium-resolution image g M (x, y) from an original high-resolution image g H (x, y) by performing downsampling with averaging, i.e., four pixels in the original image are replaced by a pixel having the mean value for the four pixel values, represented by
where R 22 is a 2-by-2-pixel region. The medium-resolution image is enlarged by upsampling with pixel substitution, i.e., a pixel in the medium-resolution image is replaced by four pixels with the same pixel value, as follows:
Then, a high-resolution difference image d H (x, y) is obtained by subtraction of the enlarged medium-resolution image from the high-resolution image, represented by
These procedures are performed repeatedly, producing further lower-resolution images. Thus, multiresolution images having various frequencies are obtained by the use of the multiresolution decomposition technique.
(7.7)
(7.8)
(7.9)
An important property of this technique is that exactly the same original-resolution image g H (x, y) can be obtained from the multiresolution images, d H (x, y) and g M (x, y), by performing the inverse procedures, called a multiresolution composition technique, as follows:
Therefore, we can process multiresolution images independently instead of processing original high-resolution images directly; i.e., with these techniques, the processed original high-resolution image can be obtained by composing of the processed multiresolution images. Each of multiple MTANNs only needs to support a limited spatial frequency rage in each resolution image instead of the entire spatial frequencies in the original image.
(7.10)
Related posts:
Stay updated, free articles. Join our Telegram channel

Full access? Get Clinical Tree


