(11.1)
where the left side of the equation is the rate of change of body energy stores with BW being the body weight and ρ being an energy density converting between units of metabolizable energy and mass. The right side is the energy imbalance between the body’s energy intake rate, EI, and the energy expenditure rate, EE. Any of the terms in the energy balance equation can depend on time, t, as well as other parameters. In particular, the three terms of the energy balance equation are highly interdependent [6]. In the following sections, I will describe the various components of the energy balance equation and some mathematical models that have been developed to represent each component.
Energy Storage and Body Composition
A simple translation between the energy imbalance and the rate of weight change in Eq. 11.1 occurs only if the energy density of the weight change, ρ, is a constant parameter. However, the body is composed of a variety of chemical constituents with widely varying energy densities. For example, fat has an energy density of about 9.4 kcal/g, whereas protein and carbohydrate have metabolizable energy densities of about 4.7 and 4 kcal/g, respectively [7]. Other major chemical constituents of the body (e.g., water and minerals) have energy densities of zero. Therefore, translating a given energy imbalance to a rate of weight change requires additional assumptions about the chemical composition of the weight change in terms of changes in body fat, protein, and glycogen along with associated fluid shifts.
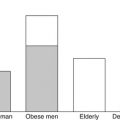
Figure 11.1a illustrates the composition body in terms of body fat and fat-free mass in example obese and lean men. [Women generally have a higher body fat content for the same weight and height, and computational modelling also accounts for sex differences in body composition and metabolism.] Obesity is characterized by a greatly expanded body fat mass, but also an increased amount of fat-free mass. Figure 11.1a also illustrates the chemical composition of the fat-free mass with water being its greatest component. The absolute masses of body protein and bone mineral are also increased in obesity. Glycogen and cellular solids, such as potassium and nucleic acids, contribute a very small fraction of the fat-free mass.
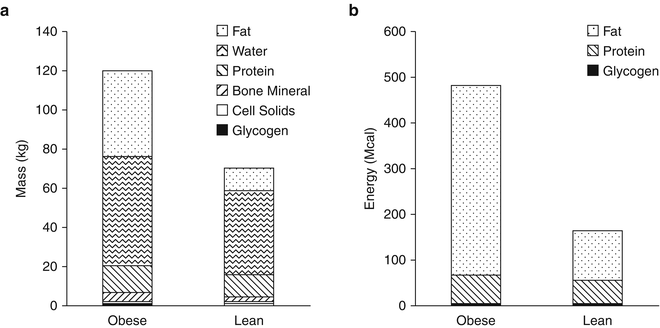

Fig. 11.1
Human body composition in example sedentary obese and lean men in terms of (a) their chemical composition and (b) their metabolizable energy storage
Body fat, protein, and glycogen comprise the stored energy of the body and these stores must be mobilized when the diet is insufficient to meet the body’s energy requirements. Figure 11.1b illustrates the composition of the body in terms of its energy content with fat stored in adipose tissue providing the overwhelming majority of the available stored energy, especially in obesity. Despite dietary carbohydrate typically providing the majority of the body’s energy demands on a daily basis, glycogen represents a relatively insignificant store of energy (~2,000 kcal). Body protein represents a substantial amount of energy, but in humans it is not a storage pool in the same sense as adipose tissue triglyceride. Rather, body proteins are functionally important and cannot be depleted by a significant fraction without serious complications and death. In contrast, fat stores represent a considerable energy reserve and body fat can be depleted to very low levels without substantial functional impairments [8, 9].
Long-term changes in body fat are accompanied by changes in lean tissue mass whose metabolizable energy density is significantly less than that of body fat [10]. To model these longer-term body composition changes, Forbes hypothesized that the proportion of weight change resulting from lean versus fat tissue is a nonlinear function of body fat [11, 12]. The Forbes hypothesis has since been extended and validated to demonstrate that ρ is a nonlinear function of the body composition [13–15]. Nevertheless, for small changes of weight from an initial baseline, it is valid to approximate the nonlinear Forbes curve with a line, and the resulting slope gives a value for ρ. For moderately overweight and obese individuals, the ρ = 3,500 kcal/lb (or 7,700 kcal/kg) is a reasonable approximation, but this value significantly overstates ρ for lean individuals [10].
Energy Partitioning Models
The energy balance equation (Eq. 11.1) can be written as a pair of equations for the changes in both lean tissue, L, and body fat, F:

Depending on assumptions about the chemical composition of lean mass changes, the corresponding energy density, ρ L , ranges between 1 and 1.8 kcal/g, and the energy density of fat, ρ F , is about 9.4 kcal/g [10]. The energy partition ratio, P, ranges between 0 and 1 and determines the proportion of an energy imbalance directed to and from lean versus fat mass.

(11.2)
Applying the Forbes hypothesis to the energy partition model reveals that P is a nonlinear function of F : P = C/(C + F) where C = 10.4 kg × ρ L /ρ F [13, 16]. The initial value of P can be quite diverse for individuals with very different fat mass. However, the nonlinearity of the Forbes body composition curve suggests that P is not a fixed parameter since it depends continuously on the fat mass, which can change considerably with large weight changes.
Macronutrient Balance Models
While energy-partitioning models use the concept of energy balance and a partitioning rule to constrain their behavior, a more physiologically detailed perspective considers the source of dietary energy in the form of carbohydrate, fat, and protein. The human body uses these three dietary macronutrients to both fuel metabolism and provide substrates for body constituents. The typical diet derives about 50 % of the energy from carbohydrate, 35 % from fat, and 15 % from protein [17]. However, these average diet proportions can vary widely from person to person and also from day to day. Complex physiological mechanisms maintain normal functioning of the body despite marked fluctuations of diet quantity and composition.
A computational model has been developed that quantitatively tracks the metabolism of all three dietary macronutrients and simulates how diet changes result in adaptations of whole-body energy expenditure, metabolic fuel selection, and alterations in the major whole-body fluxes contributing to macronutrient balance [18, 19]. The macronutrient balance model is mathematically represented by the following equations describing changes in the body’s energy stores of glycogen (G), fat (F), and protein (P):

where ρ C , ρ F , and ρ P are the energy densities of carbohydrate, fat, and protein, respectively. The macronutrient intake rates, CI, FI, and PI, refer to the metabolizable energy intake rates of dietary carbohydrate, fat, and protein, respectively. The rates of gluconeogenesis from amino acids and glycerol are indicated by GNG p and GNG f , respectively. The efficiencies of de novo lipogenesis, DNL, and ketogenesis, KTG, were represented by the parameters ε d and ε k , respectively. When the ketogenic rate increases, ketones are excreted in the urine at the rate KU excr . Some flux of carbohydrates are provided for the production of glycerol 3-phosphate, G3P, that is used in the synthesis of triglyceride. The oxidation rates, CarbOx, FatOx, and ProtOx, sum to the energy expenditure rate, EE, less than the small amount of heat produced via flux through ketogenic and de novo lipogenic pathways. Turnover of glycogen, fat, and protein and the corresponding energy costs are also included in the model.

(11.3)
The main model assumptions are that changes of the body’s energy stores are given by the sum of metabolic fluxes entering the pools minus the fluxes exiting the pools. Hence, the macronutrient metabolism model obeys the first law of thermodynamics, and the most recent version was developed using published human data from over 50 experimental studies and was validated by comparing model predictions with the results from several controlled feeding studies not used for model development [19]. To date, this is the only mathematical model of human metabolism to consider all three dietary macronutrients and accurately simulate the metabolic and body composition changes in response to diet and physical activity changes in a wide variety of subject groups.
The macronutrient imbalances between dietary intake and metabolic utilization underlie changes of stored fat, glycogen, and protein and result in changes in the chemical composition of the body [18, 19]. To account for body water shifts with diets that vary in both macronutrient and sodium content, the model also simulates intracellular and extracellular fluid changes. Thus, the macronutrient balance model leads to a detailed description of body composition dynamics, and the overall body weight change is just the sum of the individual changes in body constituents. Importantly, the macronutrient balance model does not rely on empirical relationships between body fat and lean tissue mass (such as the Forbes curve) and provides a more detailed molecular level description of body composition [20].
Energy Expenditure
For decades, weight-management professionals have used the energy balance equation (Eq. 11.1) to predict how body weight will change in response to a diet or physical activity intervention. Unfortunately, the vast majority of these calculations assumed that the energy expenditure rate, EE, was a static quantity and the resulting time course of weight change was therefore linear in time [21–23]. However, we now know that energy expenditure is a dynamic quantity that depends of a variety of factors and body weight predictions using the static assumption drastically overestimate weight change, especially over long time scales.
Improving body weight predictions requires a dynamic model of energy expenditure and its determinants. Figure 11.2 depicts the various components of energy expenditure in example sedentary lean and obese men. The obese man requires several hundred additional kcal/day to maintain his increased weight compared to the lean man. While this general dependence of weight on energy expenditure may be captured using a simple model of body weight alone, more realistic models have been developed that represent the dynamic changes in the various components of energy expenditure: the thermic effect of food, resting energy expenditure, and physical activity expenditure.
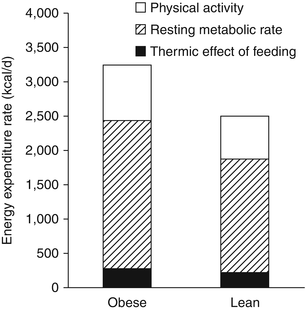

Fig. 11.2
Components of total energy expenditure in example sedentary obese and lean men
Thermic Effect of Food
The smallest component of the total energy expenditure rate in humans is the thermic effect of food (also sometimes called “diet-induced thermogenesis” or “specific dynamic action”) defined as the increase of metabolic rate observed for several hours following the ingestion of a meal. The thermic effect of food is believed to represent the energy cost of digestion and absorption as well as the storage and metabolic fate of dietary macronutrients [24]. While the precise mechanisms underlying the thermic effect of food are not fully understood, there is a clear dietary macronutrient hierarchy in the magnitude of the metabolic rate increase after feeding, with protein causing a greater increment than carbohydrate which is greater than that of fat. The computational model of macronutrient balance model accounts for this hierarchy [18, 19], but other energy balance and energy partition models ignore the macronutrient effect and assume that thermic effect of food is given by an overall proportion of energy intake, typically between 7 and 14 %.
Resting Energy Expenditure
The resting energy expenditure (REE) corresponds to the energy expended by the body when not performing physical work and is typically the largest contribution to the total energy expenditure rate. Contrary to popular belief, obese people generally have a higher absolute REE compared to lean people (see Fig. 11.2). Readily available clinical measures (e.g., sex, height, weight, and age) have been used along with REE measurements to generate empirical equations with REE being an increasing function of body weight, commonly a linear or a power law relationship. While several mathematical models of body weight dynamics have used this simplified approach to modelling REE [25–27], it has long been recognized that the main contributor to the REE is the fat-free mass since it comprises the metabolically active tissues of the body [28].
Fat-free mass is elevated in obesity along with the increased body fat mass (see Fig. 11.1) which also contributes a small amount to increased resting energy expenditure. The linear relationship between resting energy expenditure and fat-free mass is identical in obese and lean people [28, 29]. This means that the elevated resting energy expenditure in obesity is generally in line with what is expected for their body composition.
While fat-free mass, and to a lesser extent fat mass, are good predictors of REE, such models explain only about 70 % of interindividual REE variability such that for a given body composition the REE standard deviation is about 300 kcal/day [28, 29]. Since there is a large range of specific metabolic rates among various organs that contribute to the fat-free mass [30], some of this residual REE variability may be due to differences in organ masses. Magnetic resonance imaging methodologies have been used to quantify organ sizes, and using assumptions regarding the organ-specific metabolic rates, REE prediction equations that sum the individual metabolic rates of various organs explain about 80 % of the REE variability [31–33]. Thus, increasingly detailed knowledge of the body composition may improve REE predictions.
The computational model of macronutrient balance [19] incorporated how changes in the sizes of various organs affect REE, assuming linear relationships between changes of fat-free mass and various organ sizes based on cross-sectional data from 110 men and women with body mass index between 18 and 37 kg/m2 (D. Gallagher, personal communication). Of course, longitudinal organ mass changes with weight gain and loss need not follow the cross-sectional relationships, and this possibility requires experimental investigation.
Another potentially important contributor to REE dynamics may involve flux changes through various energy-requiring metabolic pathways. The major macronutrient fluxes of gluconeogenesis, de novo lipogenesis, triglyceride synthesis, and protein turnover all affect energy expenditure, and these flux rates can be significantly influenced by both the energy content of the diet as well as the diet composition. For example, the breakdown and resynthesis of body fat requires 8 molecules of adenosine triphosphate [ATP] per molecule of triglyceride [34], and the flux through this pathway is strongly influenced by dietary carbohydrate via insulin’s inhibition of lipolysis. Similarly, protein synthesis requires 4 ATP per peptide bond plus 1 ATP for amino acid transport [35]. Such energy-requiring metabolic fluxes may explain the observed energy cost of tissue deposition that is especially important during growth and weight gain [36].
Physical Activity Expenditure
The physical activities of humans typically involve locomotion, and the energy costs are determined by the duration and intensity of physical activity in proportion to the overall body weight [37]. Thus, obese and lean people can have similar daily energy costs for physical activity despite obese people typically being less active. With weight loss, it costs less energy to perform most physical activities, and therefore, the physical activity expenditure typically decreases unless the quantity or intensity of physical activity increases to compensate.
Mathematical models of human energy expenditure include the body weight effect on physical activity expenditure. Some models further subdivide physical activity expenditure into volitional activities (e.g., exercise) and low intensity spontaneous physical activity or “non-exercise activity thermogenesis” (NEAT) [19, 26, 27].
Adaptive Thermogenesis and Metabolic Adaptation
During active weight loss, both REE and total energy expenditure have been observed to decrease to an extent greater than expected based on the measured body weight and composition changes [38–42]. Furthermore, this increased energy efficiency appears to persist once energy balance is established at a lower body weight [43], although the magnitude of this persistent effect is smaller than during active weight loss and its existence has been controversial [44, 45]. Conversely, overfeeding and weight gain can result in highly variable increases of energy expenditure that can be greater than expected based on the observed weight gain [46, 47]. Collectively, these phenomena have been called “adaptive thermogenesis” [41, 48] or “metabolic adaptation” [49, 50].
The energy partition models of Hall et al. incorporated adaptive thermogenesis as an additive term that was a linear function of the change in energy intake from baseline [14, 22, 51]. In these models, the value of the adaptive thermogenesis parameter was chosen to match changes in overall energy expenditure measured before and after approximately stable weight loss [14]. When active weight loss is followed by subsequent weight stabilization, the change in energy intake required for the weight loss phase is greater than that required for weight stabilization at the reduced weight. Thus, modelling adaptive thermogenesis as a function of energy intake change has the natural consequence of decreasing energy expenditure more during situations of active weight loss compared to maintaining a stable lower weight, in agreement with observations [44].
Experimental quantification of the adaptive thermogenesis magnitude depends on the definition of the “expected values” for REE and total energy expenditure. Typically, cross-sectional regression equations are used to calculate the expected values using for REE and energy expenditure measurements derived either from baseline body composition data in the same subjects [40, 42, 50] or from a separate group of similar subjects [38, 39]. But such expected values for REE and energy expenditure ignore the possible changes in organ size distribution as well as changes in fluxes through energy-requiring metabolic pathways during over- or underfeeding described above. Whether such considerations can explain the observed changes in energy efficiency is unclear.
The computational model of macronutrient balance that accounts for alterations of energy-requiring metabolic fluxes as well as organ mass changes also required a model of adaptive thermogenesis to explain the observed average decrease in both REE and total energy expenditure with weight loss [18, 19]. Adaptive thermogenesis was modeled as a linear function of the reduction in energy intake below baseline and was used to suppress the metabolic rate of all organs as well as reduce the energy expended in spontaneous physical activity. The mechanistic basis of such a metabolic adaptation is unclear but may be related to reduced sympathetic drive or blunted thyroid activity, possibly as a result of decreased circulating leptin [41, 49, 52–55].
Figure 11.3 shows the computational model simulation of the classic results of Leibel et al. [40] whose metabolic ward study provided obese subjects with an 800 kcal/day liquid formula diet until subjects had lost 10 % of their initial weight, after which the energy intake of the liquid formula was increased to achieve weight stability for at least 2 weeks. After measuring body composition and energy expenditure during weight maintenance at 10 % weight loss, subjects were returned to the 800 kcal/day diet until 20 % weight loss when the energy intake was again increased to stabilize body weight and make final measurements. Figure 11.3a illustrates the simulated dynamic changes in both total and resting energy expenditure in the solid and dashed curves, respectively. Without adjusting any model parameters (other than the initial conditions to match the baseline data), the model accurately reproduced the average energy expenditure data and demonstrated the highly dynamic nature of the metabolic adaptations. Both resting and total energy expenditure rapidly decreased following the onset of the reduced energy diet but increased after body weight stabilized at a lower level, albeit at a value that was significantly lower than the expenditure rate prior to weight loss. Figure 11.3b illustrates that the computational model also correctly simulated the observed body composition changes observed by Leibel et al. [40] based on the calculated macronutrient and water imbalances that accumulated over the course of the study.
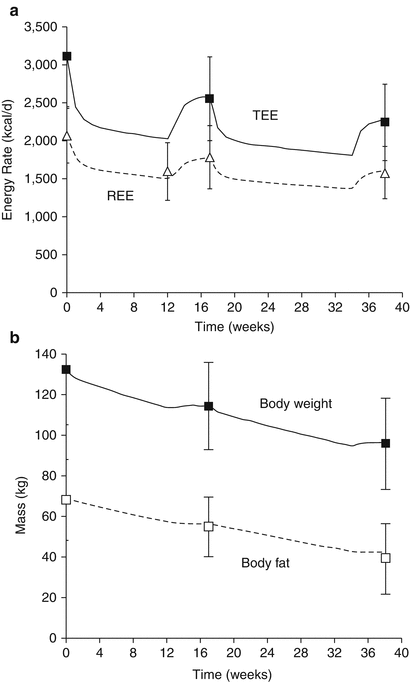

Fig. 11.3
Computer simulations of the study by Leibel et al. [40] using the model of Hall [19] illustrating (a) dynamic changes in total energy expenditure (TEE) and resting energy expenditure (REE) during weight loss and (b) body weight and body fat dynamics. The curves are the model predictions and the data points represent the mean ± SD
Energy Intake
Human eating behavior is extraordinarily complex. Eating behavior is determined by dynamic interactions between homeostatic, hedonic, and cognitive processes. Our cognitive choices about when to eat are modulated by homeostatic hunger as well as the availability of food, the social context, our response to environmental food cues, and our habitual eating times. Food choice and how much we eat are also under cognitive control but strongly influenced by appetite, food variety, portion size, social context, habits, satiety, and the reward value of the food. Homeostatic hunger enhances, and satiety attenuates, both food and nonfood rewards and activation of hedonic circuits may override homeostatic satiety signals thereby facilitating eating in the absence of physiological hunger. We are only now beginning to understand this system, and quantitative mathematical models of these processes have not yet been developed in humans. A major barrier to the development of quantitative models of food intake is our current inability to make accurate measurements of this variable on the relevant time scale for addressing the question of obesity and its treatment [56].
Relevant Time Scale of Energy Intake
Human weight change and the development of obesity is a slow process. Mathematical modelling can be used to quantify the relevant time scale, and any model of human energy metabolism and body weight change can be linearized around a baseline body weight value, BW 0, to yield:

where ΔEI is the change in energy intake from an energy-balanced baseline,  is the effective energy density of the weight change, the time constant,
  , sets the characteristic time scale of the system, and the parameter ε defines how energy expenditure depends on the weight change [22]. Using typical model parameter values, the characteristic time scale is approximately 1 year. This means that a step change in energy intake takes several years to fully play out and result in a new steady-state body weight. Furthermore, the long time scale implies that measuring short-term changes in energy intake in laboratory settings are of limited utility for understanding the natural development of obesity or its treatment.

(11.4)
 is the effective energy density of the weight change, the time constant,
  , sets the characteristic time scale of the system, and the parameter ε defines how energy expenditure depends on the weight change [22]. Using typical model parameter values, the characteristic time scale is approximately 1 year. This means that a step change in energy intake takes several years to fully play out and result in a new steady-state body weight. Furthermore, the long time scale implies that measuring short-term changes in energy intake in laboratory settings are of limited utility for understanding the natural development of obesity or its treatment.
Measuring Long-Term Energy Intake
Given the importance of long-term energy intake on determining body weight change in humans, it is unfortunate that this variable is so difficult to measure in free-living conditions [56–58]. While the doubly labeled water method is the gold standard for estimating the average rate of carbon dioxide production, this measurement is expensive and must be combined with assumptions about average metabolic fuel mix and measurements of body composition changes to calculate an estimate of average free-living energy intake [59]. Recently, dynamic mathematical models have begun to tackle the important problem of estimating changes in human free-living energy intake.
Jordan et al. demonstrated how a dynamic mathematical model can be used to quantitatively integrate longitudinal body composition data with repeated doubly labeled water measurements to calculate dynamic estimates of average free-living energy intake, energy expenditure, as well as the respiratory quotient [60]. Furthermore, the study demonstrated how variability in the experimental measurements [the model inputs] influenced the calculated time courses of energy intake, energy expenditure, and respiratory quotient [the model outputs]. While this model was applied to data from growing infants over their first 2 years of life [61, 62], the methodology is equally applicable to weight gain or loss data in adults.
In the absence of doubly labeled water or body composition data, Hall et al. proposed a method for calculating changes in adult energy intake using only repeated body weight measurements along with a dynamic mathematical model of adult energy metabolism and body composition change [19, 22, 51, 63]. Hall et al. have recently used such methods to help interpret the results of outpatient weight loss interventions [19, 22]. Such programs ubiquitously result in a period of weight loss that plateaus after about 6–8 months and often followed by slow weight regain [64, 65]. Using the longitudinal measurements of body weight, Hall et al. applied different mathematical models to estimate the changes of free-living energy intake underlying the typical weight loss, plateau, and regain trajectory. The conclusion was that the plateau was primarily due to a short-lived adherence to the diet intervention that was progressively relaxed to return to the pre-intervention level within the first year thereby leading to slow regain in subsequent years. Slowing of metabolic rate was found to play a secondary role in the weight plateau and regain trajectory. This interpretation differs markedly from the usual explanation that focuses on metabolic slowing as the prime culprit responsible for weight plateaus within the first year of an intervention [64, 66].
While calculating the free-living energy intake of groups over time is useful for data interpretation, predicting individual energy intake changes would be extremely valuable for assessing diet adherence during a weight loss program. Hall and Chow recently introduced a relatively simple methodology for using longitudinal weight measurements to estimate energy intake changes along with an explicit calculation of the confidence interval of the estimate, a useful metric for assessing individual diet adherence [63].
Computational Models of Mouse Metabolism and Body Weight Dynamics
Mouse models have proven to be particularly insightful for identifying molecular mechanisms of body weight regulation, and mouse models are routinely used in preclinical investigation of novel obesity therapeutics. But it is often unclear whether any observed body weight changes are the result of altered energy intake, expenditure, or both. While accurate and frequent measurements of food intake and weight change in mice can be performed over extended time periods, the same cannot be said of energy expenditure measurements. Rather, expensive indirect calorimetry systems are increasingly being used to measure energy expenditure and respiratory exchange over periods of a few days, but the mice are typically removed from their normal environment which can alter their behavior [67]. For example, the indirect calorimetry procedure can cause weight loss in mice that had previously been gaining weight in their home cages [68].
Guo et al. developed a mathematical method based on the law of energy conservation that used the measured body weight and food intake changes as model inputs to calculate the underlying energy balance and fuel selection dynamics [69]. The model predicted daily energy output, RQ, and net fat oxidation during the development of obesity and weight loss in male C57BL/6 mice consuming various ad libitum diets over several weeks while mice were housed in their home cages. Such methods will likely become increasingly important as the challenges of indirect calorimetry in mice are more widely recognized.
Stay updated, free articles. Join our Telegram channel

Full access? Get Clinical Tree


