Fig. 3.1
Discounted costs and discounted life-years gained per 1000 65-year-olds for 14 CRC screening strategies including two strategies for CT-colonography (CTC)* and the efficient frontier connecting the efficient strategies—Microsimulation Screening Analysis (MISCAN) model. (*The two CTC strategies are not competing options; they represent a range of estimates of CTC test characteristics. They are shown here together for comparison purposes only. The incremental cost-effectiveness ratios (ICERs) are assessed separately using each CTC strategy in turn)
For a quantitative comparison of LYGs per cost for multiple strategies, we ranked the screening strategies by increasing effectiveness (i.e., discounted number of LYGs compared with no screening) from annual Hemoccult II with the lowest life years saved to flexible sigmoidoscopy with biopsy every 5 years plus annual FIT and compared their life years saved relative to the cost of the strategy. In Fig. 3.1, for the plot of costs versus LYGs , the black line links the strategies with the most LYGs relative to a given level of costs and is called the efficient frontier. These strategies represent the set of efficient options and include Hemoccult II, Hemoccult SENSA, flexible sigmoidoscopy with biopsy and annual Hemoccult SENSA, and flexible sigmoidoscopy with biopsy and annual FIT. Strategies which are more costly and less effective (fewer LYGs) than another strategy are below the efficient frontier and are considered dominated by the more efficient strategies. These dominated strategies include FIT, sigmoidoscopy alone, four of the flexible sigmoidoscopy and FOBT combinations, colonoscopy , and CTC. However, the only strategies relatively far off the efficient frontier (i.e., a dominated strategy) are flexible sigmoidoscopy alone and two strategies for CTC. The other dominated strategies (including colonoscopy) are close to that of the efficient frontier and could be considered in the set of acceptable cost-effective screening options. Based on this analysis, Hemoccult II and flexible sigmoidoscopy are less attractive screening options because of the lower LYGs with Hemoccult II and the lower LYGs as well as the higher costs per LYG than other options with flexible sigmoidoscopy . CTC also is a less attractive strategy with higher costs than other strategies which provide comparable or higher LYGs at lower costs (when the CTC cost is at US$ 488 per test as initially considered).
This cost-effective analysis is also used to visualize and quantify the increase in costs per LYG when moving from one efficient strategy to the next highest strategy. The slope of the efficient frontier changes markedly going from Hemoccult II to the Hemoccult SENSA strategy. Then there is a relatively flat line with only slight increase in life years saved relative to increasing costs for the remaining strategies. The inverse of the slope is used as the measure of the relative performance of the efficient strategies and is the ICER , defined as the additional cost of a specific strategy, divided by its additional clinical benefit, compared with the next least-expensive strategy. Those strategies on the flat of the efficient frontier curve represent diminishing returns of effectiveness per expenditure [55].
The two strategies (DoD and ACRIN) for CTC are far from the efficient frontier in Fig. 3.1 when using a cost of US$ 488 per scan (i.e., when the CTC cost was just below that used for colonoscopy without polypectomy (US$ 498)). Knudsen used threshold analysis to determine that the cost for CTC would need to be US$ 108 (for NCTC) and US$ 122 (for DoD) per test in the 65-year old cohort to place the CTC strategy on the efficient frontier of strategies (i.e., thus cost-effective) relative to the LYGs with the CTC strategy [54, 56]. In a previous analysis using slightly different CTC test characteristics, Lansdorp-Vogelaar [57] determined that CTC would need to be at a cost approximately 40 % lower per scan than colonoscopy procedure with referral of CTC lesions 6 mm or larger and repeat CTC every 5 years to be cost-effective (and on the efficient frontier). These results are largely consistent with that of Knudsen [54].
In an alternative analysis, Knudsen [54] showed if individuals who would not be screened otherwise would agree to be screened with CTC, the threshold costs for CTC would be US$ 204 (for NCTC) and US$ 293 (DoD) for a 10 % increase in relative adherence for CRC screening and would be US$ 435 (NCTC) and US$ 547 (DoD) for a 25 % relative increase for CRC screening.
Example of Decision Analysis for Choice of Age to End CRC Screening Strategies in the Elderly
Original Decision Analysis for CRC Screening for the USPSTF in 2008
In 2008, the USPSTF requested a decision analysis to evaluate a range of CRC screening tests with respect to age to begin, age to end, and intervals of screening to inform their decision of which screening tests and which screening scenarios to recommend. Long-term outcomes were LYGs with different screening strategies as obtained from the microsimulation modeling groups of the NCI-sponsored CISNET. These LYGs compared to no screening (the benefit) were balanced against the number of colonoscopies required per strategy. The number of colonoscopies required per scenario represents both resource use and risk of complications of colonoscopy of perforation or major bleeds requiring hospitalization in an asymptomatic average-risk population. In the average-risk population, the screening strategies considered were three ages to begin screening (40, 50, and 60), two ages to end screening (75 and 85), and three intervals of rescreening for those with no prior findings (5, 10, 20 years for endoscopy and 1, 2, 3 years for FOBTs). Tests considered were colonoscopy, flexible sigmoidoscopy with and without a FOBT, and gFOBT alone and FIT alone [58].
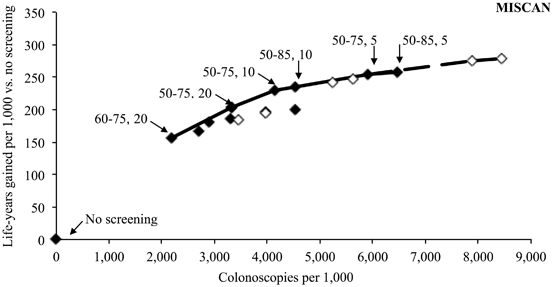
The results from the MISCAN CISNET model for the colonoscopy strategies are given in Fig. 3.2 [58]. The LYGs are plotted on the y-axis against the number of colonoscopies (screening and surveillance) required for each scenario on the x-axis. LYGs increase with increasing colonoscopy resource use. However, there is an inflection point between a strategy of beginning screening at age 50 and stopping at age 75 with a 10-year interval and that of beginning at age 50 but stopping at age 85 with a 10-year interval. This inflection point represented where additional resource use (colonoscopy) did not provide for an appreciable benefit of more LYGs . It is this kind of analysis that can provide an understanding of how to balance the benefits compared to the risks.


Fig. 3.2
Life years gained per 1000 screened with different strategies of colonoscopy by number of colonoscopies per 1000 required per strategy. Results from the MISCAN model. (Based on data from Ref. [58])
Based on consistent findings for the small increase in LYGs with extending screening to age 85 rather than stopping at age 75 for the strategies of colonoscopy, FIT, gFOBT, and flexible sigmoidoscopy with an FOBT, the USPSTF recommended that CRC screening should be conducted in the average risk population from age 50 to 75. However, the USPSTF recommended against routine screening to continue in persons older than 75 years with an adequate screening history because the benefits of continuing screening from age 50 to 85 instead of 75 years do not justify the additional colonoscopies required [4]. However, this USPSTF recommendation to stop routine screening in those with consistent screening with negative findings was misunderstood by many to mean stop at age 75 regardless of past screening history or lack thereof [59].
Decision Analysis for What Age to End CRC Screening in the Elderly in Those with no Prior Screening
To address this issue, a recent microsimulation modeling study assessed up to what age (76–90) CRC screening should be considered in elderly persons without previous screening and to determine which screening test—colonoscopy, sigmoidoscopy, or FIT—applied just at one time would be indicated and at what age [60]. The study first determined that the effectiveness of CRC screening in unscreened elderly persons declined with increasing age, and by age 90, there was net harm (loss of QALYS) in screening. Furthermore, the cost-effectiveness of screening versus no screening increased rapidly with increasing age. The next step was to assess theACER as to when the screening strategy exceeded a threshold of US$ 100,000 per QALY which used the assumption that a benefit costing less than US$ 100,000 per QALY was acceptable to society.
The optimal strategy of choice of screening test was that screening test strategy that was the most effective (i.e., most LYGs) and still cost-effective within the US$ 100,000 threshold (Table 3.1). This was determined for each age 76 and older and for each comorbidity level. The age to which screening should be considered declined by comorbidity status—up to age 86 for those with no comorbidity, up to age 83 with moderate comorbidities, and only up to age 80 for those with severe comorbidities. Also colonoscopy , as the screening test of choice, would stop 3 years earlier than the maximum stopping per comorbidity; i.e., stop any CRC screening at age 86 for those with no comorbidities but colonoscopy would be the screening test of choice only up to age 83.
Table 3.1
Summary of age to stop initiating colorectal cancer screening for elderly persons without prior screening by level of comorbidity and type of screening test (colonoscopy, flexible sigmoidoscopy, or fecal immunochemical test). (Reprinted from Ref. [60]. With permission from American College of Physicians)
Comorbidity status | Up to what age should CRC screening be considered? | Which screening strategy is indicated at what age? | ||||||||||
|---|---|---|---|---|---|---|---|---|---|---|---|---|
Age | ||||||||||||
76 | 77 | 78 | 79 | 80 | 81 | 82 | 83 | 84 | 85 | 86 | ||
No comorbidity | 86 | COL | COL | COL | COL | COL | COL | COL | COL | SIG | FIT | FIT |
Moderate comorbidity | 83 | COL | COL | COL | COL | COL | SIG | FIT | FIT | |||
Severe comorbidity | 80 | COL | COL | SIG | FIT | FIT | ||||||
Summary
Effectiveness, comparative effectiveness, and cost-effectiveness analyses are key components to Donabedian’s vision for attributes of quality of health care as conceived in 1992 [9]. He advocated for effectiveness for improvements in health with the best care, efficiency to lower the cost without diminishing the improvements in health, optimality to balance costs against improvements in health, and acceptability that the treatment conforms to the desires of the patient. His last two advocacies are that such health care have legitimacy for social preferences and ethical principles and finally that there be equity for all within our population. The Gastroenterology community (GI) community has been well versed in these principles. The original Multi-Society Task Force led by Winawer et al. in 1997 [10] recognized the need for comparative effectiveness which took into account acceptability to patient and improvement of tests. Now, more than 20 years later, the methodologies to achieve such analysis and examination of these issues are more robust and widely known and applied.
Eisenberg [61] in 1989 had connected clinical economics as first and foremost to be based on the use of medical services in the encounter between clinician and patient. He stated the a cost-effectiveness analysis incorporates both cost and effect and measures the net cost of providing a service (expenditures minus savings) as well as the outcomes obtained. The advantage of cost-effectiveness analysis is that it considers the possibility of improved outcomes in exchange for the use of more resources. Sox [62] in 2010 listed seven principles for comparative effectiveness research of (1) allowing decision makers to make informed decisions; (2) providing information on benefits, harms, costs, and logistics of different policies; (3) comparing across a broad range of interventions; (4) directly comparing tests “head-to-head”; (5) assessing patient-relevant outcomes as well as economic implications; (6) identifying patient characteristics of meaningful outcomes; and (7) including new and old data as well as systematic reviews of existing research.
In this chapter, we have provided current examples of studies of effectiveness, comparative effectiveness , and cost-effectiveness. Overall, the currently recommended CRC screening strategies of FIT, flexible sigmoidoscopy with FIT, and colonoscopy are all cost-effective strategies. CRC screening can also be cost saving as the use of biological increases for advanced disease [50]. We find that we must balance the effectiveness of screening tests with the resources required to deliver population-based screening with such tests. We also have presented examples of how using cost-effectiveness analysis with a common denominator of costs can be used to identify and quantify the balance between benefit and excess risk within the context of availability of screening resources. Given the large impact that CRC screening can have to reduce CRC mortality, it is imperative that we continue to assess what are the CRC screening options that can provide the greatest impact for the population and most efficiently use our medical resources.
Acknowledgments
This work is supported in part from the following grants: U01 CA-152959, U01 CA-151736, U54 CA-163262, and R01 CA-079572.
References
1.
Siegel R, Desantis C, Jemal A. Colorectal cancer statistics, 2014. CA: Cancer J Clin. 2014;64(2):104–17.
2.
Edwards BK, Ward E, Kohler BA, Eheman C, Zauber AG, Anderson RN, et al. Annual report to the nation on the status of cancer, 1975–2006, featuring colorectal cancer trends and impact of interventions (risk factors, screening, and treatment) to reduce future rates. Cancer. 2010;116(3):544–73.CrossRefPubMedCentralPubMed
Stay updated, free articles. Join our Telegram channel

Full access? Get Clinical Tree


