Commissioning and Quality Assurance
Jacob Van Dyk
Introduction
Quality assurance (QA) is “all those planned and systematic actions necessary to provide adequate confidence that a product or a service will satisfy given requirements for quality” (1). In radiation therapy, this has been defined by the World Health Organization as “all those procedures that ensure consistency of the medical prescription and the safe fulfillment of that prescription as regards to the target volume, together with minimal dose to normal tissue, minimal exposure of personnel, and adequate patient monitoring aimed at determining the end result of treatment” (2). Quality control (QC) is “the regulatory process through which the actual quality performance is measured and, compared to existing standards and finally the actions necessary to keep or regain conformance with the standards” (1). In the context of radiation therapy, commissioning means preparing a procedure or a technology for clinical use, whether it be a radiation treatment planning system (TPS), a CT simulator, a radiation treatment machine, a computerized clinical radiation information system, or a new treatment technique such as intensity-modulated radiation therapy (IMRT). Quality management, as the words imply, refers to all management issues of the quality process. Quality management must be initiated and continuously encouraged from the top-down and must infiltrate the entire management structure of the organization for it to work successfully.
There are two main considerations for a QA process in radiation therapy. The first is to assure that the radiation treatment is delivered accurately according to the dose-volume prescription provided by the radiation oncologist. The second consideration relates to patient safety and the avoidance of treatment errors.
Figure 11.1 is a block diagram of the many steps in the process of radiation treatment. To ensure accuracy of prescription and the fulfillment of treatment intent, a rigorous program of QA is required at all stages of the radiation treatment process. The shaded region of the figure highlights the stages that relate specifically to treatment planning. Virtual simulation combined with the use of computerized TPS for dose computation and technique optimization is standard practice in the modern radiation therapy department. The extent of their use continues to vary dramatically from simple calculations of dose distributions on two-dimensional (2D) external patient contours to very complex three-dimensional (3D) treatment planning with the use of various types of patient-specific image data. Recent developments in automated optimization (3), beam intensity modulation (4), the use of a variety of imaging modalities (5), and the inclusion of biological parameters (6) to calculate tumor control probabilities (TCP) and normal tissue complication probabilities (NTCP) have added dramatically to the complexity of the modern TPS. Figure 11.2 is a block diagram adapted from the joint scope of practice document from the American Association of Physicists in Medicine (AAPM) and the American Society for Radiation Oncology (ASTRO) representing the steps of the RT process for modern practice using IMRT (7).
As indicated above, the process of preparing the patient for radiation therapy includes many steps. Uncertainties or errors in any step of the process can have a dramatic effect on outcome, be they related to the control of the disease or to complications as a result of inappropriate treatment. The overall need for QA in radiation therapy is well defined (2,8,9,10). Although the specific needs for QA of treatment planning computers are described in a number of reports (11,12,13), the actual implementation of QA procedures is more ambiguous. Very comprehensive reports on treatment planning QA have been developed by the AAPM (14) and, more recently, by the International Atomic Energy Agency (IAEA) (15,16,17). This chapter addresses issues related to the use of treatment planning computers in the context of purchase, acceptance testing, commissioning, and routine clinical application. Although the emphasis is on commissioning and QC, there is also some discussion on QA of the total treatment planning process. The intent of this chapter is to be as generic as possible so that it applies to both conventional and more sophisticated radiation treatment techniques; however, because of page limitations, details for specialized techniques are confined to references where indicated. The use of IMRT has now become quite routine in a significant number of departments and is no longer considered a special technique. While the general QA and QC principles described here also apply to IMRT, more details can be found in references (3,4,7,18,19).
Historical Perspective
Publications on computer applications in radiation therapy date back to 1951, when Wheatley (20) produced an analog
computer to perform “dosage estimation of fields of any size and any shape.” The prime purpose was to relieve the tedium associated with dosage calculations (21). It appears that computers were used in radiation therapy as early as in any other field of medicine. Tsien (22) has been credited with being the first in the application of “automatic computing machines to radiation treatment planning.” Also, during the past 60 years, there has been an enormous technological evolution of computer technology, including microcomputers, large time-sharing systems, minicomputers, graphics workstations, and today’s desktop personal computers, as well as laptops, handhelds, and tablets. During each phase of development, computers provided treatment planners with faster and more sophisticated capabilities for dosage calculations, better image and graphical displays, and improved automated optimization capabilities.
computer to perform “dosage estimation of fields of any size and any shape.” The prime purpose was to relieve the tedium associated with dosage calculations (21). It appears that computers were used in radiation therapy as early as in any other field of medicine. Tsien (22) has been credited with being the first in the application of “automatic computing machines to radiation treatment planning.” Also, during the past 60 years, there has been an enormous technological evolution of computer technology, including microcomputers, large time-sharing systems, minicomputers, graphics workstations, and today’s desktop personal computers, as well as laptops, handhelds, and tablets. During each phase of development, computers provided treatment planners with faster and more sophisticated capabilities for dosage calculations, better image and graphical displays, and improved automated optimization capabilities.
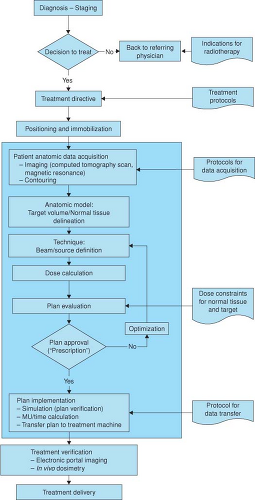 Figure 11.1. Schematic flowchart of the steps in the total radiation therapy process. The shaded region emphasizes those steps specifically associated with treatment planning and the use of the TPS. (Adapted from Van Dyk J, Rosenwald J-C, Fraass B, et al. Commissioning and quality assurance of computerized planning systems for radiation treatment of cancer. IAEA TRS-430. Vienna: International Atomic Energy Agency, 2004, with permission.) |
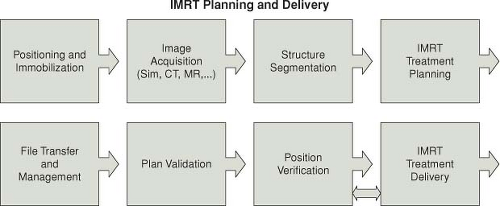 Figure 11.2. The overall process of IMRT planning and delivery. (Adapted from Ezzell GA, Galvin JM, Low D, et al. Guidance document on delivery, treatment planning, and clinical implementation of IMRT: report of the IMRT Subcommittee of the AAPM Radiation Therapy Committee. Med Phys 2003;30:2089–2115, with permission.) |
The advances in computer technology led to a revolution of diagnostic imaging during the 1970s that provided a further breakthrough for radiation therapy planning. Until then, it was difficult both to localize the tumor with any kind of accuracy and to provide accurate dose calculations accounting for patient-specific tissue densities. With the advent of computed tomography (CT) it became possible for the first time to derive in vivo density information that could be incorporated into the dose calculation process. The combination of developments in computers and in diagnostic imaging resulted in much research, improving dose calculation procedures that accounted for the actual tissue composition of the patient. This, combined with sophisticated display techniques, allows the superposition of dose distributions on any anatomical plane within the human body.
Today, we are able to derive very precise 3D information from a variety of imaging modalities, including CT, magnetic resonance imaging (MRI), single photon emission computed tomography (SPECT), positron emission tomography (PET), digital angiography, and ultrasound (5,23). The superposition of the information from various imaging modalities has provided a tremendous tool to aid the radiation oncologist in target volume and normal tissue delineation. The routine use of multiple imaging modalities is increasing in availability and is no longer limited to academic institutions. CT has become the standard imaging procedure for therapy planning and is now readily available even in the smaller clinics, usually as CT simulators (24). The modern TPS allows the virtual simulation of the patient by the superposition of radiation beam geometries at any orientation on any image, thus allowing for full 3D treatment planning.
The evolution of these sophisticated technological developments can readily be followed by reviewing the proceedings of a series of international meetings on the use of computers in radiation therapy (25,26,27,28,29,30,31,32,33,34,35,36,37,38,39,40). The first of these was held in May 1966 in Cambridge, UK, and the 16th such meeting was held in 2010 in Amsterdam, the Netherlands. While the improvement in accuracy of dose calculations has always been an important component of these meetings, formal discussion on commissioning and QA has received only marginal attention. This is partly due to the nature of QA, which has historically not been considered a major area for high-powered research and partly due to an assumption that QA is something that all medical physicists do but no one really talks about. Admittedly, recent years have seen a formalization of QA activities for TPSs as demonstrated in the national and international reports (14,15,16,17,41,42,43,44) and textbook chapters (45,46) that have evolved. This chapter summarizes recent developments and recommendations associated with QA issues in radiation treatment planning, especially the implementation and clinical use of computerized radiation TPSs.
Development and Implementation of Treatment Planning Algorithms
The clinical implementation of treatment planning programs involves a number of steps. Some are under the control of the user, and some are not user-controlled
because they depend on software developed by others. The typical clinical implementation of treatment planning programs usually takes the following steps (Table 11.1).
because they depend on software developed by others. The typical clinical implementation of treatment planning programs usually takes the following steps (Table 11.1).
Table 11.1 Steps Involved in the Clinical Implementation of Treatment Planning Programs | |
|---|---|
|
Development of Calculation Algorithms
Dose calculation algorithms are based on the physics of radiation interactions within tissue. Because of the complexity of the physics of these types of interactions, the algorithms usually involve simplifications allowing the calculations to be completed fast enough to be useful to the treatment planner. These simplifications result in approximations to the complicated physics, and therefore the algorithms have inherent uncertainties and generally work well only over a limited range of conditions. Usually, the more complex algorithms handle the physics in more detail, but also require longer calculation times. The extreme example of this is Monte Carlo calculations, which can take hours to days, depending on the mode of treatment and the complexity of the plan, although recent commercial clinical versions for electron beams can be calculated in minutes (47) and photon beams from minutes to hours (48). To be practical, a clinical algorithm should generate dose distributions nearly in real time but usually in seconds. The details of the algorithm implemented on a given commercial TPS are not in the control of the user. The user’s choice of algorithms is limited to what is provided by the different manufacturers and ultimately to the algorithms supplied with the system purchased.
Development of the Computer Programs Implementing the Algorithms
Once a developer of a TPS has determined the nature of the algorithm, the algorithm must be coded into software. This software must include appropriate input–output routines, image display and manipulation routines, options that allow the user to define the treatment technique, and plan optimization and evaluation routines. The development of the software is not under the control of the user. It is the responsibility of the developer of the software to ensure that the algorithms are properly coded.
It is important for the user to have some knowledge of the nature of the dose calculation algorithms, since a knowledge at some level will help understand their capabilities and limitations. Furthermore, a basic knowledge will also help the user diagnose specific TPS problems and can be of some help in developing a QA process. A detailed description of different dose calculation algorithms can be found in Chapters 7 to 10. A broad overview of dose calculation algorithms has also been given by Van Dyk et al. (45) and a detailed report on external beam tissue inhomogeneity corrections for photon beams has been produced by AAPM Task Group 65 (49). In recognizing that the detailed description of algorithms was also beyond the scope of the IAEA TRS-430 (15), the report provides a series of questions that users may want to address either as part of the search process for a new TPS or in attempting to understand the calculation algorithm(s), currently available on their TPS. Thus, it includes 14 tables addressing different issues related to TPSs. To give an idea as to the subjects covered, the titles of these tables are summarized in Table 11.2. Table 11.3 is an example of one of the tables in IAEA TRS-430 (15) and shows questions related to external beam dose calculation algorithms in a water-like medium without any beam modifiers.
For brachytherapy, an interesting review of the evolution of treatment planning has been provided by Rivard et al. (50).
Determination of the Radiation Database Required by the Algorithms
All algorithms, even sophisticated Monte Carlo procedures, require a basic radiation data set as input. For the standard commercial TPS, these data are determined for each energy on each therapy machine in every radiation therapy department. The quality and accuracy of such data depend on the user of the TPS. Such data are always determined over a limited range of conditions. Thus, calculations that extend beyond the range of the original
measured data may be subject to question, depending on the extrapolation procedures used by the calculation algorithms. Furthermore, measured data have their own inherent uncertainties and depend on the type and size of detectors used and the care taken by the experimentalist to generate the data. The accuracy of the measured data also depends on the stability of the radiation therapy machine and its ability to yield the same kind of radiation characteristics from day to day and hour to hour.
measured data may be subject to question, depending on the extrapolation procedures used by the calculation algorithms. Furthermore, measured data have their own inherent uncertainties and depend on the type and size of detectors used and the care taken by the experimentalist to generate the data. The accuracy of the measured data also depends on the stability of the radiation therapy machine and its ability to yield the same kind of radiation characteristics from day to day and hour to hour.
Table 11.2 Titles of Tables in IAEA TRS-430 (15) Addressing Questions Associated with TPS Algorithms | ||||||||||||||||||||||||||||||
|---|---|---|---|---|---|---|---|---|---|---|---|---|---|---|---|---|---|---|---|---|---|---|---|---|---|---|---|---|---|---|
|
Table 11.3 External Beam Dose Calculation Algorithm: Dose in Water-Like Medium Without Beam Modifier | ||||||||||||||
|---|---|---|---|---|---|---|---|---|---|---|---|---|---|---|
| ||||||||||||||
The measured data required by TPSs at minimum are relative, in the form of dose ratios, with the denominator being the dose under some reference condition. Any TPS capable of calculating monitor units (MU) or treatment times also requires absolute information in the form of MUs per gray or grays per minute. These data are all part of the input data set required by the TPS. The quality of the input data depends entirely on the therapy machine reproducibility, the quality of the measurement tools, and the expertise of the individual generating the data.
Clinical Application
Finally, the clinical use of the TPS requires patient-specific information in the form of patient contours, usually generated with the aid of CT and/or MRI. Appropriate parameters must be entered to determine the treatment configuration. Dose calculations are usually performed for each beam independently, with the summed doses displayed on a video monitor or printed on paper. This clinical application of treatment planning depends entirely on the user and his or her knowledge of the capabilities and limitations of the TPS. Admittedly, the newer inverse planning optimization routines (3) used for IMRT are automated and leave little in the control of the user other than entering the dose-volume constraints as required by the objective function for the optimization.
Terminology Associated with QA
Four major topics that are associated with the purchase of any major piece of apparatus are specifications, acceptance testing, commissioning, and QC. In the context of TPSs, the distinction between some of these terms is not entirely clear, and therefore they warrant special discussion.
System Specifications
According to the dictionary, specification is defined as “a detailed, exact statement of particulars, especially a statement prescribing materials, dimensions, and quality of work for something to be built, installed, or manufactured” (51). In the context of treatment planning computers, specifications are required at two levels at least. First, the user needs specifications to determine what type of TPS to purchase. Second, the specifications determine the standards for acceptance testing and QC. Rigorously speaking, purchasers should develop their own specifications and go through a tendering process to determine which system best meets those specifications. Practically, manufacturers of TPSs, as well as other therapy equipment, usually provide specifications that define the capabilities of their equipment. For TPSs, the specifications tend to be much more complex than for other equipment because they have so many components. The computer itself can be considered the heart of the system. Attached to the computer are input and output devices, which usually include network connections, possibly some type of magnetic or optical media for backup storage, laser disks, digitizers, film scanners, video displays, and printers. In addition to the hardware, software provides the major capabilities for calculation and display. Software specifications include detailed descriptions of what the software is capable of doing and how accurate the calculations can be made.
Acceptance Testing
Upon the installation of any new device, the user should assess the device to ensure that it behaves according to its specifications. For a TPS, this takes at least two forms: assessment of the hardware and the software. The latter can also be divided into several components, including assessment of the integrity of the operating system, external beam dose calculations, brachytherapy dose calculations, image transfer, and image display.
Commissioning
Commissioning is the process of putting the system into active clinical service. This process includes the production of a basic radiation database, which is entered into the TPS, after which the user tests the system over a range of clinically relevant conditions. Quality evaluations of the programs’ outputs are then made. Such a process cannot test all the system’s pathways or subroutines; however, it does provide the user with a level of confidence over a wide variety of often-used treatment conditions. In addition, it helps the user understand the degree of uncertainty associated with these specific calculations.
Quality Control
As indicated earlier, QA and QC are closely related. QA is the total process required to ensure that a certain level of quality is maintained for a defined product or service. QC specifically consists of systematic actions necessary to ensure that the product or process performs according to specification. This process contains three components: (a) the measurement of the performance, (b) the comparison of this performance with existing standards or specifications, and (c) the appropriate actions necessary to keep or regain agreement with the standard.
In summary, QA and QC first necessitate defining a series of specifications. Acceptance tests ensure that the system meets the basic requirements as defined by the specifications. Commissioning makes the computer ready for clinical use and provides a series of standards that can
be used for ongoing QC to ensure that the system is maintaining the standards. Ongoing QC must be performed at intervals to confirm that there have been no changes in the basic radiation and machine parameter data files, in the input–output hardware, or in the CT, MRI, or other imaging-related software or hardware.
be used for ongoing QC to ensure that the system is maintaining the standards. Ongoing QC must be performed at intervals to confirm that there have been no changes in the basic radiation and machine parameter data files, in the input–output hardware, or in the CT, MRI, or other imaging-related software or hardware.
Treatment Planning Process
In its broader sense, treatment planning includes all the steps from therapeutic decision making to target volume and normal tissue delineation, selection of treatment technique, determination of the direction of radiation beams, simulation, fabrication of ancillary devices and treatment aids, MU–time calculations, treatment verification, and finally, first treatment (Fig. 11.1). In its narrower sense, treatment planning includes the outlining of target and critical volumes, the determination of the number and directions of radiation beams, and the corresponding MU calculations. In this narrower definition, treatment planning involves the use of image information and the computer to perform the appropriate virtual simulation and dose calculations. The QA considered in this chapter primarily addresses the use of the TPS to generate appropriate beam arrangements and dose calculations. The following specific issues are associated with that part of the QA process.
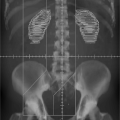
Patient Data
Patient data can be derived in various ways, including simple methods of external contour determination and various imaging modalities, most commonly CT. The important issue at this stage of planning is to ensure that the patient is positioned identically to the eventual treatment position and that the derived data represent this position (52). It is important that the data be transferred accurately to the TPS. If a digitizer or film scanner is used, the QA process must ensure the accuracy of the input data. Also, any conversions of digitized data, such as the conversion of CT numbers to electron densities, must be handled accurately by the system.
Display of Patient Data
Once the data have been captured by the TPS, the treatment planner can manipulate the information, look at the data on various slices, and allow the system to perform reconstructions of images. With the patient data on the computer, the radiation oncologist is able to outline target volumes on the appropriate slices as well as the critical structures. While it is well recognized that different physicians can produce large variations in target volume definition for the same patient (53,54,55,56), the accuracy of the display of patient data is important for the next step of the planning process, that is, placement of radiation beams.
Display of Beam-Related Information
Beam placement is often performed with the use of a cursor or a mouse, as well as the keyboard to enter some needed parameters such as field size, beam direction, and collimator rotation. At this stage, various options can be used for the definition of the field shape. These include outlining the irregular field shape in its entirety with the mouse, defining the rectangular field and then adding shaped blocks, using the planning target volume and allowing an automatic preset margin, and automated field definition for the multileaf collimator. In each case, the beam edges can be displayed either on a beam’s-eye-view perspective or as perspectives of the beam edges intersecting any specified plane. Associated with the beam edge display, information demonstrating gantry angle, collimator angle, beam energy, and collimator size should also be displayed on the screen.
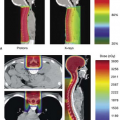
Dose Calculation and Display
Once the beam geometry has been determined, the dose distribution can be calculated and displayed. Displays vary from simple colored isodose lines to color washes to individual point doses. The accuracy of the geometric correctness of isodose lines on the display is very difficult to assess, although very specific phantom geometries, whereby one can assess the position of a specific isodose line can help with this process. Doses calculated at individual points can be correlated to the isodose lines as well as measured data.
Output
Dose-calculation output can be provided on a printer, often in color. Screen dumps allow for a quick copy of everything displayed on the screen. The screen hard copies usually are not on a one-to-one scale, even though this is often preferred by the radiation oncologists for assessing the distribution and making necessary changes.
System Specifications
The system specifications can be divided into various categories, including hardware, system administration software, network and interface software, and planning software. As an example, Table 11.4 gives a summary of the table of contents of one institution’s treatment planning computer specifications. Under each section there are many detailed questions as to the system’s capabilities. For example, under Section 9.4.3, Program Features, are subsections on anatomy and volume selection, beam definition and display, bolus, and compensators. Each of these subsections has multiple questions as to the programs’ capabilities and options.
Sources of Uncertainties
Specifications take various forms. One form is simply a statement of whether the system is capable of doing a particular function or not. Another form is quantitative, for example, speed, number of images it can hold, and so on. A third form is a statement of accuracy. This is
particularly relevant for dose calculations. To assess the accuracy of a system and to define realistic accuracy specifications it is necessary to understand the sources of uncertainties.
particularly relevant for dose calculations. To assess the accuracy of a system and to define realistic accuracy specifications it is necessary to understand the sources of uncertainties.
Table 11.4 Sample Table of Contents of a Treatment Planning Computer Specifications Document | ||
|---|---|---|
|
The determination of uncertainties in dose calculations is complex because dose calculation algorithms depend on input information, which is usually generated by measurement. Thus, the uncertainty in the calculation output depends on the uncertainties associated with the measurements as well as the limitations of the calculation algorithms. Measurements are of various types, including relative doses in water phantoms, absolute dose calibrations for MU calculations, patient anatomy using imaging techniques or contouring devices, thickness profiles of physical wedges, compensators, or bolus, and distances from x-ray films and optical indicators. Further inaccuracies can be generated by output devices such as printers and screen dumps. Inaccuracies in image display can affect the choice of beam arrangements or field sizes used to cover specified target volumes. Similarly, image distortions can lead to incorrect manual dose optimization procedures.
Suggested Tolerances
Criteria of acceptability for dose calculations have been described by various authors (9,11,57,58,59,60). Task Group 53 of the AAPM (14) and IAEA TRS-430 (15) also include discussions on criteria of acceptability and tolerances generally considered achievable. Criteria of acceptability are very dependent on the region of calculation. Greater accuracy can be achieved on the central ray in a homogeneous phantom than in the penumbra region at the beam edge. Generally, four regions can be considered: (a) regions of low dose gradient in the central portion of the beam, (b) regions of large dose gradients such as that occur in the penumbra or in the fall-off region for electron beams, (c) regions of low dose gradients in low-dose areas such as that occur outside the beam or under large shielded areas, and (d) doses in the buildup or build-down regions at the entrance and exit surfaces of the patient. Criteria of acceptability are generally quoted as a percent of the reference dose except in regions of high dose gradients, where a spatial agreement in millimeters is a better descriptor, since the dose uncertainties in such regions can be very large.
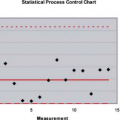
Criteria of acceptability should include a statement of confidence. In other words, if we assume that the criterion of acceptability is an accuracy of 2% of the dose calculated on the central ray of the beam for a homogeneous phantom, then the question is whether all the calculated doses on the central ray are within 2%, or does the 2% represent one standard deviation (68% confidence) or two standard deviations (95% confidence)? For one standard deviation, 32% of the results may lie outside the stated criterion of acceptability. This is an important consideration, since ambiguities in these criteria can generate tremendous frustration from the user’s perspective as well as some troublesome legal interactions with manufacturers of TPSs. By way of example, Van Dyk et al. (11) produced some tables of criteria of acceptability clearly outlining the system’s general capabilities. Tables 11.5 and 11.6 are similar to the Van Dyk data, but some adjustments have been made in the numerical values to indicate a slightly tighter range of acceptability reflecting improvements in dose calculation algorithms available with modern TPSs. These criteria of acceptability represent one standard deviation about the mean. Venselaar et al. (60) have used a somewhat more complex, but more rigorous, definition of a “confidence limit” and this has been discussed in IAEA TRS-430 (15). It should also be noted that calculation accuracies depend not only on the input data and the limitations of the algorithms, but also on the user’s performance of the calculation, which includes issues such as the choice of grid spacing. Grid spacing can have a large effect on the accuracy of dose calculations, especially in regions of high dose gradient.
Related posts:
Stay updated, free articles. Join our Telegram channel

Full access? Get Clinical Tree


