5 Clinical Features and Treatment of Diabetic Neuropathy
Severity and Staging of Diabetic Polyneuropathy
P.J. Dyck
 Why Quantitate the Severity of Diabetic Polyneuropathy?
Patients and physicians need to know not only whether disease is present in a given patient but also its severity. This is especially true for diabetic polyneuropathy, which begins so insidiously that its presence and severity are not apparent without careful evaluation. Knowledge of whether diabetic polyneuropathy is present and how severe it is is needed for cohort and epidemiologic studies and for conduct of therapeutic trials. It is also needed for purposes of following the course of the neuropathy in clinical practice, and in order to decide when to initiate preventative or ameliorating treatments, assuming that such treatments are available.
To this date the health burden of diabetic polyneuropathy has been largely expressed in the form of the number or percentage of diabetic patients who have it. The percentage of diabetic patients who have diabetic polyneuropathy at a given date (the prevalence), or the number or percentage who develop it over a given period of time (the incidence), is not very meaningful unless one also knows the severity of the neuropathy or the health outcomes which it causes. For example, if most or all of the patients with diabetes mellitus have only asymptomatic neuropathy which does not give them health problems at this time or in the foreseeable future, then diabetic polyneuropathy is not a serious health problem. If, on the other hand, many or most of the patients develop symptoms, impairments, or adverse health outcomes as a result of diabetic polyneuropathy, then diabetic polyneuropathy is a major health problem. To date the health burden of diabetic polyneuropathy has not been adequately assessed. It will not be possible to do this until physicians adopt approaches to assessing its severity. In the following sections, we outline how we judge overall severity and stage it.
 How Is Severity of Diabetic Polyneuropathy to Be Judged?
It is possible to judge the severity of symptoms, impairments, attributes of nerve conduction (NC), quantitative sensation tests (QST), quantitative autonomic tests (QAT), morphometry of biopsied nerves, counts of nerve endings in skin biopsies, and adverse health outcomes. We have suggested that no single measure is sufficiently representative that it can be used as the only measure of diabetic polyneuropathy. I advocate that severity of a patient’s diabetic polyneuropathy be assessed by quantitating neuropathic symptoms, impairments (including clinical, NC, QST, and QAT), staged severity, and health outcomes [1,2].
 Minimum Criteria for the Diagnosis of Diabetic Neuropathy
Many minimum criteria for the diagnosis of diabetic polyneuropathy have been proposed. Before considering specific criteria. I must emphasize that to begin with a correct judgment must be made that the patient has diabetic polyneuropathy and not another neuropathy or another variety of diabetic neuropathy. Other neurologic diseases or neuropathies occur in perhaps 10% of patients who have diabetes mellitus [3]. One diagnostic criterion is a physician’s judgment that the patient has diabetic polyneuropathy. Without specifying what examinations should be done, what criteria for abnormality should be used, and minimum criteria for diabetic polyneuropathy, great inaccuracies would ensue from the use of this criterion alone. Decreased or absent ankle reflexes and decreased vibratory detection threshold of the foot as detected using a tuning fork is a widely used criterion [4,5].This criterion has great appeal because it is simple and uses generally available expertise and tools, but it has major flaws. First, other tests are more sensitive and perhaps more reliable. Second, it is unclear that without special training or experience physicians can sensitively or accurately judge abnormality considering the influence of such anthropometric factors as age, sex, height, and weight. A third criterion is the presence of at least two abnormalities (from among symptoms, clinical deficits. NC, QST, or QAT) with one of the two being an abnormality of NC or quantitative autonomic examination [1]. Abnormality of NC was an abnormality (≥99th or ≤ 1st percentile, whichever applied) of attributes of NC in at least two separate nerves. Perhaps a better criterion (the fourth one) is to use a composite score such as NIS(LL)+7 tests [2]. The seven tests were: peroneal motor nerve conduction velocity, peroneal compound muscle action potential, peroneal motor distal latency, sural sensory nerve action potential and tibial motor distal latency, heart-pulse decrease with breathing, and vibratory detection threshold using CASE IV. In Tables 5.1 and 5.2, we provide the algorithm of how to calculate the NIS(LL)+7 test. The NIS(LL) could be combined with varying numbers of tests (e.g.. NIS(LL)+2. +3…+ n).
Table 5.1 Calculating the NIS(LL)+7 tests score (items 17-24. 28-29, and 34-37 of NIS) (points)
1. Sum individual scores of the NIS for the lower limbs. NIS(LL). |
2. Summate transformed points for percentile abnormalitya of the five attributes of NC of lower limb (peroneal nerve [CMAP. MNCV, and MNDL], tibial nerve [MNDL], and sural [SNAP]), of VDT and of HBDB divided by the number of attributes with obtainable values,b multiply by 7 (the number of attributes), and add this number to the global score. |
a < 95th = 0; > 95th-99th = 1; > 99th-99.9th – 2;> 99.9th = 3 (or > 5th = 0 to < 0.1 th = 3, whichever end of the distribution is abnormal)
b MNCV and MNDL cannot be estimated when CMAP is 0
Abbreviations:
CMAP = compound muscle action potential
SNAP = sensory nerve action potential
MNDL = motor nerve distal latency
VDT = vibration detection threshold
HBDB = heart beat deep breathing
 Can Neuropathic Abnormalities Be Demonstrated in Patients Who Do not Fulfill Minimum Criteria for Diabetic Polyneuropathy?
We studied this question in the Rochester Diabetic Neuropathy Study cohort. We characterized the QST results for the foot of each patient as hyperesthetic (≤2.5th percentile), low normal (>2.5th to 50th), high normal (50th to <97.5th), or hypoesthetic ≥97.5th). In Figure 5.1, we show the distribution of severity of diabetic polyneuropathy using NIS(LL)+4 tests in four cohorts studied. In Figure 5.2, we show the distribution of the percentile response categories for the four cohorts. In the normative population, we set values so that 50% of vibratory detection thresholds were above and 50% below the 50th percentile. In the Rochester Diabetic Neuropathy Study cohort, we found that there were more patients in the 50th-97.5th percentile range than were in the 2.5th-50th percentile range. Similar observations were made for attributes of nerve conduction and also for heart-pulse variation with deep breathing. These data clearly imply that there is a subtle shift of values from the below-50th percentile group to the above-50th percentile group prior to their fulfilling minimum criteria for diabetic polyneuropathy. This provides unequivocal evidence that subtle functional abnormalities precede defined minimum criteria for diabetic polyneuropathy.
Table 5.2 Calculating the NIS(LL)+7 tests (items 17-24.28-29, and 34-37 of NIS) (normal deviate [nd])
1. Sum Individual scores of the NIS for the lower limbs. NIS(LL). |
2. Summate normal deviatea for percentile abnormalitybof the five attributes of NC of lower limb (peroneal nerve [CMAP. MNCV, and MNDL], tibial nerve [MNDL], and sural [SNAP]), of VDT and of HBDB divided by the number of attributes with obtainable valuesc, multiply by 7 (the number of attributes), and add this number to the global score. |
aExpress all percentile values so that abnormality appears in the upper end of the distribution
bFor tests or NC attributes which are abnormal at low percentile values (e. g., HBDB. NC conduction velocities and amplitudes), express their values as occurring at the high end of the distribution (e. g., 25th becomes 75th, 60th becomes 40th, and 4th becomes 96th). Estimate the normal deviate (nd) for each percentile value instead of point values as outlined in Table 5.1
cMNCV and MNDL cannot be estimated when CMAP is 0
 Severity of Neuropathic Symptoms
Diabetic neuropathic symptoms can be characterized as negative (decreased function) and as positive (hyper-function). The former symptoms relate to decreased feeling of tactile, mechanoreceptor, thermal, and painful stimuli; the latter are such spontaneous symptoms as feelings of asleep-numbness, tightness, swelling (without being swollen), prickling, and pain. Various approaches have been used to quantitate these symptoms. In the total symptom score (TSS) [6], the symptoms of asleep-numbness, prickling, pain, and burning are quantitated by intensity (“not present.” “mild.” “moderate.” or “severe”) and by frequency (“occasional.” “often,” or “continuous”). In the neuropathy symptom score, we tally the number of symptoms (from a list of 17 symptoms) encountered in neuropathy [7]. In the Neuropathy Symptoms and Change (NSC) score, we assess for number, severity, and change of symptoms [8].
Although this has not been studied adequately, symptoms relate poorly to severity or change of neuropathic impairment [2]. It may be that symptoms tend to be worse with the onset of neuropathy or with rapid progression of neuropathy, and to lessen as greater impairment occurs.
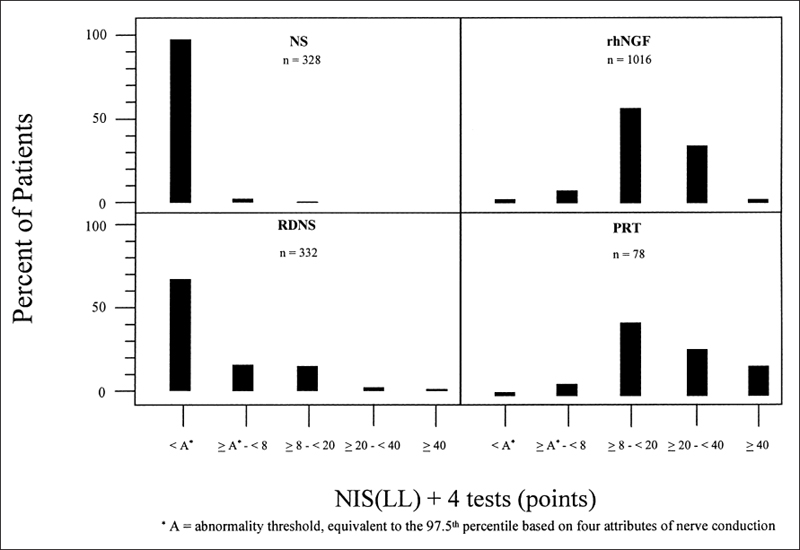
Fig. 5.1 Quantitative test abnormalities were estimated for the foot using CASE IV in four cohorts: healthy subjects (NS), the Rochester Diabetic Neuropathy Study (RDNS), the nerve growth factor therapeutic trial (rhNGF), and a pancreas renal transplant cohort (PRT). The NIS(LL)+4 tests score were used
 Continuous Measures of Neuropathic Impairment
Several measures have been developed to encompass the weakness, reflex change, and sensory loss in diabetic polyneuropathy. We have developed the Neuropathy Impairment Score (NIS), which is a standard evaluation of muscle weakness, reflex decrease or loss, and sensation decrease or loss [7]. The various abnormalities are to be scored for the patient’s age, gender, physical fitness, and anthropometric features. For each item a continuous measure of abnormality is allowed. In a second approach, a nurse does a screening evaluation; and if certain conditions are exceeded, a physician completes the examination to score severity of neuropathy [9].
 Composite Scores for Diabetic Polyneuropathy Severity
We have developed two approaches to estimate NIS(LL)+n tests (where n is the chosen number of tests [e.g., n = 4, 7, or other]). For either approach, we add to the NIS of lower limbs (NIS[LL]) points for test abnormality. In order to be able to do this, it is necessary to have test abnormalities expressed as a percentile. We have provided details of how to estimate percentiles [10] and such normative results from a healthy subject cohort from Rochester. Minnesota [11],
In the first approach, we transform only values which are beyond a certain level of abnormality (e.g., ≥95th or ≤ 5th) and use whole number transformations (e.g., ≥ 95th to < 99th = 1 point. ≥ 99th to < 99.9th = 2, and > 99.9th = 3). If abnormalities are at the lower end of the normal distribution, they are similarly transformed: ≤ 5th to > 1st = 1 point and so on. If a test was done but a value cannot be estimated (e.g., motor nerve conduction velocity [MNCV]) when the compound muscle action potential was zero, its effect on the score is included by dividing the summed values of attributes which can be measured by their number and multiplying this value by the total number of attributes assessed. The approach is outlined in Table 5.1. Note that in this approach, values falling below the 95th or above the 5th percentile (whichever applies) do not contribute to the score, and there is no interpolation of transformed points within the range of percentile abnormality. We therefore call this the NIS(LL)+n tests (points).
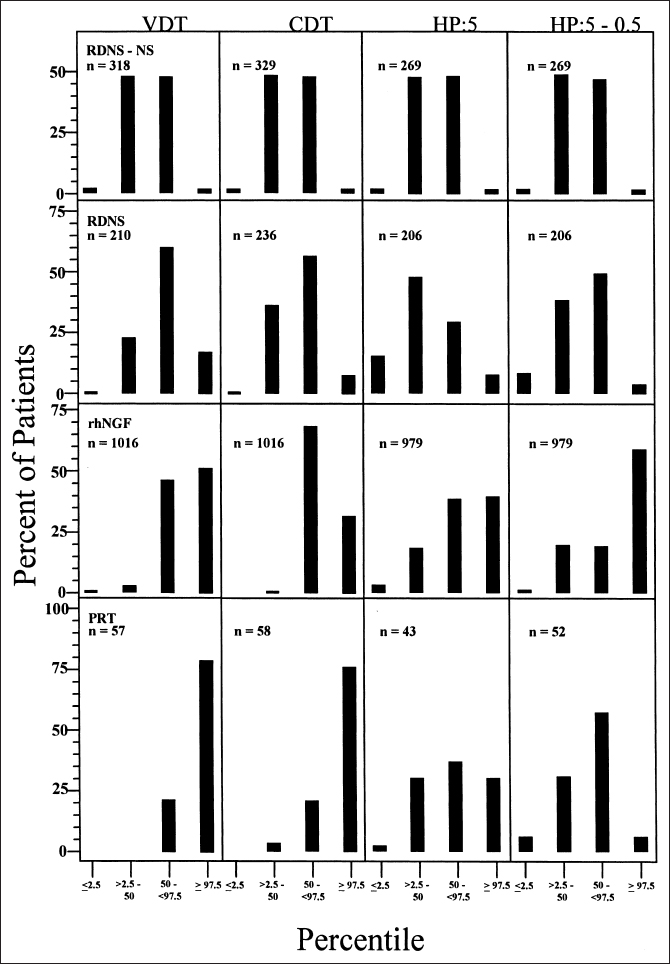
Fig. 5.2 Distribution of quantitative sensory abnormalities in the four cohorts described in the legend to Figure 5.1. For all modalities of sensation studied, there was a higher percentage of abnormalities between the 50th and 97.5th percentiles than between the 2.5th and 50th percentiles, reflecting a subclinical shift in abnormality as discussed in the text
In the second approach (NIS[LL]+n tests) (normal deviate [nd]), set out in Table 5.2, we interpolate normal deviate values for percentile values of test results. For each of the n test results employed, we estimate a percentile and normal deviate value. Before the normal deviate values are added to NIS(LL), percentile values which are in the lower end of the distribution are expressed as if they fell in the upper distribution (e.g., 1st becomes 99th, 95th becomes 5th. 49th becomes 51st, and so on). A normal deviate value relates each percentile value to a normal distribution. For example, for the 50th percentile the corresponding normal deviate is 0 since 50% of values in a normal distribution fall below 0. The normal deviate corresponding to the 95th percentile is 1.96 since 95% of values in a normal distribution fall below 1.96. Therefore, in this approach, we summate normal deviate values whether they fall within or fall outside of the normal range, but do not use normal deviate values corresponding to values higher than the 99.9th.
The second is the preferable of the two approaches because normal deviate values are calculated for each percentile value, and values within the normal range are also included.
 Staging Severity of Diabetic Polyneuropathy
Composite scores such as NIS(LL)+n tests (points or normal deviate) are useful continuous measures of overall severity of neuropathy impairment. They are especially useful in epidemiologic or controlled clinical trials requiring continuous quantitative data. However, there is also a need for an approach that includes symptoms, as well as neurologic impairments and test abnormalities, and is directed at categorization of the health problem represented by the neuropathy. In the approach we developed, we divide diabetic polyneuropathy into four stages: NO = no diabetic polyneuropathy; N1 = asymptomatic polyneuropathy; N2 = symptomatic polyneuropathy; and N3 = disabling polyneuropathy. In the recent reports and in our revision of Diabetic Neuropathy, we modify the staging approach [12].
The approach that we have developed is in some respects similar to the staging approach used in diabetic retinopathy. Taking some liberties with the staging of diabetic retinopathy, it may be staged as RO = no retino-pathy; Rl = mild background retinopathy; R2 = severe background retinopathy; and R3 = proliferative retinopathy.
Patients without diabetic polyneuropathy are staged as NO. This includes diabetic patients who do not fulfill the minimal criteria for diabetic polyneuropathy discussed in a previous section. These patients have a lesser abnormality than N1a.
Patients with diabetes mellitus and neuropathic test abnormalities (NC, QST, or QAT abnormalities) due to diabetic polyneuropathy, but who do not have neuropathic symptoms or findings (NIS <2 points) are staged as N1a.
Patients with neuropathic test abnormalities (findings of Nla), neuropathy impairment (NIS≥ 2 points), both due to diabetic polyneuropathy, and no neuropathic symptoms are staged N1b.
Patients with stage N2a have neuropathic test abnormalities and neuropathic impairment ≥2 points, and symptoms of diabetic polyneuropathy but of a lesser degree than N2b.
Symptoms of diabetic polyneuropathy may consist of positive or negative symptoms. The positive symptoms are usually assumed to be due to hyperfunction and negative symptoms to hypofunction. Hypersensitivity symptoms include altered sensory experiences that may be likened to asleep-numbness (as if a hand had gone to sleep); prickling; a crusted or tight feeling; enlargement feeling; and so on. Other positive symptoms include burning pain, lancinating pain, deep throbs, and deep aching. Negative sensory symptoms include not being able to feel, tactile, mechanorecep-tor, thermal or painful stimuli.
Patients staged as 2b fulfill minimum criteria for diabetic polyneuropathy and have positive or sensory symptoms of diabetic polyneuropathy resulting in ankle dorsiflexor weakness due to diabetic polyneuropathy of ≥ 50%. They have less involvement than those at stage 3.
Occurrence of any of the following ten conditions, when judged to be due to diabetic polyneuropathy, results in the diagnosis of the neuropathy as stage 3 (disabling neuropathy) [3].
Motor:
1. Symptoms of muscle weakness, confirmed by examination, of sufficient severity that the patient is unable to walk independently.
Sensory:
1. Symptoms of sensory loss of sufficient severity, confirmed by examination, that the patient could not walk independently because of sensory ataxia.
2. Absence of feeling in hands so that the patient is disabled.
3. Symptoms of pain, having the characteristics of neuropathic pain, that is disabling. Criteria a, b, and c have to be fulfilled:
a. The patient has previously attended physicians for pain relief.
b. Work and recreational activities have been curtailed by at least 25% because of pain.
c. Medication for pain relief has been taken on a continuing basis (≥ 50 % of days) for at least six weeks.
Autonomic:
1. Gastric atony as demonstrated by gastric retention tests and by exclusion of other gastric or psychiatric causes of emesis, causing emesis of retained (≥18 hours) food at least once weekly for at least six weeks.
2. Urinary retention as demonstrated by manometer evidence of detrusor hypoactivity and not due to psychiatric disturbance or urinary bladder disease, necessitating continuous use of a catheter for six weeks or longer.
3. Urinary incontinence due to loss of sphincter function, necessitating continuous (≥ 50% of time) use of diapers or leg urinal for at least six weeks and not due to psychiatric or bladder disease.
4. Rectal incontinence due to loss of anal sphincter function of at least six weeks’ duration and not due to psychiatric or rectal disease.
5. Diarrhea to the degree that it causes weight loss (≥5kg) and steatorrhea (≥ 10mg/24 hours) and not due to psychiatric disturbance, laxative abuse, or other bowel disease.
6. Symptomatic light-headedness or fainting due to orthostatic hypotension (≥30mmHg systolic) with concomitant blood pressure drop, present continuously (light-headedness or fainting weekly) for at least six weeks.
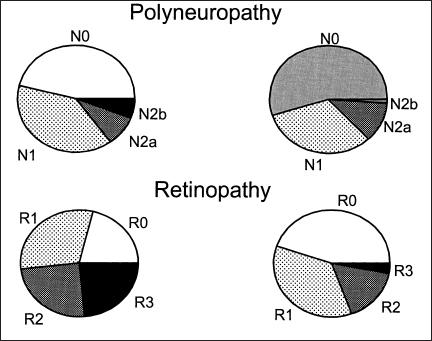
Fig. 5.3 Distribution of staged severity of diabetic polyneuropathy in a population-based study of diabetic patients in Rochester, Minnesota. Whereas approximately 50% of both type 1 and type 2 diabetic patients have diabetic polyneuropathy, the spectrum of the staged severity is more severe in type 1 diabetes. N0.no diabetic polyneuropathy; N1, asymptomatic polyneuropathy as described in text; N2a, symptomatic diabetic polyneuropathy but with a degree of dorsiflexor muscle weakness at the ankle that is less than 50 %: N2b, symptomatic diabetic polyneuropathy with greater dorsiflexor muscle weakness than 50%.
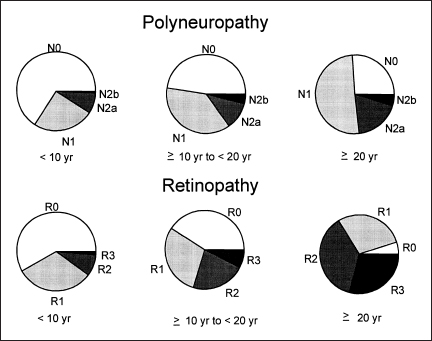
Fig. 5.4 Prevalence of staged severity of diabetic polyneuropathy by duration of diabetes mellitus. Note that the spectrum of staged severity is worse with greater duration of diabetes
In Figure 5.3, we show the frequency distribution of staged diabetic polyneuropathy as obtained in a prevalence study of diabetic patients in Rochester. Minnesota [3]. It was of note that patients with type 1 diabetes mellitus had more severe stages of diabetic polyneuropathy than did those with type 2. In Figure 5.4, we show that duration of diabetes also influences the staged severity of diabetic polyneuropathy.
Classification of the Diabetic Neuropathies
P.K. Thomas
A wide variety of syndromes affecting the peripheral nervous system may be encountered in patients with diabetes mellitus. This is probably a reflection of a range of underlying disease mechanisms. These syndromes may develop in isolation or in combination.
Neuropathy is an important complication both of type I and type 2 diabetes (see Chapter 3), but there are some significant differences between the two forms. Symptomatic autonomic neuropathy is almost always seen in type I patients. Reversible mononeuropathies, by contrast, are more common in older men with type 2 diabetes. The classification advocated here is based on the one originally proposed by Thomas [13] and is listed in Table 5.3.
 Hyperglycemic Neuropathy
The older literature [14] described the occurrence of uncomfortable sensory symptoms experienced distally in the limbs in poorly controlled or newly diagnosed diabetics, or following an episode of diabetic ketosis (see page 309–312). These consist of tingling paresthesias, pain, or hyperesthesia. They rapidly subside following establishment of euglycemia. More recently such symptoms have been referred to as hyperglycemic neuropathy [15]. Their explanation has not been established. Diabetic nerve has been found to be hypoxic [16]. From experimental observations in rats, hyperglycemic but not normoglycemic hypoxia has been shown to produce alterations in fast K+ conductance and after-potentials, related to axoplasmic acidification [17]. This could lead to the generation of ectopic impulses and the occurrence of positive sensory symptoms.
Table 5.3 Classification of the diabetic neuropathies
Hyperglycemic neuropathy Generalized neuropathies Sensorimotor polyneuropathy Acute painful sensory neuropathy Autonomic neuropathy Acute motor neuropathy Focal and multifocal neuropathies Cranial neuropathies Thoracolumbar radiculoneuropathy Proximal diabetic neuropathy Focal limb neuropathies (including entrapment and compression neuropathies) Superimposed chronic inflammatory demyelinating polyneuropathy Hypoglycemic neuropathy |
It is also known that nerve conduction velocity is reduced in poorly controlled diabetic patients. This improves rapidly on correction of the hyperglycemia [18,19]. A further feature of hyperglycemic neuropathy is an abnormal resistance to ischemic conduction failure [20], This may be noticed by patients who find that they have a reduced tendency to develop ischemic paresthesias on nerve compression. This may be related to a switch by diabetic nerve to anaerobic glycolysis [21].
 Diabetic Distal Sensory or Sensorimotor Polyneuropathy
This is the most frequent form of diabetic neuropathy and is discussed on page 199–202. It is usually insidious in onset and may be the presenting feature in patients with type 2 diabetes. It may be asymptomatic and discovered incidentally on examination or when patients present with a neuropathic complication. When symptomatic, it gives rise to sensory manifestations that are most evident distally in the lower limbs, consisting of numbness, tingling, and pain. It is often accompanied by autonomic neuropathy, which is usually mild in patients with type 2 diabetes. A mild distal motor neuropathy may also coexist.
The most important consequences of diabetic sensory polyneuropathy are chronic ulceration and, to a lesser extent, neuropathic osteoarthropathy, as a result of loss of pain sense in the feet together with the effects of autonomic dysfunction (see page 296–297).
 Acute Painful Diabetic Neuropathy
Acute painful diabetic neuropathy is a separate entity from distal symmetric diabetic sensory polyneuropathy. Its onset is acute or subacute, with burning pain experienced mainly in the lower limbs but sometimes in the upper limbs or on the trunk. There is usually distressing contact hyperesthesia of the skin. Motor signs, tendon reflex depression, and autonomic dysfunction are not prominent, but impotence may develop in males. The syndrome can be precipitated by the initiation of treatment (see page 308–309) or be associated with precipitous weight loss (see page 208). Recovery occurs with continued glycemic control over a matter of months. Recurrence is unlikely.
 Autonomic Neuropathy
Autonomic neuropathy normally is an accompaniment of diabetic sensory polyneuropathy. A very wide range of manifestations may occur [15] (see page 225–294). In patients with newly diagnosed diabetes [22,23], minor reversible disturbances of autonomic function can be detected that recover with establishment of euglycemia.
Symptomatic autonomic neuropathy, as already stated, is almost always encountered in type 1 diabetic patients who have reached middle age and have had diabetes for several years. Once established, it is largely irreversible [24].
 Acute Motor Neuropathy
Patients have been described who have developed an acute primarily motor neuropathy accompanied by bilateral facial weakness following an episode of diabetic ketosis [25] associated with an elevated cerebrospinal fluid protein content. Recovery occurred over the course of a few weeks. Such cases have to be distinguished from examples of the Guillain-Barré syndrome and critical illness neuropathy [26].
 Focal and Multifocal Neuropathies
The second broad category of diabetic neuropathies (see Table 5.3) consists of the occurrence of isolated peripheral nerve lesions or of multiple isolated lesions. These are best separated into focal cranial nerve lesions, truncal or thoracolumbar radiculoneuropathy, proximal diabetic neuropathy, and focal lesions of limb nerves. They are considered in more detail on page 202–204.
Cranial Neuropathies
Amongst the cranial nerves, focal lesions most commonly affect the nerves to the external ocular muscles, particularly the third nerve. This usually has an acute onset with pain, and pupillary function is characteristically spared. Of the other cranial nerves, the seventh is most often implicated, but as the frequency of these lesions is low it is difficult to be certain of a clear association with diabetes.
Thoracolumbar Radiculoneuropathy
This manifestation of diabetic neuropathy consists of the occurrence of focal sensory symptoms either unilaterally or bilaterally on the trunk, with pain, cutaneous hyperesthesia, and sensory loss in a radicular distribution or in the territory of intercostal nerves. Focal weakness of the anterior abdominal wall may occur. The onset of symptoms is often acute or subacute, and recovery generally occurs over the course of some months.
Proximal Diabetic Neuropathy
Otherwise known as diabetic amyotrophy or lumbosacral plexus radiculoneuropathy, this syndrome is encountered most often in older males with type 2 diabetes. The onset can be subacute or insidious and is commonly accompanied by pain. It can be unilateral or bilateral and, if bilateral, asymmetric or symmetric. Radicular sensory loss may be present. At times distal lower limb muscles and occasionally those of the upper limbs may also be affected.
Focal Limb Nerve Lesions
These are probably more frequent in patients with diabetes than in the general population, but epidemiological data are scarce (see Chapter 3). Often they are at common sites of entrapment or external compression, indicating an increased susceptibility of diabetic nerve to compression injury, but they also occur at other locations.
 Superimposed Chronic Inflammatory Demyelinating Polyneuropathy
Although a case control study has not been undertaken it seems likely that chronic inflammatory demyelinating polyneuropathy CIDP occurs more commonly in individuals with diabetes than in the general population [27,28]. Prominent motor involvement or a reduction of conduction velocity into the demyelinating range, particularly if conduction block at sites not subject to entrapment is demonstrated, would suggest this possibility. Confirmation of the diagnosis could be obtained by finding oligoclonal IgG bands on examination of the cerebrospinal fluid or by nerve biopsy. The important diagnostic findings on nerve biopsy are the presence of inflammatory infiltrates and stripping of myelin off axons by macrophages. These examples of CIDP probably represent a secondary immunologic response to nerve damage by diabetic neuropathy, as is thought to occur at times in hereditary motor and sensory neuropathy [29].
 Hypoglycemic Neuropathy
Repeated or single episodes of severe hypoglycemia have been documented to give rise to a predominantly motor neuropathy or neuronopathy [30,31]. Severe hypoglycemic episodes are usually either the result of an insulinoma or insulin overdose. Whether recurrent hypoglycemic episodes that occur during the course of treatment of insulin-dependent diabetes can also cause hypoglycemic neuropathy is conceivable but not established. Animal studies suggest that this is possible [32].
Diabetic Sensorimotor Neuropathy: Methods of Assessment
 Electrophysiologic Testing
V. Brii
Introduction to Electrophysiology
Electrophysiology comprises investigation of the electrical response characteristics of nerve and muscle. The synonymous term “nerve conduction studies” (NCS) encompasses properties of transmission of electrical current along nerve and muscle fiber membranes. Motor and sensory nerve fibers have different properties. Their responsiveness to electrical stimulation is measured in end organs (motor or sensory), or in nerve trunks, and these responses are recorded, measured, and quantified.
Electrophysiology can be thought of in the simplest terms as an extension of the clinical neurologic examination. The testing provides numerical values for peripheral nerve and muscle function. The measures are objective, independent of patient input, and unbiased. These are the most reliable measures of the peripheral neuromuscular system available currently [33–39].
The utility of NCS for evaluation of patients with neuromuscular disorders has been demonstrated in countless reports and texts [34,40–44]. This method of investigation is well established and widely available. Other diagnostic measures have not replaced nerve conduction studies or electromyography for the objective documentation of peripheral neuromuscular function.
The use of NCS has extended to ancillary evaluation of centrally mediated neurologic disorders such as multiple sclerosis, strokes, and movement disorders [45–47].
Nerve Conduction Studies in Neuropathies: An Overview
NCS document the presence, nature, distribution, and severity of peripheral nerve impairment. Subjects presenting with symptoms of numbness, tingling, and weakness may have a peripheral, central, or nonorganic cause of these complaints. The NCS can substantiate a peripheral neuromuscular basis for the symptoms. The absence of NCS abnormalities raises doubts as to the presence of neuromuscular dysfunction. The NCS provide information on whether the peripheral nerve process is primarily axonal or demyelinating, with implications for investigation and management. NCS can distinguish the presence of mononeuropathy (abnormalities falling within the territory of a single peripheral nerve), multiple mononeuropathy (multiple single nerves), or polyneuropathy (diffuse peripheral nerve disease). Finally, the severity of NCS abnormality reflects the severity of the underlying neuromuscular disorder and can help direct management. For example, early surgical decompression may be advised in those with severe NCS findings of carpal tunnel syndrome.
An important finding of NCS in polyneuropathy is whether the process is primarily axonal or demyelinating. This distinction aids in the diagnosis, directing therapeutic decisions and prognostication. Primary demyelinating disorders suggest etiologies such as hereditary polyneuropathy, monoclonal gammopathy of unknown significance with polyneuropathy, or chronic inflammatory demyelinating polyneuropathy (CIDP). All of these neuropathies can be found in association with diabetic sensorimotor polyneuropathy (DSP). In demyelinating disorders. NCS are helpful in diagnosis and in following the response to therapy, particularly for CIDP [48–54]. In the case of Cuillain-Barre syndrome, large changes in motor conduction velocity can be expected during the course of the disorder, reflecting the underlying processes of demyelination and remyelinatioa The amplitude of the distal compound muscle action potential helps determine prognosis in that a low-amplitude compound muscle action potential at initial NCS testing indicates more severe involvement, a less benign course, and a less favorable prognosis [55–57]. In Guillain-Barré syndrome, large clinical changes occur relatively rapidly in a period of months to years, allowing accurate clinical determination of responses to therapy with corresponding changes in NCS [58]. In CIDP, improvements in NCS as well as clinical improvements help validate various therapeutic interventions [149,52,54,59].
The role of NCS in following responses to therapy in axonal neuropathies is more difficult to evaluate as few axonal neuropathies have effective therapeutic interventions. Changes in NCS parameters in axonal neuropathies are more difficult to ascertain. Only small changes in conduction velocities and amplitudes are expected [60–63]: the methodology must be rigorous and standardized [33,64]; and large numbers of patients are needed for demonstration of efficacy [64]. These considerations have led to the development of expert core laboratories [64] to standardize the methodology and provide quality control for clinical trials.
Core labs have optimized NCS in clinical trials (Table 5.4) [64]. Axonal neuropathies such as DSP [63], or toxic polyneuropathies can respond to therapeutic intervention [63,65,66], but the responses observed may be simply the prevention of more rapid disease progression such as that which typifies DSP, for example, rather than regression of NCS abnormalities.
In addition, in the case of toxic neuropathies, withdrawal of the offending toxin allows NCS to recover towards baseline values, but there are no active interventions which produce nerve regeneration. Future developments may lead to more positive therapy producing nerve regeneration and improved function, rather than simply the prevention of rapid disease progression. In that case, effective regeneration would be mirrored in the NCS by findings of increasing motor and sensory nerve potential amplitudes, and increasing nerve conduction velocities towards normal values.
Axonal Neuropathies: Diabetic Neuropathy as the Prototype
The prototype of axonal neuropathies is DSP. Polyneuropathy associated with diabetes is characterized by the progressive loss of nerve fibers, both large and small [67–73]. Recent attention has focused on those with isolated small-fiber neuropathy, but these cases are rare [74,75]. Progressive loss of all axons is the pathologic hallmark of DSP [68]. Other changes observed, such as axonal atrophy, secondary loss of myelin, and numerous vascular changes, contribute to DSP [68,76], but loss of axons is the essential process. This loss is reflected in NCS by the progressive loss of the amplitudes of the evoked motor and sensory potentials [34]. This loss is further illustrated in Figure 5.5, which shows the sural nerve mean myelinated fiber density in patients with differing clinical severity of DSP as defined by a clinical scoring system developed in Toronto [77]. The clinical scoring system (CSS), a clinician-relevant and uncomplicated instrument, was developed using expert logic to ensure that subjects with a broad spectrum of DSP entered a trial of simple screening tests for DSP in the clinic [77], The CSS successfully stratified subjects with diabetes into four categories of DSP: none, mild, moderate, and severe [77]. The relationship between progressive nerve fiber loss and the NCS findings is further illustrated in Figure 5.6, which shows that sural nerve potential amplitudes decrease with nerve fiber loss in the sural nerves in patients with DSP. As the amplitudes decline, a secondary mild slowing of conduction velocity is observed. Greater degrees of conduction velocity slowing cast doubt on the diagnosis of DSP and raise the possibility of coexistent disease, such as CIDP [78,79]. Such unexpected NCS findings lead to a more detailed review of the patient, and perhaps, different therapeutic interventions. In DSP, the distal motor and F wave latencies are mildly increased, particularly along the median nerve, and not solely due to the presence of carpal tunnel syndrome, but rather as part of diffuse DSP [80,81].The most distal nerve segments are affected first in this length dependent “dying-back” neuropathy characterized by centripetal degeneration of axons starting at the distal terminals and progressing centrally [80,82,83]. Thus, early changes are observed distally in the lower limbs. NCS reflect this pattern of nerve impairment and loss. For example, in younger patients, the plantar sensory nerves are affected before the sural nerve responses [84] as the nerve fibers to the plantar sensory nerves are longer than those to the sural nerves, and are affected earlier in any length-dependent dying-back neuropathy. Early abnormalities in F wave parameters can be observed in DSP as these responses are determined by conduction along the whole length of the nerve [85–88].
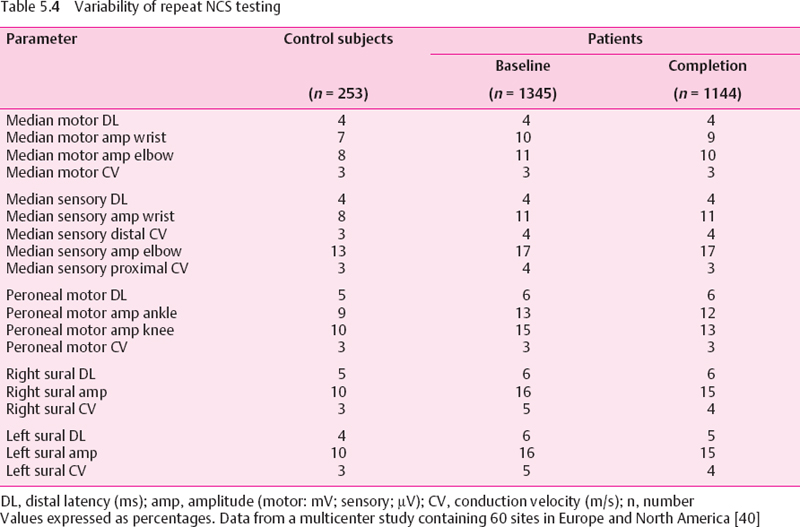
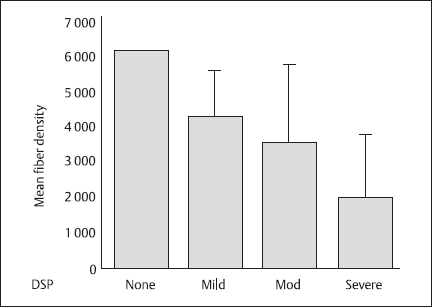
Fig. 5.5 Mean fiber density in the sural nerves of patients with diabetic sensorimotor polyneuropathy (DSP) of varying severity as defined by a clinical scoring system introduced in Toronto [77]. The scoring system allots points for different neuropathic findings distally in the lower limbs in the following manner: symptoms, six points; reflexes, eight points; and sensory deficits five points. Error bars show ± 1SD
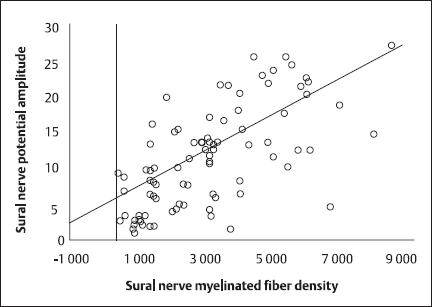
Fig. 5.6 Correlation of sural nerve myelinated fiber density with summed sural nerve potential amplitudes (linear regression). This highly significant correlation had a Pearson’s correlation coefficient of 0.681 (P < 0.0001)
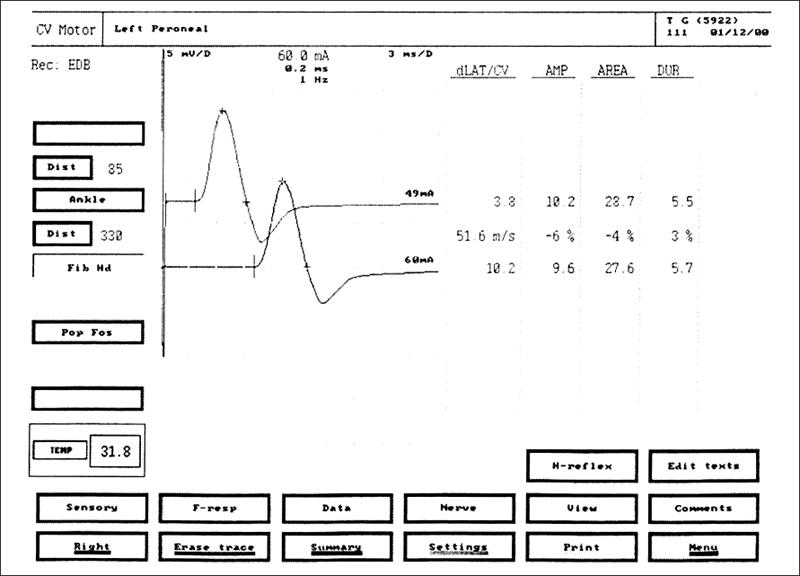
Fig. 5.7 Peroneal motor nerve conduction study (NCS) in a healthy volunteer EMG equipment (Medtronic, Mississauga, Canada) printout. The evoked compound muscle action potentials are obtained after stimulation at the ankle (top tracing) and at the knee (bottom tracing). The amplitudes of the evoked compound muscle action potentials are normal at 10.2 mV with distal stimulation and 9.6 mV with proximal stimulation. The motor conduction velocity of 51.6 m/s is normal
In NCS, parameters reported include the latency of the onset of the evoked motor or sensory response, the amplitude of that response, the conduction velocity, either motor or sensory, for the nerve being studied, and F wave latencies (Figs. 5.7, 5.8). These values are influenced by age, height, and anthropometric characteristics, and change in specific directions in disease states. The normative values are technique-dependent and must be established for each laboratory. Alternatively, published normative ranges can be used if the same techniques for NCS are employed.
Electromyography, which is the needle electrode examination of muscles, supplements the nerve conduction studies and has a limited role in DSP. Although the abnormal finding of fibrillation potentials in the intrinsic foot muscles may predate NCS parameter findings in the abnormal range [89], these changes are nonspecific. Typically, an electromyographic examination (EMG) would be performed to investigate the possibility of additional diagnoses to DSP, such as radiculopathy, inflammatory myopathy, or motor neuronopathy. In DSP, the EMG shows increased insertional activity in distal muscles, abnormal spontaneous activity, and some degree of chronic neurogenic change in motor unit potentials related to reinnervation following denervation, mainly in advanced neuropathy. These are nonspecific changes of an axonal process with involvement of motor fibers and may be observed in different polyneuropathies as well as radiculopathies.
The goals of doing NCS in subjects with suspected DSP are to document the presence and severity of DSP by abnormal findings, document the extent of the disorder, and identify any changes which would suggest an alternative diagnosis. Examples of such changes are: unexpected degrees of slowing of nerve conduction velocities with preservation of evoked motor and sensory potential amplitudes, indicating a primary demyelinating process; normal sensory NCS findings with prominently abnormal motor NCS findings, indicating a primary motor neuropathy; normal NCS findings with absent deep tendon reflexes and elevated vibration perception thresholds, suggesting a polyradicular disease; or normal NCS findings with preserved deep tendon reflexes and elevated vibration perception thresholds, suggesting central neurologic disease in the spinal cord, or higher.
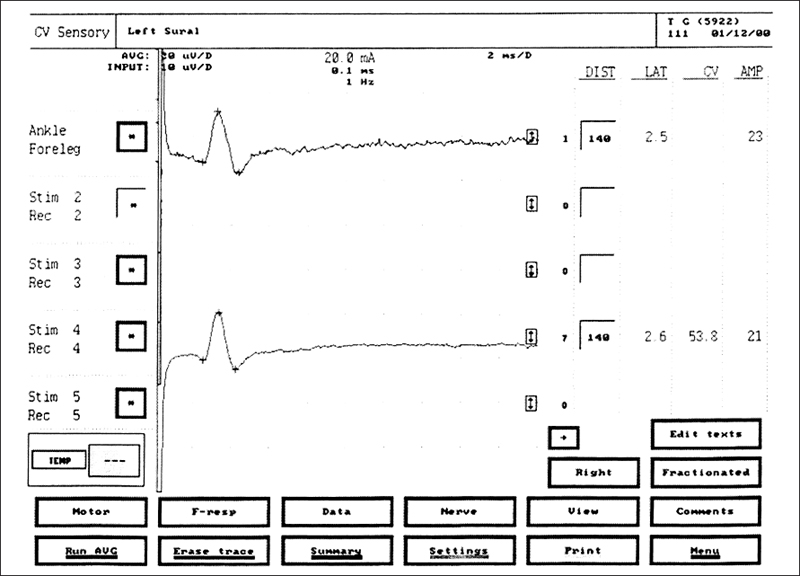
Fig. 5.8 Sural sensory NCS in a healthy volunteer. The upper tracing is a recording of a single response. The + marks indicate sites at which latency and amplitude are measured. The lower tracing is obtained after averaging seven responses. The latency of 2.6 ms, amplitude of 21 μV, and conduction velocity of 53.8 m/s are all normal values
The presence of disease is reflected by abnormal NCS parameters, i. e., prolonged distal motor and sensory latencies, reduction in the evoked motor and sensory potential amplitudes, and secondary slowing of conduction velocity (Figs. 5.9, 5.10). These changes are less definite in mildly affected patients as the overlap between reference subjects and those with DSP is considerable even when adjusting for confounding anthropometric features. NCS can be insensitive to those rare patients with isolated small fiber disease. The severity of disease can be suspected by the degree of abnormality of the parameters in the study; in the most severe cases, the motor and sensory responses are lost distally in the lower limb, and diffuse upper limb changes are observed. The extent of disease can be demonstrated by the number and distribution of nerves affected. If the changes are within the territory of a single nerve, then a mononeuropathy is present. When diffuse changes in NCS are observed, then the presence of DSP is confirmed.
Methodology
Nerves Tested
The nerves tested for DSP include lower and upper limb peripheral nerves. Both motor and sensory nerves are studied. Unilateral NCS are acceptable as the process is symmetric [90]. Typically, the sural nerve response is measured. In subjects less than 40 years of age, the plantar sensory nerves can be assessed [84,91]. For motor nerve function in the lower limb, peroneal nerve testing is favored for technical reliability, but this procedure can be supplemented by posterior tibial nerve conduction studies. In the upper limb, median motor and sensory nerve function tests are utilized. Ulnar nerve conduction studies are also commonly tested. Some laboratories include radial nerve sensory conduction studies in the routine evaluation for DSP [92,93].
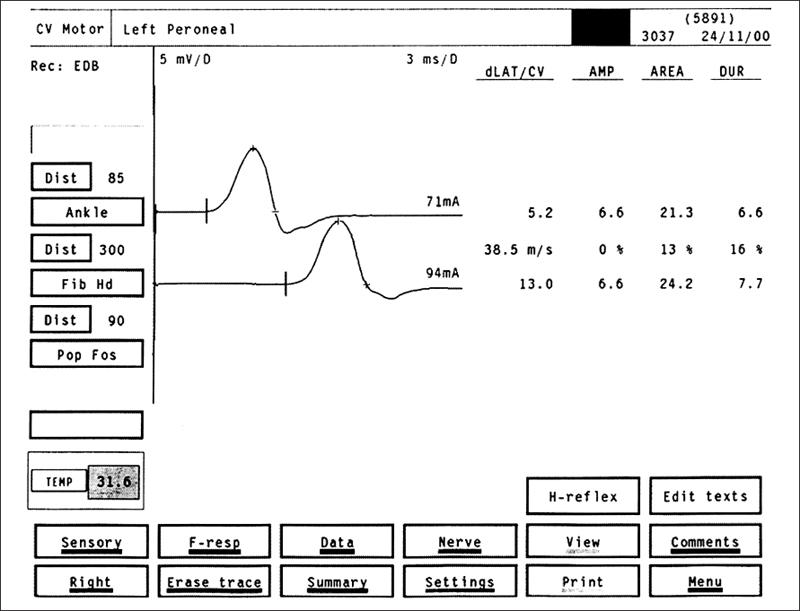
Fig. 5.9 Peroneal motor NCS in a patient with DSP: motor nerve responses after stimulation of the peroneal nerve at the ankle (upper tracing) and at the knee (lower tracing) in a patient with DSP. The conduction velocity of 38.5 m/s is mildly slowed. The amplitude of 6.6 mV is normal
Some laboratories use ratios of different nerve parameters, such as sural/radial sensory nerve potential amplitudes, in order to improve diagnostic accuracy in DSP [92,93]. A confounding factor in NCS for DSP can be abnormality of peripheral nerve function at sites of bony compression, producing NCS findings of mononeuropathy. This type of finding may be integral to DSP and not indicative of simple mononeuropathy [81,94–97].
Electromyography
Electromyographic examination in subjects with DSP is supplementary and exploratory to the routine NCS. This procedure has value if other diagnoses such as radiculopathy, motor neuronopathy, and inflammatory myopathy are under serious consideration in the differential diagnosis for an individual subject. Percutaneous needle insertion into muscles is required, a procedure most patients find uncomfortable. Consequently, electromyography is not well tolerated in serial studies and clinical trials. When electromyography is done in DSP, abnormal results are observed in the more distal muscles in moderately to severely advanced disease. Reportedly, fibrillation potential activity can be observed earlier than abnormal NCS findings in DSP [89], but the specificity of such results is in doubt. Increased insertional activity, abnormal spontaneous activity (fibrillation potentials), and loss of recruitment, i. e., loss of the normal amount of motor unit potential activity, are observed in any process affecting motor axons sufficiently. Remodeling of motor unit potentials due to denervation with subsequent reinnervation is indicated by the presence of motor unit potentials with increased durations, increased amplitudes, and poly-phasic form. More specialized techniques such as single-fiber electromyography are useful mainly in a research capacity rather than in the routine diagnostic evaluation of DSP. These more sophisticated techniques may yield more information on motor unit remodeling in reinnervation [98], but are of limited value for routine evaluation of patients with DSP.
Results Expected
Typical tracings of motor and sensory NCS in patients with DSP are shown in Figures 5.9 and 5.10. These figures illustrate printouts from an electromyograph (Medtronic. Mississauga. Canada). The parameters reported most commonly are: distal latencies, amplitudes, conduction velocities, and F wave latencies. In mild and early neuropathy, all results may be within normal limits, in part, normal NCS findings may indicate that the disease process is mild and has not had discernible effects on the peripheral nerves in spite of the presence of symptoms and deficits of DSP on clinical testing. A more likely explanation is that the values in an individual patient are abnormal for that subject, but overlap with normative ranges for the particular laboratory. In other patients, marked changes in NCS are observed with minimal or no clinical symptoms. The first NCS abnormalities are observed in distal lower limb sensory responses, with a reduction in sensory potential amplitudes. As more large fibers are lost, the distal sensory latency increases and the conduction velocity decreases. As the disease progresses, similar changes in motor nerve conduction studies are observed. Early changes in the distal motor and sensory nerve conduction parameters of the median nerve are observed commonly [80,81,94,97]. With disease progression, more severe NCS changes are observed. Finally, the distal motor and sensory responses are lost completely.
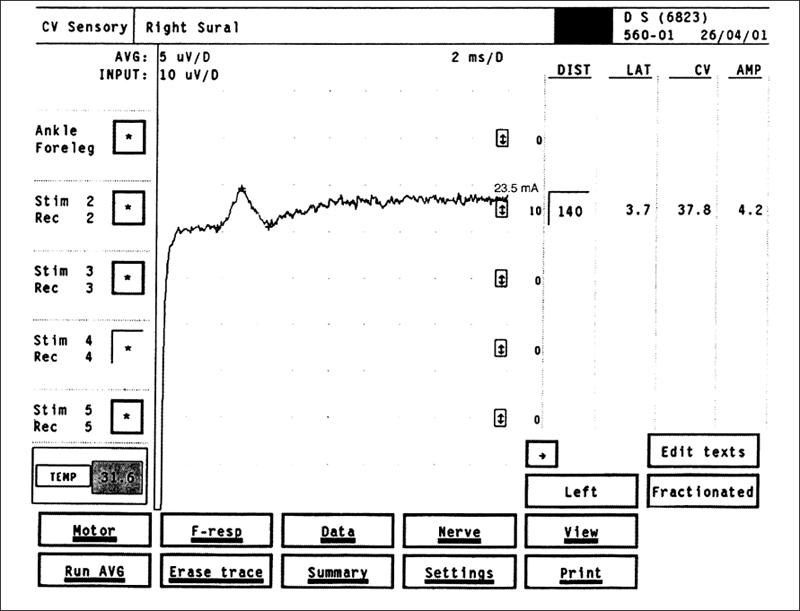
Fig. 5.10 Sural sensory NCS in a patient with DSP. The amplitude of 4.2 μV is below normal, and the conduction velocity of 37.8 m/s is reduced
The amount of information from NCS can be daunting. In order to comprehend the results clearly and to analyze the data, clinically relevant summary scores have been utilized. Rank sum scores for conduction velocity and amplitude [60], summed amplitude and conduction velocity scores [99], and a single index of polyneuropathy. IPN [100], are different ways to assimilate a large amount of confusing data.
Relationships to Clinical Measures and Pathologic Changes
The NCS are valuable as they provide reliable, quantitative information on nerve function. Coefficients of variation on repeat testing are lower than other testing methods such as quantitative sensory testing or clinical examination, as demonstrated in Table 5.4 [33,64], The NCS findings correlate both with morphologic severity of DSP [101] and with clinical severity of disease [77]. NCS reflect both the acute and the chronic stages of glycemic control [99]. Changes in conduction velocity mirror acute changes in metabolic control [102–105], but can also reflect long-term changes in glycemic levels [63,99]. Thus, NCS are a meaningful, reliable, and standardized way of measuring nerve function accurately in DSP. They carry implications as to underlying nerve structure (degree of nerve fiber loss), the clinical findings, and glycemic control. For these reasons, they continue to be of great value in the evaluation of DSP in clinical trials. Routine NCS testing of all subjects with diabetes may not be feasible for practical considerations, but NCS remain mandatory for patients in the clinic when there is any doubt about the diagnosis of DSP, or an alternative diagnosis is being considered in the differential diagnosis of an individual subject. Changes in NCS occur slowly in most DSP patients, with little to no change in parameters observed in 12 months. More rapid decline should raise concerns about the adequacy of glycemic control, or the presence of comorbid disease such as CIDP.
Limitations
Large-Fiber Activity Measure
One of the major criticisms of NCS in DSP is that large-fiber activity is measured, but that small-fiber function is not assessed. In rebuttal, it should be remembered that most subjects with DSP have diffuse nerve fiber impairments affecting all fiber sizes. The hallmark of the disorder is progressive loss of all fibers, both large and small. Thus, NCS remain a valid and important measure of nerve function in DSP.
Accuracy
The normative ranges for NCS parameters overlap with abnormal values in DSP, thus limiting the sensitivity and accuracy of testing. Nevertheless, NCS are the most sensitive measure of DSP; other testing modalities do not have the same degree of sensitivity [35,106]. As a result, NCS remain the best measure of DSP.
Small-Fiber Measures
Increasingly, tests of small-fiber function have been investigated for utility in the evaluation of subjects with DSP [107]. The sympathetic skin response (SSR) is one such method. In response to different stimuli, a long-latency response can be recorded from the palmar and plantar surfaces of the extremities. These responses are thought to represent activity of sympathetic peripheral nerve fibers. Unfortunately, the responses can be absent in healthy subjects. Changes in latency and amplitude parameters are not evident in a year, and the parameters do not correlate with small-fiber symptoms [108]. The simple absence or presence of the SSR does correlate with DSP duration and duration of diabetes mellitus; but no more refined information is obtained with this type of investigation [108,109].
Methods of testing of the autonomic system are diffuse, with many different methods, testing paradigms, and results [110–113]. Reproducibility has been a problem. Recently, a system was developed which showed lower test variability with a central reading group [114]. Such standardized approaches may improve the reliability of these investigations and lead to their more routine use in the future. Presently, these test methods are utilized mainly for clinical research trials and not in most clinics.
None of the small-fiber investigational methods is standardized, widespread, and practical. Newer methods including skin punch biopsy with evaluation of intradermal fibers are promising, but none is yet a standard way to evaluate DSP, even in clinical trials.
Summary
NCS are the most reliable and accurate measure of peripheral nerve function in DSP. Close relationships with morphologic and clinical measures of neuropathy confirm the validity of this type of testing. NCS are mandatory when alternative diagnoses in addition to DSP are being considered, and remain an essential element of clinical trials in DSP. If a therapeutic intervention for DSP does not produce an improvement in NCS, it is unlikely to be an effective therapy for this indication.
 Quantitative Sensory Testing
J.C. Arezzo
Introduction
The progressive loss of distal cutaneous sensation is the hallmark of the most common form of neuropathy associated with diabetes, symmetric distal polyneuropathy. While individuals are usually acutely aware of abnormalities resulting in “positive symptoms.” such as pain and paresthesias, changes in sensory function resulting in “negative symptoms.” such as numbness, are often insidious and can remain undetected by both patient and physician. Accurate and reliable detection of the loss of sensation associated with diabetic neuropathy has gained increasing importance as new putative therapies emerge and as the link between diminished sensation, ulcerations, and ultimately amputations is solidified. For many, the sensory portion of the neurologic examination has remained unchanged for the past 100 years, relying almost exclusively on a tuning fork, pin, cotton wisp, and perhaps the “cold” end of a reflex hammer. Alternatively, the limits of sensation can be determined by combining quantitative methods for the accurate delivery of stimuli with established psychophysical procedures to assess signal detection. The term “quantitative sensory testing” (QST) is appropriately applied to procedures where the intensity and characteristics of the stimuli are well controlled (i. e., same on Tuesday as on Friday; same in Boston as in Düsseldorf) and where the detection threshold is determined in parametric units that can be compared to established “normal” values.
Standard instruments and highly accepted procedures have been adopted for quantitative evaluation of frequency specific auditory deficits, as well as changes in contrast sensitivity and visual acuity. However, the quantitative evaluation of distal cutaneous function, which is key for diabetic neuropathy, has proven a more formidable task. There are several reasons for the added difficulty of QST of somatosensory function:
1. Cutaneous sensation involves a wide variety of submodalities (vibration, light touch, cold, pain) which are often associated with specialized distal receptors and distinct spinal pathways, and are carried by peripheral axons of differing cross-sectional diameter and myelination patterns.
2. Due to the extreme length of the cutaneous sensory pathways, accurate assessment of change in sensation requires the measurement of sensory function at several points along a distal-to-proximal gradient.
3. Distal cutaneous sensory function is strongly influenced by the local modulation of receptor sensitivities. For instance, the threshold of nociceptors can be lowered by more than 100-fold by the triggered release of neuropeptides in the vicinity of stimulation, and adaptation can dramatically and rapidly alter the sensitivity of mechanoreceptors.
In spite of these difficulties, the past two decades have witnessed the development of a number of commercially available instruments for QST of cutaneous functions including touch, vibration, warmth, cold, and pain. Devices have ranged from complex computer-aided instruments (e. g., CASE IV, pioneered by Peter Dyck and colleagues [115,116]) to simple “handheld” tools with no moving parts (e.g., monofilaments) [117]. In the diabetic population. QST procedures have been used to document the presence of subclinical neuropathy [e.g.. 118], to follow the progression of neuropathy in a large cohort of subjects [e.g.. 119], as part of a comprehensive battery of neurologic measures [e.g., 120], to predict patients “at risk” for foot ulcerations [e.g., 121], and as primary efficacy endpoints in a series of multicenter clinical trials evaluating the prevention or treatment of diabetic polyneuropathy [e. g., 122]. There have been several reviews of QST procedures [123–131], and several “consensus expert panels” have considered the strengths and limitations of QST as a method of assessing sensory neuropathy [132–134], This section is not intended as acomprehensive review of QST methodology. Rather, we will examine how diabetes may alter sensory thresholds, and will explore the impact of some recent developments on the use of QST for the assessment of diabetic neuropathy.
Pathophysiology Underlying the Elevation of Sensory Thresholds
Multiple mechanisms have been proposed to account for the pathogenesis of diabetic neuropathy, including microvascular disease [135], modification of proteins critical to neural function by glycation and glycosylation [136], altered metabolism of fatty acids [137], increased activity in the polyoi pathway causing a reduction in Na+/K+ adenosine triphosphatase activity [138], basement membrane replication and pericyte degeneration [139], a reduction in the expression or binding of neurotrophic factors [149], and superoxide overproduction [141]. It is likely that several or all of these factors interact to cause diabetic neuropathy and that their relative contribution may differ across patients, reflecting both genetics and diet. Although the mechanisms of neuropathy are still controversial, it is generally agreed that in its most common manifestation, diabetic symmetric polyneuropathy is a type of “length-dependent distal axonopathy” [142]. In this condition, the neuronal soma remains relatively unaffected at a time when the distal peripheral axon begins to undergo pathologic alterations. Change in distal sensory function, specifically hypoesthesia, is the result of a series of structural alterations in the distal axon that underlie both acute and long-term deficits.
Transduction
The first critical step in sensory processing, termed transduction, is the conversion of energy as it occurs in the real world (e. g., mechanical, thermal) into “neural energy” in the form of depolarizing or hyperpolarizing transmembrane signals within neurons. Mechanoreceptors, such as those sensitive to vibration or discriminative touch, generally utilize a nonneural element to amplify energy or to aid in adaptation. However, in the somatosensory system, all sensory transduction occurs directly in myelinated or unmyelinated distal axons. At the distal extreme, the surface area of some afferent axons is expanded through a series of filopod extensions, which greatly facilitates transduction (Fig. 5.11). In a series of studies, Schaumburg and colleagues documented that the loss of the filopod extensions, and the consequent loss of axon surface area, was the initial pathologic alteration associated with an experimental distal axonopathy similar to that seen in many diabetic subjects [143,144]. These changes undoubtedly result in the loss or redistribution of transmembrane channels tuned to cutaneous energy (e.g., ion channels that change conformation due to mechanical stretch). Thus, the initial stages of a distal axonopathy can alter transduction, resulting in elevated sensory thresholds before axonal loss or altered conduction within sensory pathways has taken place.
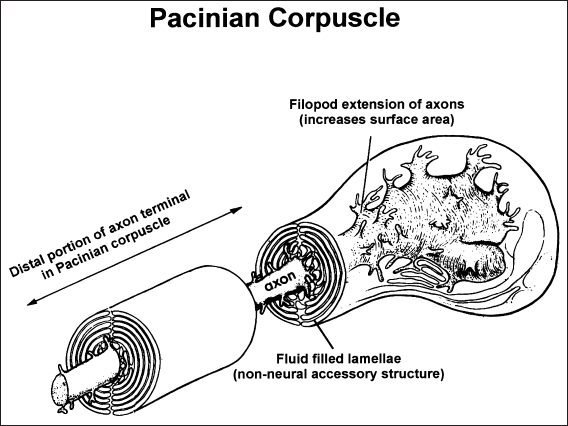
Fig. 5.11 Distal extreme of a “normal” axon innervating a Pacinian corpuscle, Note the filopod processes that characterize the axon terminal and thereby expand the surface area. These processes contain dense arrays of transmembrane channels, which change conformation as a function of mechanical energy (e. g., sensory transduction). In the early stages of a distal axonopathy, such as that associated with diabetic neuropathy, these filopod extensions are lost and the sensitivity of the receptor is diminished
Receptors may also increase their sensitivity to stimulation in the early stages of diabetic neuropathy, resulting in hyperesthesia [118]. These changes may in part reflect abnormalities in distal peptide neurotransmitter levels, which can be modified in peripheral nerve fibers of diabetic patients prior to axon loss [145].
Conduction
At threshold, the patient is required to detect a specific sensory signal against a background of transmitted neural events. As well documented in signal detection theory [146], the process can be modeled as a statistical signal-to-noise task on the sensory side, with a superimposed “decision criteria” on the output side. The integrity of the sensory signal is determined by the quality of receptor activation (i.e., transduction) and by the fidelity of the signal transmission along the remarkable length of the neuraxis from peripheral receptor to higher brain centers. The speed and synchrony of conduction is therefore a key component to the detection of low threshold stimulation. Several aspects of distal axonopathy interfere with optimal nerve conduction and consequently elevate sensory thresholds. These include changes in nodal environment, alterations in axonal cross-sectional diameter, and alterations in axo-glial junctions, in diabetic neuropathy, these early pathologic changes combine to reduce maximum conduction velocity and response synchrony (see [147] for a recent review). Deficits in conduction may be especially important in the loss of sensation critically dependent on the accurate transmission of temporal information, such as discriminating between vibration and pressure or determining the pattern of movement across a receptor surface.
Fiber Loss
In its later stages, distal axonopathy associated with diabetic neuropathy results in the frank loss of axons due to a dying-back process [148]. At these time points, Wallerian degeneration is evident, there is a reduction in fiber density, and there may be an alteration in the axon diameter histogram [149]. Sensory loss is usually extensive due to a combination of altered transduction and conduction in surviving axons and a reduction in the number of available sensory fibers.
Methodology
The sensitivity and reliability of QST procedures are determined by a combination of the equipment selected, the testing algorithm utilized, the site evaluated, and the population examined.
Equipment
Minimally, QST equipment should provide for: (1) accurate control of stimulus intensity in meaningful units (e.g., micrometers of vertical displacement for vibration),(2) control over stimulus characteristics (e. g., vibration waveform; thermal rate of change),(3) sufficient dynamic range of intensity to allow evaluation of multiple degrees of neuropathy,(4) calibration procedures to ensure consistency,(5) the ability to utilize multiple psychophysical procedures (e.g., forced choice; method of limits), and (6) the ability to measure sensation at multiple anatomical sites. There is no ideal QST device for all types of assessment of diabetic neuropathy. The instrument appropriate for the rapid screening of a large diabetic population for the magnitude of sensory loss that may indicate “risk” for foot ulceration is different from the device ideal for the detection of subclinical changes in asymptomatic diabetic subjects. The speed and ability to assess multiple points along a distal-to-proximal gradient afforded by a simple handheld device, such as the biothesiometer, may offset the greater control over stimulus characteristics and the precise adherence to a specified testing algorithm provided by a computer-assisted device.
Comparison of QST findings across instruments must be done with caution. In spite of the strong recommendations of several “consensus panels” [132–134], the units of measurement reported are often highly specific to the instrument utilized and difficult to relate to true physical intensity (e.g., volts for the biothesiometer). Although clumsy and inaccurate, comparisons of QST findings across some instruments can be approximated by considering the degree of deviance in the test scores from values in an appropriate norm population.
Algorithm
A number of different psychophysical QST procedures are available (see [150,151] for review), each with its strengths and limitations. For instance, a true multi-step, forced-choice algorithm is very accurate, but time-consuming. The use of this procedure may result in fatigue and changes in attention level during testing and may not be appropriate for an evaluation requiring the assessment of multiple sites and/or multiple modalities in the same subject. In most subjects, the use of an alternative four-, two-, and one-stepping algorithm adds speed without significant loss of accuracy [152]. If ramp stimulation is utilized, as is often the case in assessing thermal sensitivity, the rate of the change in intensity and the use of both ascending and descending ramps are important considerations [153,154]. If the ramp is linear, the start point predictable, and the rate of change rapid, a critical temporal clue may be provided to the subject which could confound the accurate assessment of threshold values. There are substantial arguments in the QST literature regarding the optimal testing algorithm, and it is clear that the absolute value of thresholds may be under-or overestimated by the use of specific procedures. However, it is also clear that QST data obtained with a wide range of psychophysical procedures can provide a sensitive index of diabetic neuropathy if the data are compared to those of a normal population examined with the same testing method.
Anatomical Site
The distribution and density of cutaneous receptors differ substantially across the body surface, with different gradients evident for each modality. Thus, the density of Meissner corpuscles sensitive to light touch is more than an order of magnitude higher in the distal fingertips than the forearm, while thermoreceptors are more evenly distributed along a distal-to-proximal gradient. In selecting an anatomical site to evaluate, there is often a tradeoff between repeat test reliability and sensitivity to change in the induced neuropathy. For instance, thermal thresholds are more reliable if they are measured at a site on the wrist, which allows the positioning of a large stimulus probe. However, these sites may be relatively insensitive to the earliest change in transduction at the distal extreme of the longest sensory axons of the fingers. The threshold for detection of vibration is often lowest over a bony prominence, but the use of these sites may allow the transmission of the vibrating stimulus to more proximal receptors. Further, limiting QST measurement to a single site, by the use of a fixed stimulus probe, may miss deterioration or improvement in sensory function at a different point on the distal-to-proximal gradient. As is the case for instruments and algorithms, there is no one ideal site for QST evaluation; however, evaluation of regions of high receptor density and low sensory thresholds maximize sensitivity to alterations in transduction and conduction.
Population
The clinical or experimental population evaluated is usually fixed by the needs of the assessment, but it is critical that QST data in these subjects be compared to an appropriate normal population. Various QST measures are affected by anthropometric variables such as age [155,156], gender [157], body mass [157,158], and history of smoking and alcohol consumption [158]. These factors must always be considered in determining the “normal range” against which to evaluate deficits in diabetic subjects. The correlation of QST findings with other measures of neuropathy (e.g., maximum conduction velocity) and the repeat measure reliability of the QST data are also influenced by the severity of neuropathy in the population examined [118].
Vibration Perception Threshold
The relationship between elevated vibration perception threshold and diabetic neuropathy has been documented for almost 100 years [159]. The sensitive perception of vibration in the 50-300 Hz range principally reflects the activation of mechanoreceptors (i.e., Pacinian and Meissner corpuscles), conduction in large-diameter myelinated peripheral axons, and transmission through the dorsal column spinal pathways. The very nature of the temporal component of the vibrating stimuli, as opposed to simple mechanical pressure, requires high-fidelity afferent conduction and is thus sensitive to multiple aspects of a distal axonopathy.
There have been multiple studies and multiple instruments utilized to document the correlation between loss of vibration and a variety of indicators of progression of diabetic neuropathy [e.g., 115,125, 160–64]. Dyck and colleagues [118] used computer-assisted QST to compare vibration thresholds with signs and symptoms of neuropathy in three large cohorts: the Rochester Diabetic Neuropathy Study, the recombinant human growth factor study, and the pancreas-renal transplant cohort. In these patient groups, there was a “strong and consistent correlation” between sensory loss and other markers of diabetic neuropathy. Further, the data confirmed that vibration thresholds are especially sensitive to mild or subclinical neuropathy. Davis et al. [165] also demonstrated that vibratory thresholds can detect subclinical neuropathy in children and adolescents with type 1 diabetes. Nerve conduction velocity studies subsequently confirmed the neuropathy detected by QST in these young patients. At the other end of the severity spectrum. Boulton and colleagues [161] documented that vibration thresholds provided a strong indication of “risk” for future ulceration across a wide range of ages and durations of diabetes. In a four-year prospective study [166], patients with baseline threshold elevated above a fixed value (i. e., 25 V with the biothesiometer) were seven times more likely to develop foot ulcers. This trend was confirmed in a longer study in which patients with initial vibration thresholds above the same value had a much higher prevalence of foot ulcers over the course of a 10- to 13-year follow-up period [167]. A recent evaluation of 1035 patients with insulin-dependent or non-insulin-dependent diabetes reported that each one-unit increase in vibration threshold (voltage scale) at baseline increased the hazard of foot ulceration by 5.6% over a one-year study period [119].
Thermal Perception Threshold
Most mechanoreceptors and free nerve endings are responsive to thermal energy, but true cutaneous thermoreceptors are orders of magnitude more sensitive, responding to shifts in temperature of less than 1 °C. Separate cold and warm thermoreceptors have been identified, generally characterized by small receptor fields (usually less than 1 mm2) and relatively slow conduction velocities. In primates, some cold receptors are innervated by thinly myelinated A8 fibers with conduction between 3 and 20 m/s [168].The sensation of “pain” is also elicited by the high-intensity stimulation of thermoreceptors, especially those sensitive to warming, leading to the identification of “heat pain” thresholds.
As is the case with vibration, elevated thermal thresholds have been well documented in patients with diabetic neuropathy defined by other criteria [116,118,123,125,160,169,170] and their alteration has been demonstrated to predict foot ulcerations [171]. Elevated thermal thresholds have been reported in up to 75% of subjects with moderate to severe diabetic neuropathy [172]. Generally, there is a high correlation between elevated thermal and vibration thresholds, but these measures can be dissociated, suggesting a predominant small- or large-fiber neuropathy in individual patients [164]. Lowered “heat pain” thresholds have also been reported in patients with diabetic neuropathy, and this condition may be an important indication of hypersensitivity associated with early changes in distal nerve segments [118]. The correlation of structure and function in distal small-diameter axons may now be possible by combining thermal thresholds with punch biopsy procedures [173–175].
As there is no reasonable zero energy level, the assessment of thermal thresholds has proven technically more challenging than the measurement of vibration thresholds. The testing procedures are generally longer and the obtained results more variable. Computer-assisted procedures may be especially valuable in examining thermal thresholds. Dyck and associates [176] recently reported that the reproducibility of thermal sensory testing with the CASE IV in normal subjects falls within ±1 stimulus step 88% of the time. However, they also noted that variables such as high or low baseline skin temperature can affect some measurements such as heat pain responses and must be carefully controlled.
Simple Devices
A recent trend is the introduction of simple, handheld QST devices, which are inexpensive and easy to operate. These devices are generally less sensitive and accurate than the more elaborate instruments and they usually assign thresholds to progressive categories (e.g. 10g vs 5g) rather than continuous variables. However, they can play a strong role in the rapid screening of a large “at risk” population or in the longitudinal evaluation of individual patients at the primary care site, in addition to speed and ease of testing, these devices facilitate the “mapping” of sensory loss, which may significantly augment the sensitivity of QST evaluations. Semmes-Weinstein monofilaments are perhaps the most widely used handheld QST instrument for the assessment of large diameter fiber function. [117]. A “quantitative” 64-Hz tuning fork has been used to document a treatment-related improvement in diabetic neuropathy [177]. This device takes advantage of a visual optical illusion to allow investigators to determine the intensity of residual vibration on a 0-8 scale at the point of threshold (disappearance of sensation), rather than simply the time since striking the tuning fork. Another recently developed handheld QST device, the Tactile Circumference Discriminator, assesses the perception of calibrated change in the circumference of a probe (a variant of two-point threshold) and has also proven effective in the detection of diabetic neuropathy [178]. The rapid assessment of small-fiber function has been aided by the introduction of a digital handheld thermal probe. This device uses the Peltier effect to deliver calibrated and stable thermal stimuli over a range of 40 °C [179]. By selecting an appropriate testing algorithm, an investigator can evaluate both cold and warm sensation along a distal-to-proximal gradient (Fig. 5.12).
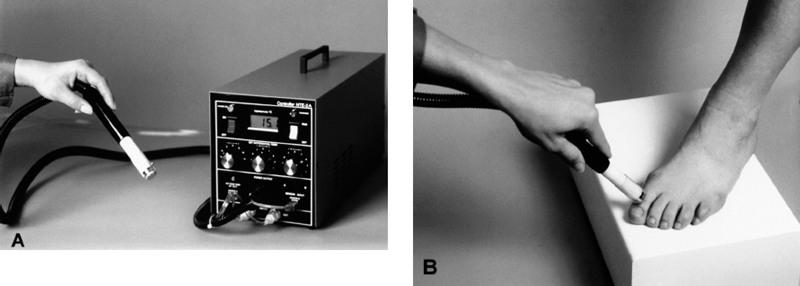
Fig. 5.12 New handheld instrument for the assessment of thermal thresholds. A Temperature at the surface of the handheld probe can be digitally set and maintained over a 40°C range. The instalment is especially valuable for mapping sensory loss on a receptor surface (e.g., B ventral surface of foot) or for determining changes in sensation along a distal-to-proximal gradient
Epidemiologic Studies and Multicenter Clinical Trials
QST measures have been incorporated in large-scale studies of potential neuropathy sponsored by the United States Centers for Disease Control. National Institute of Occupational Safety and Health, and Environmental Protection Agency. In addition, in the past decade QST procedures have been widely used as both primary and secondary efficacy endpoints in a series of multicenter clinical trials designed to evaluate treatment of diabetic neuropathy. Positive findings in some of these studies [180,181] have been more than offset by negative results in the majority [e.g., 122]. Nonetheless, QST has provided a valuable tool for tracking changes in subjects with diabetic neuropathy and has been critical in selecting appropriate subjects, based on degree of neuropathy, for inclusion in clinical trials. These multicenter studies have demonstrated that QST procedures could be standardized across test sites and that the coefficient of variance of these measures could be reduced to levels affording reasonable statistical power. For example, vibration thresholds in a group of diabetic subjects receiving placebo in a double-blind study were significantly worse at the end of 18 months compared to their baseline values [182]. The fact that the relatively small progression of sensory loss in an untreated population of diabetic subjects over the study period was detectable is very encouraging for future intervention studies.
Limitations of QST in the Assessment of Diabetic Neuropathy
While it is clear that changes in sensory thresholds, as measured by a variety of QST procedures, are associated with the onset and progression of diabetic neuropathy, caution must be exercised in interpreting these findings. An elevated sensory threshold is not specific for peripheral neuropathy. Sensory detection reflects the integrity of the entire sensory pathway from peripheral to cortex, and altered sensory function may be due to deficits in elements beyond the peripheral nerve. For example, abnormal QST results have been reported in subjects with multiple sclerosis and in patients with isolated cortical lesions. Further, all QST procedures are based on the report of the subject, which can be influenced by psychological factors such as motivation, fatigue, and attention. Expectancy and subject bias are additional factors that can exert a powerful influence on QST findings [183,184].
QST should not be used to diagnosis diabetic neuropathy in isolation. Rather, the data from these procedures can augment the neurologic examination, provide valuable parametric information as to the nature and distribution of sensory loss, document progression or treatment related improvement in modality specific sensation, and focus available medical resources on patients at significant risk for ulceration and amputation.
 Motor Function
H. Andersen and J. Jakobsen
Introduction
Motor weakness in diabetic patients has been recognized for more than a century. Before the era of insulin treatment, paresis of feet and legs was a well-known concomitant of diabetes [185]. Nowadays, the general opinion is that motor disturbances in diabetes are rare and are restricted to isolated nerve manifestations or to polyneuropathy with distal symmetric distributions in long-term patients.
There are several reasons why motor disturbances have been neglected in diabetic neuropathy. Sensory symptoms such as pain and paresthesias are bothersome and attract much attention, whereas motor impairment is silent and often unrecognized. Evaluation of sensory function is easy to perform due to the development of simple techniques to determine sensory thresholds. Sensory values also show acceptable variation and high reproducibility. In contrast, evaluation of motor performance is technically more complicated and strength varies highly between individuals depending upon sex, body weight, and physical activity. Quantitative sensory testing is recommended for evaluation of diabetic neuropathy, whereas quantitative motor assessment is not part of the diagnostic work-up [186].
The significance to the individual diabetic patient of motor weakness has not been sufficiently elucidated. It is possible that weakness of active ankle and knee movements leads to walking instability, falls, injuries, and foot ulcers. Motor weakness might, therefore, play an important role for one of the major long-term complications, the diabetic foot. In clinical studies and trials using neuropathic endpoints to register the prevalence and severity of neuropathy, quantitative evaluation of muscle strength might contribute to the overall assessment of the patients. Also, quantitative evaluation of muscle strength is relevant in patients with proximal symmetric or asymmetric muscle weakness to monitor the clinical course and the effect of treatment. Involvement of the motor system in diabetic neuropathy can, in addition, be assessed using imaging techniques such as magnetic resonance imaging, which can detect minor changes in the volume of muscles, indicating muscular atrophy [187].
This section deals with the theoretical and practical aspects of motor evaluation. Motor function relies on the activity of cortical motor areas, the corticospinal tracts, the final common pathway from the alpha motoneuron to the muscle fibers, and the contractile apparatus in the muscle. Abnormalities within any part of the motor system can lead to motor dysfunction with impairment of simple movements requiring a minimum of strength to alterations of highly complex ballistic movements.
A considerable number of quantitative techniques have been developed to evaluate the various parts of the motor system. In diabetic neuropathy, assessment of muscle strength is probably the most direct way of evaluating motor function. Also, in vivo imaging of the striated muscles is a promising technique that enables direct detection and quantification of muscular atrophy.
Muscle Strength
Evaluation of motor performance includes assessment of maximum muscle strength, which can be performed using semiquantitative and quantitative techniques. Semiquantitative techniques encompass simple functional tests and manual muscle testing whereas quantitative assessment is obtained by dynamometry.
Simple Functional Tests
Distal motor function is evaluated during the clinical examination from the ability to walk or stand on the heels and toes. In Dyck’s classification of diabetic neuropathy, inability to stand on the heels defines more severe symptomatic neuropathy as the condition reflects weakness of the ankle extensors [188]. In contrast, isolated inability to stand and walk on the toes does not indicate peripheral neuropathy but rather an intraspinal disorder [189]. This may suggest a preponderance of weakness of the ankle extensors in diabetic-neuropathy. However, quantitative studies have shown that a similar degree of weakness occurs in the ankle flexors [190]. Because of the higher safety factor, a greater degree of weakness of the ankle flexors can be tolerated before clinical dysfunction arises.
Evaluating the ability to stand up from a kneeling position can be used to test proximal motor function. This test is relevant in patients with severe sensorimotor polyneuropathy or with proximal diabetic neuropathy. Since functional tests are quickly and easily performed and do not require any equipment, they are suitable for large clinical studies such as epidemiologically based surveys [191]. The sensitivity and specificity of an abnormal functional test in relation to muscle weakness is, however, unclear. This is partly due to the lack of knowledge about how age, body weight, loss of proprioception, and impaired vision affect test results. Therefore, accurate quantitative information on muscle strength can not rely on functional tests.
Manual Muscle Testing
Manual muscle testing is part of the standard clinical examination but receives less attention in the evaluation of diabetic neuropathy. Several scoring systems have gained popularity, all of which apply ordinal scales, the two most commonly used being the Medical Research Council (MRC) system [192] and the motor part of the neurological impairment score (NIS) [193], The alternative clinical scoring systems do not include manual muscle testing [194,195].
The MRC scale provides high precision for quantification of very weak muscle groups, which are rare in diabetic neuropathies. Both the NIS and the MRC scale have low sensitivity for the detection of slight to moderate degrees of symmetric weakness [196,197]. Manual muscle testing provides a quick evaluation of the muscle strength of all the major muscle groups and therefore will remain a valuable technique in diabetic neuropathy. It is less suitable for therapeutic trials as considerably more subjects are needed in order to obtain the same level of statistical significance [198].
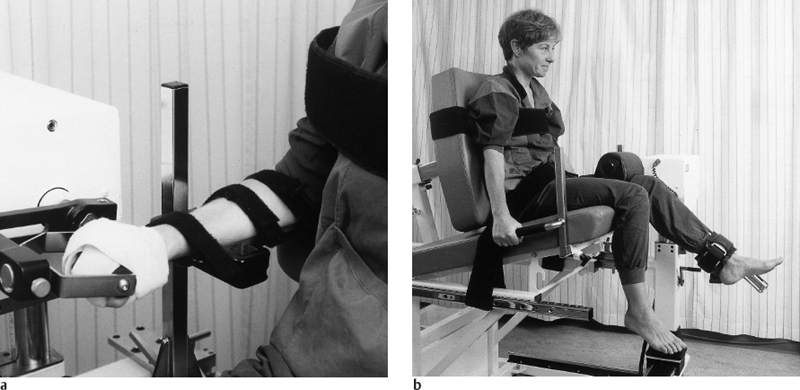
Fig. 5.13 Experimental set-up for evaluation of maximum isokinetic strength of a the wrist flexors and extensors and b the knee extensors and flexors
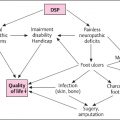

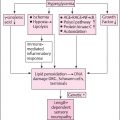
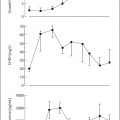
Stay updated, free articles. Join our Telegram channel

Full access? Get Clinical Tree


