Adenocarcinoma
8140/3
Lepidic adenocarcinoma
8250/3
Acinar adenocarcinoma
8551/3
Papillary adenocarcinoma
8260/3
Micropapillary adenocarcinoma
8265/3
Solid adenocarcinoma
8230/3
Invasive mucinous adenocarcinoma
8253/3
Mixed invasive mucinous and non-mucinous adenocarcinoma
8254/3
Colloid adenocarcinoma
8480/3
Fetal adenocarcinoma
8333/3
Enteric adenocarcinoma
8144/3
Minimally invasive adenocarcinoma
Non-mucinous
8250/2
Mucinous
8257/3
Preinvasive lesions
Atypical adenomatous hyperplasia
8250/0
Adenocarcinoma in situ
8140/2
Non-mucinous
8410/2
Mucinous
8257/3
It should be emphasized that these major changes in adenocarcinoma classification are deeply related to the ever-growing recognition that a multidisciplinary approach is mandatory for the classification to be clinically relevant: (1) recent advance in molecular biology/oncology has led to the discovery of epidermal growth factor receptor (EGFR) mutations and ALK gene translocations almost exclusively in lung adenocarcinomas, and targeted therapy with tyrosine kinase inhibitors (TKIs) has become available for these tumors; (2) progress in treatment requires discrimination of squamous cell carcinoma from non-squamous, non-small cell carcinomas such as in application of certain drugs including pemetrexed and bevacizumab; and (3) advancement in knowledge of the intimate correlation between the developmental stages of adenocarcinoma and corresponding CT images has led to its utility in prediction of prognosis and choice of treatment in lung adenocarcinomas [3].
1.1.2 Preinvasive Lesions
1.1.2.1 Atypical Adenomatous Hyperplasia (AAH) (Fig. 1.1)
AAH, by definition, is a small, localized proliferation of mildly to moderately atypical type II pneumocytes and/or club cells (formerly named as Clara cells) lining alveolar walls and sometimes respiratory bronchioles [1]. This lesion is usually found incidentally in lung specimens resected for cancer or may incidentally be detected as a pure ground-glass nodule (GGN) on high-resolution CT scans during medical examination for some reasons.
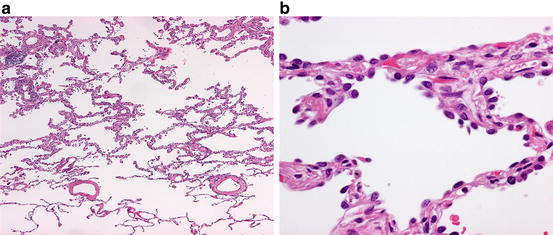
Fig. 1.1
Atypical adenomatous hyperplasia. (a) Low-power view. Note the slightly thickened alveolar septa with lining cells that show a sharp demarcation from the normal lung parenchyma occupying the lowermost quarter of the field. (b) High-power view. Cuboidal to somewhat flattened cells with mildly atypical nuclei and scant cytoplasm are growing along alveolar septa
In gross examination, AAH typically is a few millimeter-sized, barely discernable gray-white nodule in the peripheral lung. Histopathologically, the distinction between AAH and AIS is sometimes difficult because both show the lepidic pattern or growth along the alveolar wall throughout the lesion, but AAH typically is up to 5 mm in size, and the constituent cells show less nuclear atypism and are less densely populated along alveolar walls than those of AIS [5, 6]. Somewhat paradoxically, the cell shape in AAH is more various with cuboidal, pyramidal, or flat appearances than that of AIS.
AAH is considered to be a precursor lesion of peripheral lung adenocarcinoma. Clinicopathological and clonality/mutational studies have demonstrated that AAH is a clonal lesion with the potential for progression to adenocarcinoma [5–7], harboring KRAS and EGFR mutations in up to 33 % and 35 %, respectively [1, 8–11]. There is some evidence that KRAS-mutated AAH may not progress to AIS or invasive adenocarcinoma as frequently as EGFR-mutated AAH and that major driver genes (EGFR/KRAS/ALK/HER2) mutation-negative AAH/AIS may not progress to invasive adenocarcinoma so frequently [8, 12]. A recent genetic analysis of AAH/AIS/MIA utilizing next-generation sequencing (NGS) [13] showed an average mutation rate of 2.2 non-synonymous mutations (range 0–6 mutations) per one lesion among 25 AAHs, the most frequently mutated genes being BRAF and ARID1B. Genes associated with DNA repair and chromatin remodeling network such as ATM and ATRX were also mutated in multiple lesions, suggesting AAH may be predisposed to the acquisition of secondary genetic aberrations. Mutations in TP53, EGFR, and IGFR1 were noted in all developmental stages of AAH/AIS/MIA, but BRAF mutation was rarely found in MIA or invasive adenocarcinoma, again suggesting the inequity in the progression potential among various mutations.
The natural history of AAH is not fully elucidated, but a recent radiographic study [14] showed that solitary pure GGNs 5 mm or smaller in CT images, the majority of which presumably represented AAH, grew in 10 % of the cases and developed into MIA or invasive adenocarcinoma in 1 % with the mean period of 3.6 years. This observation appears to corroborate the aforementioned genetic inequity in the progression potential of AAH.
1.1.2.2 Adenocarcinoma In Situ (AIS) (Fig. 1.2)
AIS is a newly introduced entity in the current WHO classification [1]. It is a small (<=3 cm), localized adenocarcinoma with neoplastic cell growth restricted along alveolar walls (pure lepidic growth), lacking stromal, vascular, or pleural invasion. The constituent cells are mostly non-mucinous, but mucinous in rare cases as well. AIS is usually found incidentally as a pure GGN or part-solid nodule on CT scan [14, 15]. Mucinous AIS tends to present as a solid or part-solid nodule with air-containing spaces [16].
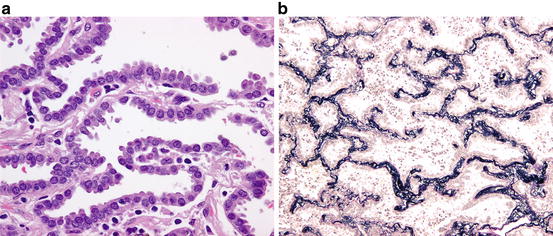
Fig. 1.2
Adenocarcinoma in situ (non-mucinous type). (a) The alveolar septa are lined by atypical type II pneumocyte/club cell-like cells. (b) The elastic framework of the alveolar septa in AIS is completely preserved. (Elastic van Gieson stain)
Grossly, AIS is an ill-defined, gray-white to tan-colored nodule with somewhat spongy consistency. Histopathologically, type II pneumocyte/club cell-like cuboidal to columnar cells with mild to moderately atypical nuclei are seen along alveolar walls. The alveolar walls are almost normal to moderately thickened with collapse-type fibroelastosis [17]. In the rare mucinous AIS, the lining cells have mucinous cytoplasm, resembling gastric foveolar epithelium or goblet cells. Non-mucinous AIS expresses TTF1 and napsin A, whereas mucinous AIS is often negative for these immunohistochemical markers of alveolar pneumocytes and positive for gastric epithelium-associated mucin such as MUC5AC and MUC6 [18, 19].
Genetically, non-mucinous AIS harbors EGFR mutations frequently (40–86 %), but KRAS mutations rarely (0–4 %) [12, 19–23]. A recent NGS analysis of AIS in five patients showed an average mutational rate of 6.2 non-synonymous mutations per patient; the mutational landscape varied widely, most mutations including EGFR and TP53 mutations found only in one patient [13]. The lower mutational rate of EGFR compared with those of the aforementioned studies [12, 19–23] may be related to different ethnic backgrounds of the cohorts. EGFR mutations are rare in mucinous AIS [19, 24].
The clinical significance of diagnosing AIS lies in its connotation as a neoplasm with 100 % disease-free survival if it is resected completely [1, 17, 19–24] (Fig. 1.3) (Table 1.2). It is noteworthy that most of these data are from Japan, where EGFR mutation-related adenocarcinomas are common and CT-based examination is part of routine clinical practice. The frequency of AIS among resected lung adenocarcinomas has been 4.5–8.4 % in Japanese cohorts [19–21, 23], whereas it has been less than 1 % in Western countries [24]. The clinical behavior of mucinous AIS is less well elucidated but may also be good [15, 19, 20, 24, 25]. Thus, the most recent article on the eighth TNM classification of lung cancer has proposed the code Tis in place of T1 for AIS [15].
Fig. 1.3
Pulmonary adenocarcinoma subtypes and prognosis. Stage I (n = 514). (a) Disease-free survival (DFS) for all histological categories (P < 0.001). The favorable group includes adenocarcinoma in situ (AIS) and minimally invasive adenocarcinomas (MIA) with 100 % 5-year disease-free survival. Disease-free survival for the intermediate group was 90, 83, and 84 % for lepidic predominant, papillary (PAP) predominant and acinar predominant, and adenocarcinomas, respectively. Disease-free survival for the unfavorable group was 70, 67, 71, and 76 % for solid predominant, micropapillary (MPAP) predominant, colloid predominant, and mucinous and mixed adenocarcinomas, respectively. (b) Disease-free survival according to combined histological groupings according to low-, intermediate-, and high-grade clinical aggressiveness. (c) Overall survival (OS) according to combined histological groupings according to low-, intermediate-, and high-grade clinical aggressiveness (Adopted from Fig. 1.4 of reference [20]). (b) Stages I–III (n = 440). (A) Disease-free survival curves and (B) overall survival curves, for the groups, separated by the IASLC/ATS/ERS classification of lung adenocarcinomas (Adopted from Fig. 1.6 of reference [33]). AIS adenocarcinoma in situ, MIA minimally invasive adenocarcinoma, Lepidic lepidic predominant adenocarcinoma, Aci acinar predominant adenocarcinoma, Pap papillary predominant adenocarcinoma, Solid solid predominant adenocarcinoma, MP micropapillary predominant adenocarcinoma, IMA invasive mucinous adenocarcinoma, IASLC International Association for the Study of Lung Cancer, ATS American Thoracic Society, ERS European Respiratory Society
Table 1.2
Pulmonary adenocarcinoma subtypes and prognosis
Reporter/pattern | AIS | MIA | Lepidic | Acinar | Papillary | Micropapillary | Solid | IMA | Colloid | Others | |
|---|---|---|---|---|---|---|---|---|---|---|---|
Yoshizawa et al. (2011) [33] | |||||||||||
Stage I AC n=514 | n (%) | 1 (0.2) | 8 (1.6) | 29 (5.6) | 232 (45.1) | 143 (27.8) | 12 (2.3) | 67 (13) | 13 (2.5) | 9 (1.8) | |
5Y DFS: % | 100 | 100 | 90 | 84 | 83 | 67 | 70 | 76 | 71 | ||
Russell et al. (2011) [34] | |||||||||||
Stages I–III AC n=210 | n (%) | 1(0.5) | 7 (3) | 10 (5) | 84 (40) | 26 (12) | 14 (7) | 49 (23) | 10 (5) | 9 (4) | |
5Y OS: % | 100 | 100 | 86 | 68 | 71 | 38 | 39 | 51 | 51 | ||
Warth et al. (2012) [40] | |||||||||||
Stages I–IV AC n=500 | n (%) | 0 | 0 | 41 (8.4) | 207 (42.5) | 23 (4.7) | 33 (6.8) | 183 (37.6) | 12 (2.4) | 0 | 1/enteric |
OS: mean Mo | NA | NA | 78.5 | 67.3 | 48.9 | 44.9 | 58.1 | 88.7 | NA | NA | |
DSS: mean Mo | NA | NA | 80.3 | 79.2 | 56.3 | 50.4 | 66.7 | All survived | NA | NA | |
DFS: mean Mo | NA | NA | 72.6 | 61.7 | 37.7 | 33.8 | 51.2 | 88.1 | NA | NA | |
Yoshizawa et al. (2013) [20] | |||||||||||
Stages I–III AC n=440 | n (%) | 20 (4.5) | 33 (7.5) | 36 (8.1) | 61 (13.8) | 179 (40.7) | 19 (4.3) | 78 (17.7) | 10 (2.2) | 3 (0.7) | 1/fetal(0.2) |
5Y OS: % | 100 | 100 | 100 | 81.2 | 74.7 | 42.2 (at 3Y) | 39.1 | 88.8 | NA | NA | |
5Y DFS: % | 100 | 100 | 93.8 | 69.7 | 66.7 | 0 (at 3 Y) | 43.3 | 88.8 | NA | NA | |
Tsuta et al. (2013) [21] | |||||||||||
Stages I–IV AC n=904 | n (%) | 69 (8) | 33 (4) | 136 (15.1) | 98 (10.8) | 338 (37.4) | 61 (6.7) | 124 (13.7) | 45 (5.0) | 0 | 0 |
5Y/10Y OS: % | 98/94a | 98/94a | 93/85 | 67/47 | 74/57 | 62/47 | 58/41 | 76/63 | NA | NA | |
5Y/10Y DSS: % | 100a | 100a | |||||||||
Gu et al. (2013) [35] | n (%) | 1(0.3) | 14 (4.8) | 31 (10.6) | 112 (38.4) | 36 (12.3) | 30 (10.3) | 52 (17.8) | 10 (3.4) | 2(0.7) | 4/enteric 81.4) |
Stages I–III AC n=292 | 5Y OS: % | 100 | 100 | 91.4 | 72.2 | 71.1 | 46.6 | 57.9 | 73.1 | 73.1 | 73.1 |
5Y DFS: % | 100 | 100 | 71.9 | 54 | 56.1 | 25.7 | 45.7 | 62.5 | 62.5 | 62.5 | |
1.1.3 Minimally Invasive Adenocarcinoma (MIA) (Fig. 1.4)
MIA is another new entity incorporated into the current WHO classification. It defines the solitary adenocarcinoma (<=3 cm) with a predominantly lepidic pattern and <=5 mm invasion in greatest dimension [1]. MIA should lack lymphatic/vascular/pleural/air space invasion or spread. MIA is non-mucinous in most cases but may rarely be mucinous as well. This lesion is usually discovered incidentally as a part-solid nodule, pure GGN, or rarely as a solid nodule on CT [15].
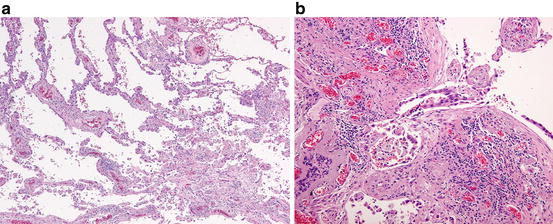
Fig. 1.4
Minimally invasive adenocarcinoma. (a) The left upper field shows the lepidic pattern of tumor growth with preserved alveolar framework, whereas the right lower field shows a fibrotic focus with an invasive growth of neoplastic cells. (b) Note an invasive neoplastic acinar structure within the fibrous stroma
Historically, the criteria for this entity were searched after the epoch-making publication of an article on AIS by Noguchi et al. in 1995 [17], and several pioneering studies contributed to its establishment [25–32]. Validation studies [19–23, 33–37] suggested the prognosis of MIA is virtually equal to that of AIS, supporting its recognition as a distinct entity (Fig. 1.3, Table 1.2). The code T1mi is proposed for MIA in the latest TNM system [15].
Histopathologically, the invasive focus may take one of the basic patterns of invasive adenocarcinoma, i.e., papillary, acinar, solid, or micropapillary pattern or tumor cells infiltrating myofibroblastic stroma [1].
1.1.4 Invasive Adenocarcinoma (Fig. 1.3) (Table 1.2)
Invasive adenocarcinoma is a carcinoma with glandular differentiation, mucin production, or pneumocyte marker expression [1]. The growth pattern includes acinar, papillary, micropapillary, and solid. These patterns often appear admixed with and in transition to one another within the same tumor, and therefore the tumor is classified according to the predominant pattern in proportion with additional description of each component present in 5–10 % increment. Invasive adenocarcinoma is typically localized in the periphery of the lung. Pleural indentation is common due to the retraction caused by central collapse and fibrosis in the tumor. CT images of invasive non-mucinous adenocarcinoma appear solid or part solid depending on the proportion of lepidic growth vs. invasive growth as well as on the extent of alveolar collapse [1, 3].
1.1.4.1 Lepidic Adenocarcinoma (Fig. 1.5)
In this tumor, the predominant pattern is lepidic with type II pneumocyte/club cell-like atypical cells growing along alveolar walls, but also present is an invasive component of various patterns such as papillary and acinar larger than 5 mm in greatest dimension. Grossly, part of the tumor, often centrally located, is grayish white in color with carbon dust deposition and solid in consistency, whereas the peripheral portion is somewhat ill defined, tan in color, and soft in consistency (Fig. 1.5). The former roughly corresponds to the invasive component with fibrosis and the latter the lepidic component with preserved airspace. This feature is usually reflected as a part solid image at CT scan. The frequency of this subtype among invasive adenocarcinomas varies from 5 % [34] to 18.3 % [23], probably reflecting different ethnic and clinical backgrounds of these cohorts.
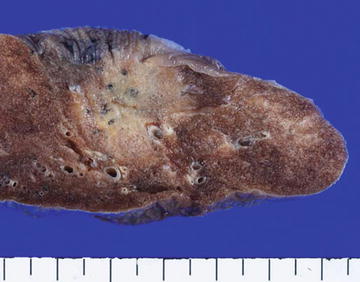
Fig. 1.5
Lepidic adenocarcinoma. Gross appearance: Note the peripheral tumor with a pleural indentation. The central portion of the tumor appears grayish white and solid, whereas the peripheral portion is tan in color with a somewhat spongy appearance and unclear margin
Genetically, EGFR mutation is frequent [20, 21, 23]. Adenocarcinoma of lepidic pattern with type II pneumocyte/ club cell-like cells (bronchioloalveolar features) has been termed terminal respiratory unit (TRU)-type adenocarcinoma and known to be intimately associated with EGFR mutation [38].
Prognostically, this tumor lies intermediate between the good prognostic group of AIS/MIA and the poor prognostic group of micropapillary adenocarcinoma/solid adenocarcinoma [20, 21, 23, 33, 35] (Fig. 1.3, Table 1.2). The prognosis of lepidic adenocarcinoma is related to the proportion of the lepidic growth within the entire tumor, tumors with >50 % to >75 % lepidic pattern showing good prognosis similar to those of AIS/MIA [24, 27]. Adenocarcinomas even with a non-predominant lepidic component show a better outcome than adenocarcinomas without the component [39]. This tendency in prognosis will be more accurately reflected in the 8th edition of the TNM classification of lung cancer in which the invasive tumor size, excluding the lepidic growth, will be used as the T descriptor size [15]. Risk factors for recurrence in lepidic adenocarcinoma may include limited resection with a close margin, lymphovascular invasion, and a substantial component of high-grade pattern such as micropapillary [24].
1.1.4.2 Acinar Adenocarcinoma (Fig. 1.6)
Acinar adenocarcinoma is composed predominantly of acinar or glandular structures with cuboidal to columnar neoplastic cells forming central lumina of various size. Of all subtypes of pulmonary adenocarcinoma, acinar adenocarcinoma is less common (10.8–20.4 %) in Japan [20, 21, 23] than in Western countries (40–45.1 %) [33, 34, 40].
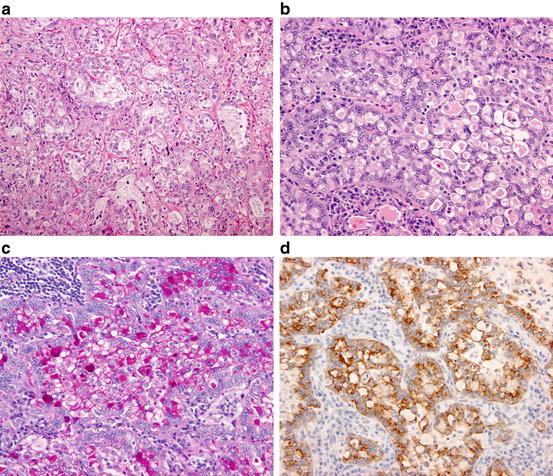
Fig. 1.6
Acinar adenocarcinoma. (a) Neoplastic cells are arranged in acinar or tubular structures. (b) ALK-rearranged adenocarcinoma. The neoplastic cells are arranged in a so-called mucinous cribriform pattern. (c) ALK-rearranged adenocarcinoma. The luminal space and cytoplasmic vacuoles of tumor cells are abundant in mucin. (PAS reaction). (d) ALK-rearranged adenocarcinoma. The neoplastic cells are diffusely positive for ALK protein (immunostaining)
Genetically, acinar adenocarcinoma shows EGFR mutation less frequently and ALK rearrangement more frequently than AIS/MIA and lepidic and papillary adenocarcinomas [20, 21, 41]. Mucinous cribriform pattern has been reported as a variant of acinar pattern intimately associated with ALK-rearranged pulmonary adenocarcinoma (Fig. 1.6) [41, 42].
Prognostically, acinar adenocarcinoma together with lepidic adenocarcinoma and papillary adenocarcinoma belongs to the intermediate group between the groups of AIS/MIA and micropapillary/solid adenocarcinoma [20, 21, 23, 33, 35] (Fig. 1.3, Table 1.2). In a study of stage I pulmonary adenocarcinomas [43], however, a cribriform pattern-predominant adenocarcinoma has been proposed as a distinct subtype of acinar adenocarcinoma with a poor prognosis compatible to those of the high-grade adenocarcinomas. This needs further validation.
1.1.4.3 Papillary Adenocarcinoma (Fig. 1.7)
Papillary adenocarcinoma shows a predominant papillary pattern with neoplastic cuboidal to columnar cells growing along fibrovascular cores in papillary configuration.
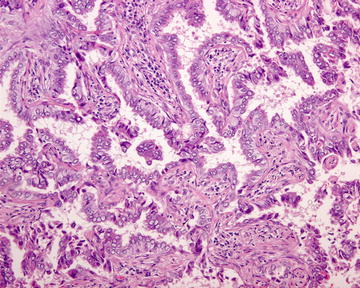
Fig. 1.7
Papillary adenocarcinoma. Neoplastic columnar cells are arranged in a papillary configuration along with the central fibrovascular cores
Genetically, papillary adenocarcinoma is among the subtypes with most frequent EGFR mutations, revealing the mutation in 50–68.5 % of cases [20, 21, 23]. This corroborates with the observation that this subtype is quite frequent (28–40.7 %) among various subtypes of adenocarcinoma in Japan [20, 21, 23], where EGFR mutation-related adenocarcinoma is prevalent, but is less common (12–27.8 %) in Western countries [33, 34, 44].
Related posts:
 Small Cell Lung Cancer and Molecular Targeted Therapy
Management of Adverse Effects by Molecular Targeted Therapy and Immunotherapy
Small Cell Lung Cancer and Molecular Targeted Therapy
Management of Adverse Effects by Molecular Targeted Therapy and Immunotherapy
 Minor-Driver Mutant
 Screening Lung Cancer with Low-Dose CT Combined with Molecular Markers
 Accurate Nodal Staging and Biomarker Testing with Endobronchial Ultrasound-Guided Transbronchial Needle Aspiration
 EGFR Mutant
Stay updated, free articles. Join our Telegram channel

Full access? Get Clinical Tree


