INTRODUCTION
Chronic lymphocytic leukemia (CLL) is a clonal hematopoietic disorder involving expansion of CD5-positive B cells. Chemoimmunotherapy (CIT) has been the standard first-line treatment for patients with CLL (1). In the last several years, major strides have been made in understanding the disease biology of CLL, and, fortunately, several of these discoveries are making their way into the clinic.
EPIDEMIOLOGY
Chronic lymphocytic leukemia is the most common leukemia in the Western Hemisphere, accounting for about 25% of all leukemias in the United States. The estimated number of new CLL cases for 2015 was 14,620, with 8,140 occurring in men and 6,480 in women. Chronic lymphocytic leukemia is uncommon in the Asian population and accounts for only 2.5% of all leukemias in Japan. The incidence is age-related, with an increase from 5.2 per 100,000 persons older than 50 years to 30.4 per 100,000 persons older than 80 years. Population studies have not identified specific occupational or environmental risk factors for developing CLL (2). The risk of CLL is not increased in Asians settled in Western countries, indicating that genetic factors play a part in CLL risk (3). Up to 15% to 20% of patients with CLL have a family member with CLL or a related lymphoproliferative disorder (4). Genome-wide association studies identified several single nucleotide polymorphisms associated with increased risk of CLL (5,6).
BIOLOGY
Chronic lymphocytic leukemia is a clonal B-cell lymphoid leukemia. Chronic lymphocytic leukemia cells morphologically resemble small mature lymphocytes arrested in an intermediate stage of the B-cell differentiation pathway. The hallmark of CLL cells is that they are monoclonal and express CD5, an antigen commonly found on T cells. CD5-positive B cells can be found in the mantle zone of lymphoid follicles, but they constitute a minor fraction of the B-cell population. CD19, CD20, and CD23 are B-cell markers expressed on CLL cells. Surface immunoglobulin, FMC7, CD22, CD11c, and CD79b are either weakly expressed or negative in CLL. Based on the antigen expression profile, CLL appears to arise from an “activated” B cell.
Normal B-cell development involves an antigen-independent phase and an antigen-dependent phase. During the antigen-independent phase, B cells undergo rearrangement of the variable (V), diversity (D), and joining (J) genes in the bone marrow. Somatic mutation of the heavy- and light-chain variable gene occurs after encounter with antigen in the germinal center. Assessment for somatic hypermutation of immunoglobulin heavy-chain variable gene (IGHV) defines two subsets of CLL. Approximately 50% of CLL cases have somatic hypermutation (>2% deviation from germline sequence) of the IGHV gene and thus appear to arise from postgerminal B cells, whereas the subset of CLL lacking IGHV gene hypermutation (≤2% deviation from germline sequence) appears to arise from naive B cells (7,8). The mutation status of CLL cells is fixed, and mutational status is not gained or lost through the course of disease. Several studies showed that unmutated IGHV is associated with worse clinical outcomes (9).
Because sequencing of the IGHV gene to identify the mutational status was labor intensive and not universally available, Damle et al first studied the correlation of IGHV mutation status with CD38 expression as a surrogate prognostic marker for IGHV mutation status (7). A significant association between CD38 expression and unmutated IGHV status was noted. Patients with ≥30% CD38 expression had a median survival of 10 years, which was significantly shorter than the median survival not reached for patients with CD38 expression <30% (P = .0001) (7). Gene expression profiling of mutated versus unmutated IGHV CLL cases showed zeta-associated protein 70 (ZAP-70) to be the most differentially expressed gene with higher expression in unmutated IGHV cases, providing another surrogate for IGHV mutation status (10). Higher expression of ZAP-70 (≥20%) was associated with worse clinical outcomes (10,11).
Using conventional chromosome banding techniques, cytogenetic abnormalities can be detected in up to 50% of CLL cases. These techniques are hampered by the low mitotic activity of CLL cells; B-cell mitogens may be used to enhance this activity. In addition, metaphases obtained for karyotyping may also arise from normal T cells in the sample, as indicated by sequential immunotyping followed by karyotypic analysis. Fluorescent in situ hybridization (FISH) performed on interphase cells using genomic DNA probes greatly enhanced the ability to detect molecular abnormalities in malignant cells. Fluorescent in situ hybridization demonstrated that molecular abnormalities occur in over 80% of CLL cases. 13q deletion is the most common genetic aberration found in CLL by FISH (55%), followed by 11q deletion (18%), 12q trisomy (16%), and 17p deletion (7%) (12). Prior to the use of FISH, trisomy 12 was the most frequently detected chromosomal abnormality in CLL by conventional cytogenetic methods (13). Structural abnormalities of 13q were often missed by Giemsa banding, presumably because of the small size of the deletion. The prognosis of CLL varies with the chromosomal abnormality. When divided into five prognostic categories—17p deletion, 11q deletion, 12q trisomy, no observed abnormalities, and 13q deletion (as sole abnormality)—the survival times were 32, 79, 114, 111, and 133 months, respectively (12). Patients with 11q deletion tend to have more prominent lymphadenopathy. Patients with 17p and 11q deletion tend to have more advanced disease and respond poorly to conventional therapy (9). Clonal evolution can occur over time and with treatment; therefore, FISH assessment should be repeated when therapeutic intervention is being considered.
Whole exome sequencing of CLL cases has identified genes that are recurrently mutated and may contribute to the pathogenesis of the disease (14,15). Recurrently mutated genes include TP53, NOTCH1, SF3B1, MYD88, XPO1, and ATM. Some of these mutations were correlated with clinical outcome (15,16). TP53 mutations are typically associated with del(17p). ATM and SF3B1 mutations are typically associated with del(11q).
CLINICAL FEATURES
At diagnosis, most patients are older than 60 years, with more than 90% being over 50 years. The diagnosis of CLL is often incidental; routine blood count may reveal an elevated absolute lymphocyte count (ALC). In symptomatic patients, fatigue and infections may be presenting features. B symptoms (fever, weight loss, night sweat) can also occur but are uncommon at initial diagnosis. Exaggerated skin reaction to insect bites (Wells syndrome) is frequent in CLL. Leptomeningeal involvement is rare. Some patients may present with autoimmune hemolytic anemia or immune thrombocytopenia. Physical examination may reveal cervical, axillary, and/or inguinal lymphadenopathy. Splenomegaly and hepatomegaly are not uncommon.
LABORATORY FEATURES
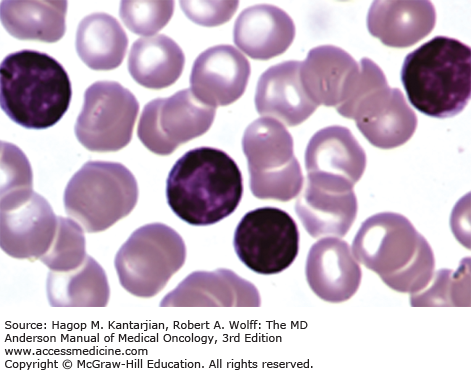
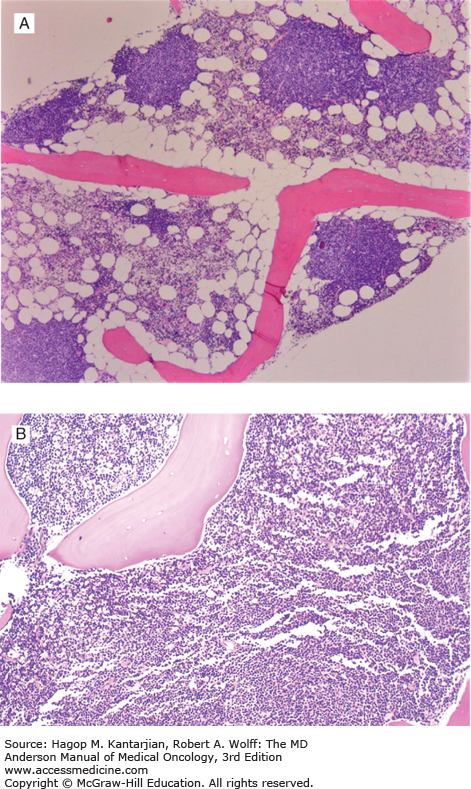
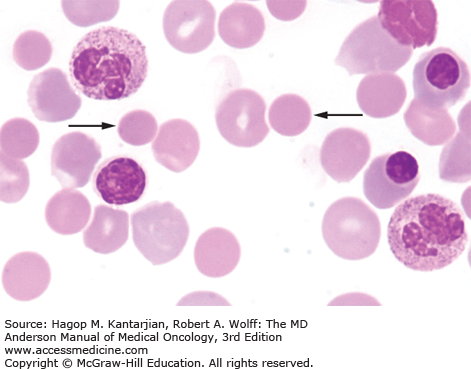
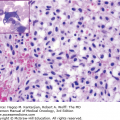
Laboratory findings invariably show lymphocytosis. The ALC can range from 5 × 10⁹/L to >500 × 109/L. Chronic lymphocytic leukemia cells resemble mature lymphocytes; they have dense chromatin as well as scant cytoplasm and lack nucleoli (Fig. 3-1). Preparation of the blood smear may damage these fragile lymphocytes and produce “smudge” cells. The bone marrow is typically hypercellular for age, and infiltration varies in terms of the percentage of marrow involved as well as in the pattern of involvement, which may be nodular, interstitial, or diffuse (Figs. 3-2A and B). Erythroid, myeloid, and megakaryocytic precursors may be normal or decreased. Anemia or thrombocytopenia may result from marrow infiltration or from immune destruction. Findings of microspherocytes in peripheral blood smear (Fig. 3-3), reticulocytosis, and demonstration of immunoglobulin (Ig) G and/or complement on red cells support the diagnosis of immune hemolytic anemia. Pure red cell aplasia has been described in 1% to 6% of cases. Patients often develop hypogammaglobulinemia, which can progress in severity with advancing disease. Monoclonal gammopathy may also develop. Other laboratory abnormalities include elevated serum β2-microglobulin (β2-M); LDH is rarely elevated.
Up to 5% of otherwise normal individuals over the age 40 may harbor a population of monoclonal CD5+/CD19+/CD23+ B cells. These individuals are asymptomatic (absence of cytopenia and lymphadenopathy/organomegaly), and when the absolute monoclonal lymphocyte count is less than 5,000/μL and there is no palpable enlarged lymph node, they are characterized as having monoclonal B lymphocytosis (MBL) (17). Individuals with MBL should be monitored. It is estimated that the rate of progression from MBL to CLL is 1% to 2% per year.
DIAGNOSIS
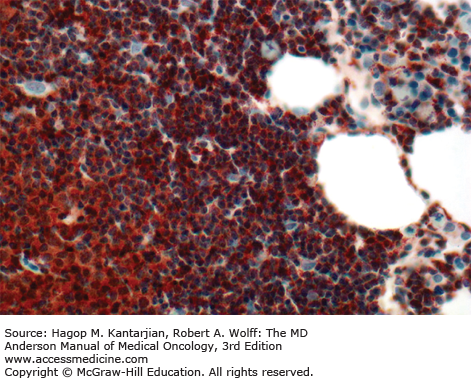
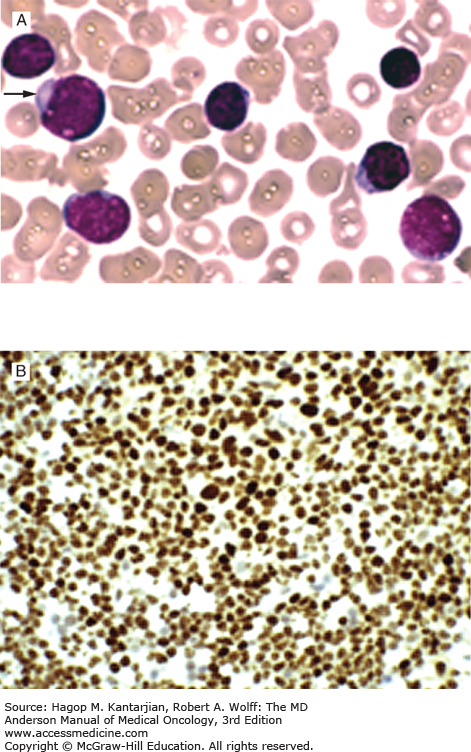
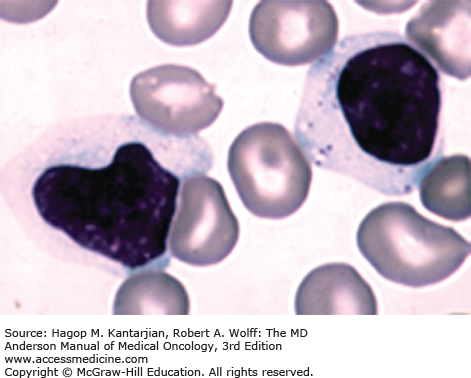
In 2008, the International Workshop on Chronic Lymphocytic Leukemia (IWCLL) updated the recommendations on diagnosis and treatment of CLL (Table 3-1) (18). The diagnosis of CLL requires at least 5 × 10⁹ clonal B lymphocytes/L in the peripheral blood, with less than 55% of the cells being atypical (prolymphocytes). A monoclonal B-cell count ≥5 × 10⁹/L was specified to distinguish CLL from small lymphocytic lymphoma in patients with palpable lymph nodes or splenomegaly. B-lymphocyte clonality should be demonstrated by using flow cytometry, which should also confirm expression of B-cell surface antigens (CD19, CD20, CD23), low-density surface immunoglobulin (M or D), and CD5. ZAP-70 (Fig. 3-4) expression in CLL cells has prognostic implication. Distinguishing CLL from mantle cell lymphoma (Figs. 3-5A and B) (see section “Differential Diagnosis”) and large granular leukemia (Fig. 3-6) is of utmost importance.
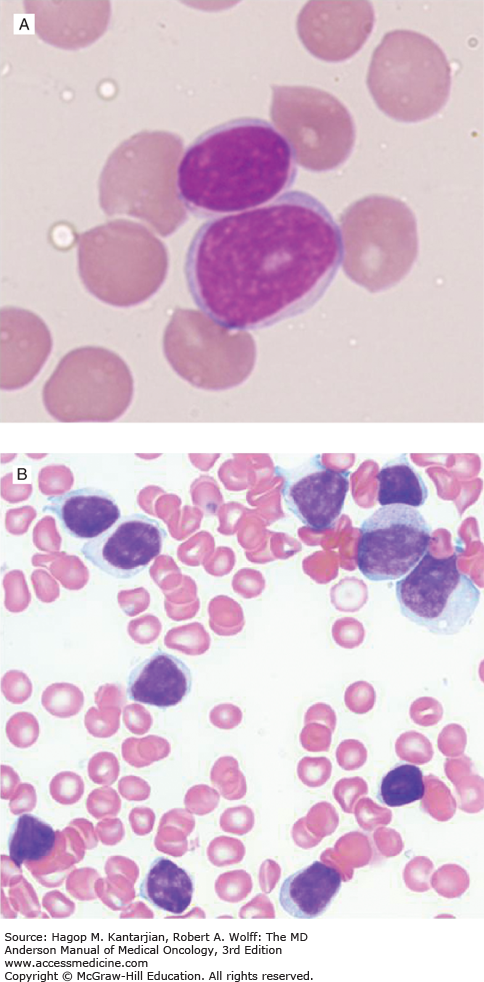
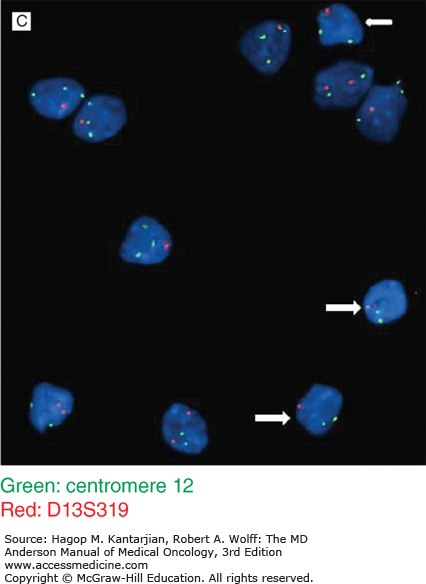
The presence of more than 55% of prolymphocytes would favor a diagnosis of prolymphocytic leukemia (PLL). Prolymphocytes (<55%) can be seen in peripheral blood or bone marrow of patients with CLL (Figs. 3-7A, B, and C).
FIGURE 3-7
A. High-power view of a prolymphocyte juxtaposed with a mature-appearing lymphocyte. Note larger size, less condensed chromatin, and prominent nucleolus in prolymphocyte. B. Bone marrow smear from a 58-year-old man with a 3-year history of untreated chronic lymphocytic leukemia (CLL). There are small lymphocytes and larger prolymphocytoid lymphocytes with abundant lightly basophilic cytoplasm, fine chromatin, and variably prominent nucleoli. C. Interphase FISH. Almost all the lymphocytes show deletion of one locus of D13S319 (white arrow) (except two lymphocytes on slide 1, left low), and a large subset of CLL cells also showed trisomy 12 (+12). Interestingly, +12 is almost only seen in prolymphocytoid lymphocytes. The small lymphocytes with clumped chromatin and scant cytoplasm usually do not show +12.
DIFFERENTIAL DIAGNOSIS
Clinical, morphologic, immunophenotypic, and cytogenetic methods help to distinguish between CLL and other diseases such as mantle cell lymphoma, follicular lymphoma, T-cell PLL (T-PLL), hairy cell leukemia (HCL), marginal zone lymphoma, and Waldenström macroglobulinemia. Table 3-2 summarizes the immunophenotypic features of these disorders. Distinguishing CLL from mantle cell lymphoma is important because both can express CD5 (see Fig. 3-5A). Unlike CLL, mantle cell lymphoma cells are typically CD23 negative, FMC-7 positive, and have strong surface immunoglobulin staining. Confirmation of mantle cell lymphoma can be made by detection of the t(11;14) translocation and/or positive nuclear cyclin D1 staining (see Fig. 3-5B).
| Disease | sIg | CD5 | CD10 | CD20 | CD22 | CD23 | CD79B | CD103 | FMC7 |
|---|---|---|---|---|---|---|---|---|---|
| CLL | Weak | ++ | − | + | −/+ | ++ | −/+ | − | −/+ |
| B-PLL | Strong | −/+ | −/+ | ++ | + | −/+ | ++ | − | ++ |
| HCL | Strong | − | − | ++ | ++ | − | + | + | ++ |
| SLVL | Strong | −/+ | − | ++ | ++ | −/+ | ++ | − | ++ |
| FL | Strong | −/+ | ++ | ++ | ++ | −/+ | ++ | − | ++ |
| MCL | Strong | ++ | − | ++ | ++ | − | ++ | − | ++ |
STAGING
Staging systems for CLL include Rai and Binet staging (Table 3-3). The original Rai classification defined five stages from 0 to IV; this has been modified to three stages by defining Rai stage 0 as low risk, stages I and II as intermediate risk, and stages III and IV as high risk, with median survival times of >12.5, 7, and 1.5 years for each risk group, respectively. Similarly for Binet stages A, B, and C, median survival times are >10, 6, and 2 years, respectively. The diagnostic workup that is undertaken in CLL patients at initial presentation at the University of Texas MD Anderson Cancer Center (MDACC) is listed in Table 3-4.
| Rai Stage | Modified Rai Stage | Description | Binet Stage | Description | Median Survival |
|---|---|---|---|---|---|
| 0 | Low risk | Lymphocytosis only | A | Hemoglobin ≥10 g/dL and platelets ≥100 × 109/L and <3 enlarged lymphoid-bearing areas | >10 years |
| 1 | Intermediate risk | Lymphocytosis and lymphadenopathy | B | Hemoglobin ≥10 g/dL and platelets ≥100 × 109/L and ≥3 enlarged lymphoid-bearing areas | 5-7 years |
| 2 | Intermediate risk | Lymphocytosis and splenomegaly and/or hepatomegaly with/without lymphadenopathy | |||
| 3 | High risk | Lymphocytosis and anemia (hemoglobin <11 g/dL) | C | Hemoglobin <10 g/dL or platelets <100 × 109/L (irrespective of number of lymphoid-bearing areas) | 2-3 years |
| 4 | High risk | Lymphocytosis and thrombocytopenia (platelets <100 × 109/L |
| History and physical (close attention to lymph node areas, liver/spleen size) |
| Constitutional symptoms (fever, chills, weight loss, night sweats) |
| Assessment of performance status |
| CBC, electrolytes, BUN, creatinine, liver function tests, LDH, quantitative immunoglobulins, β2-microglobulin |
| Examination of peripheral blood smear |
| Bone marrow aspiration and biopsy (in patients with cytopenias or those in need of treatment) |
| Immunophenotyping of peripheral blood/bone marrow lymphocytes to establish diagnosis |
Prognostic marker assessment Flow cytometry for CD38 Immunostaining/flow cytometry for ZAP-70 Interphase FISH (assessment of deletion 17p, deletion 11q, trisomy 12, deletion 13) IGHV mutation status |
Imaging studies (only if presenting with significant adenopathy or needed treatment); many clinical trials are now incorporating CT scans as per new guidelines, but these are not standard of care outside of a clinical trial. CT scan or PET scan (PET scan preferred if there is a suspicion of Richter transformation) |
PROGNOSIS
Both CLL staging systems confer significant prognostic information; however, they are limited by their inability to identify which patient with early-stage disease will develop disease progression. An analysis of the French Cooperative Group trial of Binet stage A patients demonstrated that a subgroup of these stage A patients with a hemoglobin ≥12 g/dL, a lymphocyte count <30 × 109/L, and <80% lymphocytes in the bone marrow aspirate was less likely to progress than other stage A patients (19). A lymphocyte doubling time of >12 months, Rai stage 0 disease, nondiffuse bone marrow pattern, hemoglobin ≥13 g/dL, and ALC <30 × 109/L similarly define a group of CLL with an excellent prognosis (20).
Serum factors have been identified as prognostic indicators in early-stage CLL. Patients with early-stage CLL with serum thymidine kinase (TK) levels >7.0 U/L had a significantly shorter progression-free survival (PFS) compared to those with TK levels below that level. Elevated serum β2-M level is also an adverse prognostic feature that has been shown to correlate with clinical stage and disease progression. High serum LDH levels indicate a poor prognosis.
Fluorescent in situ hybridization, IGHV gene mutation status, ZAP-70 expression, and CD38 expression are well-established prognostic factors in CLL (described in earlier sections). A prognostic model integrating cytogenetic abnormalities identified by FISH with mutated NOTCH1, SF3B1, BIRC3, and TP53 was proposed (21). The established prognostic factors in CLL indicating poorer outcome are listed in Table 3-5.
| Male gender |
| Advanced Rai or Binet staging |
| Cytogenetic abnormalities [del(17p), del(11q), complex cytogenetics] |
| Lymphocyte doubling time <12 months |
| Initial lymphocyte count >50 × 109/L |
| Elevated serum TK |
| Elevated β2-microglobulin |
| Elevated serum-soluble CD23 |
| Higher CD38 expression |
| Higher ZAP-70 expression |
| Diffuse pattern of marrow involvement |
| Unmutated IGHV gene |
| Gene mutations (TP53, BIRC3, NOTCH1, SF3B1) |
TREATMENT
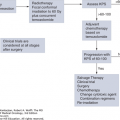
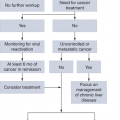
Unlike most leukemias, an unusual feature of CLL is that making the diagnosis is not necessarily an indication to initiate treatment. Early treatment of asymptomatic CLL with chemotherapy was not shown to prolong survival. In the current era of more effective CIT regimens and targeted therapies, this question will likely be investigated again. The National Cancer Institute (NCI)-IWCLL criteria for treatment of CLL are summarized in Table 3-6. The NCI-IWCLL criteria for response assessment of CLL are summarized in Table 3-7.
Active disease should be confirmed prior to initiating treatment.
|
| Parameter | Complete Remission (CR) | Partial Remission (PR) | Progressive Disease (PD) |
|---|---|---|---|
| Group A | |||
| Lymphadenopathyb | None >1.5 cm | Decrease ≥50% | Increase ≥50% |
| Hepatomegaly or splenomegalyb | Normal size | Decrease ≥50% | Increase ≥50% |
| Blood lymphocytes | <4 × 10⁹/L | Decrease ≥50% from baseline | Increase ≥50% from baseline |
| Bone marrow | Normocellular, <30% lymphocytes, no B-lymphoid nodules Hypocellular marrow defines CRi | 50% reduction in marrow infiltrate, or B-lymphoid nodules | |
| Group B | |||
| Neutrophils | >1.5 × 10⁹/L | >1.5 × 10⁹/L or 50% improvement from baseline | |
| Platelet count | >100 × 109/L | >100 × 109/L or increase ≥50% over baseline | Decrease ≥50% over baseline secondary to CLL |
| Hemoglobin | >11 g/dL | >11 g/dL or increase ≥50% over baseline | Decrease of >2 g/dL from baseline secondary to CLL |
Chemoimmunotherapy has been the standard first-line treatment for patients with CLL (1).
Alkylating agents such as chlorambucil or cyclophosphamide, either alone or in combination with corticosteroids, were the cornerstone of treatment of CLL for several decades. In 1988 to 1989, Grever et al and the MDACC group published the first results with fludarabine in patients with CLL (22,23). In the MDACC study, a 5-day schedule of fludarabine in previously treated patients with CLL produced a complete remission (CR) rate of 15% and an overall response rate (ORR) of 44%. Different fludarabine regimens including the addition of prednisone (24), a 3-day schedule of fludarabine (25), and a once-a-week schedule of fludarabine (26
Stay updated, free articles. Join our Telegram channel

Full access? Get Clinical Tree


