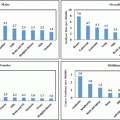
The Land and Geography: Egypt is located in the northeastern corner of Africa. Rectangular in shape, it covers an area of 386,000 mile2. To the West lie the Western Desert and Libya, and the East is bordered by a desert plateau, Red Sea, Sinai, and Israel. The Sudan is on Egypt’s southern border and to the North lies the Mediterranean. Egypt can be divided into The Eastern Desert, The Western Desert, and The Nile Valley.
The people: Population (2012 est.): 83,688,164 (growth rate: 1.92 %. Cairo, 10,902,000, Alexandria, 4,387,000; Giza, 2,597,600 and the country is divided into 26 governorates. Poverty has declined over the past few decades; however, there is disparity—poverty in Upper Egypt increased from 29 to 34 % in rural areas and from 11 to 19 % in urban areas. Although Egypt has experienced a rapid transition to lower fertility, Egypt is the second most populous country in the WHO Eastern Mediterranean Region, with 43 % of the population living in urban areas and overcrowded conditions. The Egyptians are outgoing, warm, and have a distinct sense of humor. They have respect and a liking for foreigners, and a deep sense of tolerance for other races, religions, and nationalities [3].
Language: Arabic is Egypt’s official language. However, most Egyptians understand and speak English and French. In larger towns, the foreign visitor will encounter no difficulty in communicating with the people [4].
Religion: Approximately 85 % of the populations of Egypt are Moslems. Most of the balance, about nine million, is Christian Orthodox who belongs to the Coptic Church. In most cities in Egypt, mosques and churches can be found next to each other. There are also some synagogues since a small Jewish community still lives in Egypt [4].
Economy: Egypt is classified as a lower-middle-income country; however, characteristics of high-income, middle-income, and low-income countries coexist. Poverty has declined over the past few decades; however, there is disparity—poverty in Upper Egypt increased from 29 to 34 % in rural areas and from 11 to 19 % in urban areas [4].
The structure of the Egyptian Government is a democracy in transition, having recently elected a president; with all political authority is vested in the Government in Cairo [4].
The Egyptian health system: The health care system in Egypt is quite complex with a large number of public entities involved in the management, financing, and provision of care. Egypt’s wide network of public (several ministries beside the military and police), NGO, faith-based charity organizations, and private health facilities allow good geographic accessibility and coverage. The Ministry of Health and Population is responsible for overall health and population policy as well as the provision of public health services, and is responsible for health insurance organization that provides services too. The Ministry of higher education is however responsible for health profession education (medical, nursing, dentistry, and pharmacy) and also runs university teaching hospitals. Public health expenditure is low and has pluralistic and complex financing mechanisms: tax-based financing, health insurance, and fee for service through out-of-pocket expenditures. To achieve universal coverage, Egypt is rolling out a new insurance scheme, currently being piloted in Suez Governorate, based on a “family physician model” which will separate financing from service provision. Despite Government’s efforts for universal coverage, about half of total health expenditure comes from out-of-pocket (50 %) at the point of service in public and private facilities. Egypt produces over 90 % of the pharmaceuticals it consumes. Pharmaceuticals account for just over one-third of all health spending, of which approximately 85 % is private expenditure. Publicly produced medicines are heavily subsidized, which to a considerable extent accounts for their overuse [4, 5].
The Egyptian constitution enshrines free medical care as a basic right for all citizens, and though access to primary health care is fairly widespread, this ideal has yet to be fully realized. Vaccination rates, a good indicator of the access to basic health services, are high, and Egypt has also achieved some success in controlling communicable diseases. However, access to even basic services varies widely according to gender, region of residence, and socioeconomic status [4, 5].
The organization of the Egyptian health system is fairly complex. Public health care is highly centralized within the Ministry of Health and Population (MOHP), though a number of other public entities are involved in managing and financing health care services. The most important of these are the Health Insurance Organization (HIO), which finances and provides services to almost half the population, and the Ministry of Higher Education (MOHE), which is responsible for medical education and some service delivery (i.e., in university hospitals). There is no overarching institutional oversight of all public entities involved in providing health services, limiting coordination between the various branches [4, 5].
Expenditure on health: is divided in the following manner: 36 % goes to pharmaceuticals, 19 % to services provided by the MOHP, 18 % to the private sector, 10 % to university hospitals, 8 % to services provided by the insurance system, 6 % to NGOs, and 3 % to other public institutions. Private insurance is fairly limited in Egypt, as premiums are low and companies find it hard to turn a profit. Recent reforms have de-regulated premiums, making the regulatory environment somewhat less restrictive, but still difficult to operate in [4, 5].
Magnitude of Cancer Care in Egypt
The Demographic Profile of Egypt
1.
Population trends
(a)
The population size of Egypt
Currently, Egypt is experiencing significant size, age structure changes that will have major implications for its socioeconomic development. The population size of Egypt increased from 44.9 million in 1980 to approximately 78.1 million in 2010. It is projected that in 2050, the population size of Egypt will reach approximately 121.8 million.
(b)
Population growth in Egypt
The growth rate of the population of Egypt has been decreasing since the period 1980–1985, where it stood at 2.28 %. It reached 1.56 % in the period 1995–2000 and slightly increased afterwards to 1.68 % in the period 2005–2010. The population growth rate is expected to continue declining and will reach 0.69 % in the period 2045–2050.
2.
Indicators of demographic transition
(a)
Mortality transition in Egypt
Life expectancy
Life expectancy at birth in Egypt gained 10 years from the period 1980–1985 to the period 2005–2010, increasing from 59.9 to 69.9 years. It is expected to reach 77.3 years in 2045–2050.
3.
The population structure
(a)
Egypt’s population age composition
The proportion of the population under 15 years of age has been decreasing since 1980 and is estimated to continue declining to 2050. At the same time, the proportion of the working-age population (15–64) has been increasing since 1980. It is projected to reach 66.9 % in 2040 then it will decline to 65.9 % in 2050. The proportion of the elderly population (65+) has also been increasing and is expected to reach 12.3 % in 2050.
The age distributions in Egypt vary widely with major differences in the percentage of young and old as seen in Table 9.1. Hence, currently there is less cancer, but the expected change in demographics over the next 20–30 years is likely to result in an explosive increase in noncommunicable diseases such as cancer and heart disease [6].
Table 9.1
The most frequent cancers in Egypt estimated using the results of the National Population-Based Registry Program of Egypt 2008–2011
Sex | The most frequent cancer site | % | Crude rate | ASR |
|---|---|---|---|---|
Male | Liver | 33.63 | 39.5 | 61.8 |
Bladder | 10.71 | 12.6 | 21.1 | |
Lunga | 5.69 | 6.7 | 10.4 | |
Non-Hodgkin lymphoma | 5.48 | 6.4 | 8.8 | |
Brainb | 5.48 | 6.4 | 8.8 | |
Prostate | 4.27 | 5.0 | 9.3 | |
Female | Breast | 32.04 | 35.8 | 48.8 |
Liver | 13.54 | 15.1 | 24.4 | |
Brainb | 5.18 | 5.8 | 8.0 | |
Ovary | 4.12 | 4.6 | 6.3 | |
Non-Hodgkin lymphoma | 3.80 | 4.2 | 6.1 | |
Thyroid | 3.28 | 3.7 | 4.3 | |
Both sexes | Liver | 23.81 | 27.5 | 43.6 |
Breast | 15.41 | 17.8 | 24.3 | |
Bladder | 6.94 | 8.0 | 13.5 | |
Brainb | 5.29 | 6.1 | 8.5 | |
Non-Hodgkin lymphoma | 4.64 | 5.4 | 7.5 | |
Lunga | 4.22 | 4.9 | 7.5 |
(b)
Changing age structure
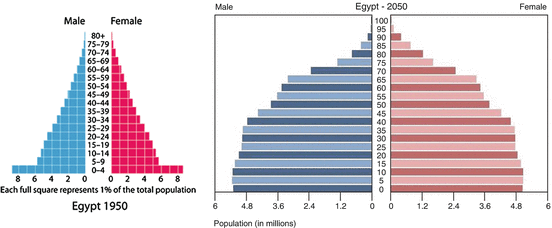
In 1950, the pyramid had a wide base signaling the structure of a young population. In 2050, the pyramid is expected to narrow down [6].

(c)
Egypt’s youth population
In 1980, youth aged 15–24 years constituted 19.4 % of the total population and 35.16 % of the working-age population. In 2005, the percentage of youth increased to reach 21.1 % of the total population then started decreasing and is projected to reach 14.5 % in 2050 [6].
(d)
Egypt’s elderly population
The percentage of the elderly population (65+) in Egypt increased from 3.0 % in 1950 to 5.5 % in 2005 and remained as such in 2010. It is projected to continue increasing to reach 12.3 % in 2050 [6].
Current Status of Cancer Care in Egypt
An Overview and Profile of Frequent Cancers in Egypt
In men, liver and bladder cancers represented approximately 44 % of cancer in males.
In females, breast cancer occupied the top ranks accounting for 32.4 % of all cancers, followed by liver that accounting 13.54 %.
In both sexes, the proportions and rates of the most frequent cancer sites by gender, there was predominance of liver, breast, and bladder cancer that represented approximately 46 % of all cancers (Table 9.1).
During the period 2013–2050, population of Egypt is expected to increase to approximately 160 % the 2013 population size (Table 9.2). Applying the current age-specific incidence rates to successive populations would lead to a progressive increase in number of incident cases from 114,985 in 2013 to 331,169 in 2050, approximately 290 % of 2013 incidence (Table 9.3). This increase reflected both population growth and demographic change mainly due to aging of population. Population growth alone would increase the number of incident cases by 55.2 % in 2015. This fraction progressively decreased to become 32.8 % in 2050. The fraction due to aging gradually increased to reach 67.2 % in 2050 (Figs. 9.1, 9.2, 9.3, and 9.4).
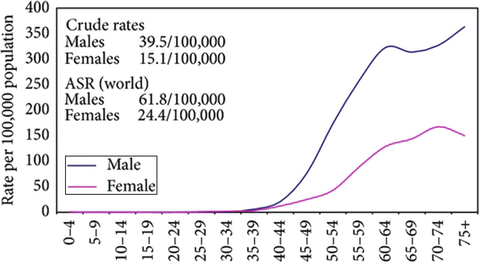
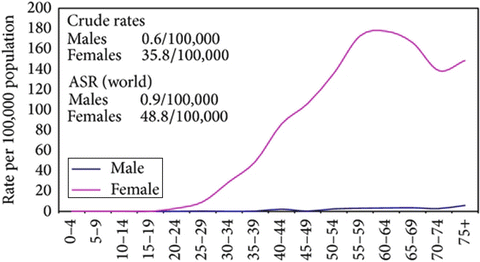
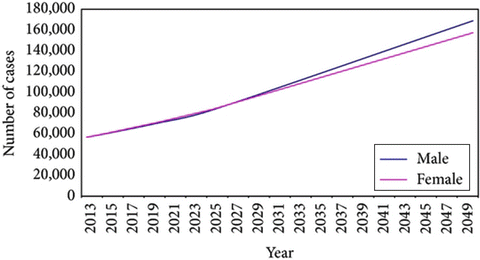
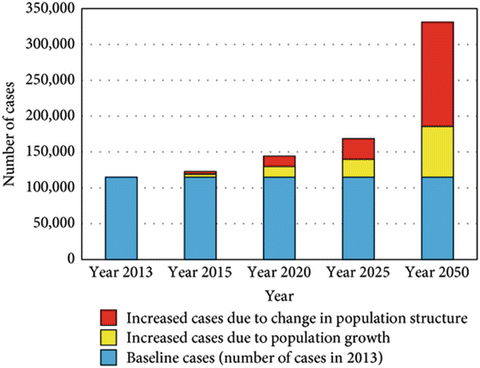
Table 9.2
Incidence rates of cancer in Egypt (/100,000 populations) classified by region and sex for all cancer sites with and without nonmelanoma skin cancer (C44)
Male | Female | All | Male:female ratio | |||||
|---|---|---|---|---|---|---|---|---|
Crude rate | ASR | Crude rate | ASR | Crude rate | ASR | Crude rate | ASR | |
(95 % CI) | (95 % CI) | (95 % CI) | (95 % CI) | (95 % CI) | (95 % CI) | |||
All sites | ||||||||
(i) Upper Egypt | 97.1 | 142.8 | 116.9 | 167.1 | 107.0 | 155.0 | 0.8:1 | 0.9:1 |
(89.1–105.8) | (133.1–153.2) | (108.1–126.5) | (156.5–178.4) | (101.0–113.3) | (147.7–162.6) | |||
(ii) Middle Egypt | 109.7 | 170.0 | 95.9 | 132.1 | 102.9 | 151.1 | 11:1 | 13:1 |
(105.4–114.1) | (164.7–175.5) | (91.1–100.2) | (127.4–137.0) | (100.0–106.0) | (147.5–154.8) | |||
(iii) Lower Egypt | 138.5 | 191.8 | 131.7 | 173.3 | 135.2 | 182.6 | 11:1 | 11:1 |
(133.2–144.0) | (185.6–198.2) | (126.5–137.2) | (167.3–179.6) | (131.4–139.1) | (178.2–187.1) | |||
(iv) Calculated rates of Egypt | 117.3 | 178.5 | 111.7 | 159.1 | 114.5 | 169.0 | 11:1 | 11:1 |
(116.0–118.6) | (176.9–180.2) | (110.4–113.0) | (157.6–160.7) | (113.6–115.5) | (167.9–170.2) | |||
All sites (excluding nonmelanoma skin cancer C44) | ||||||||
(i) Upper Egypt | 96.0 | 141.0 | 115.1 | 163.9 | 105.5 | 152.5 | 0.8:1 | 0.9:1 |
(88.1–1104.6) | (131.4–151.4) | (106.3–124.5) | (153.4–175.1) | (99.5–111.8) | (145.5–160.1) | |||
(ii) Middle Egypt | 108.0 | 167.2 | 94.9 | 130.7 | 101.6 | 149.0 | 11:1 | 13:1 |
(103.8–112.3) | (162.0–172.6) | (90.9–99.1) | (126.0–135.6) | 98.7–104.6) | (145.5–152.6) | |||
(iii) Lower Egypt | 136.7 | 189.1 | 130.1 | 170.9 | 133.5 | 180.0 | 11:1 | 11:1 |
(131.5–142.2) | (182.9–195.5) | (124.8–135.5) | (164.9–177.1) | (129.7–137.3) | (175.7–184.4) | |||
(iv) Calculated rates of Egypt | 115.7 | 175.9 | 110.3 | 157.0 | 113.1 | 166.6 | 11:1 | 11:1 |
(114.4–117.0) | (174.3–177.5) | (109.0–111.6) | (155.4–158.5) | (112.2–114.0) | (165.5–167.8) | |||
Table 9.3
Estimated cancer incidence in the period 2013–2050 and causes of increase
2013 | 2015 | 2020 | 2025 | 2050 | |
|---|---|---|---|---|---|
Estimated population | 85,294,388 (100 %) | 88,487,396 (103.7 %) | 96,260,017 (112.9 %) | 103,742,157 (121.6 %) | 137,872,522 (161.6 %) |
Number of casesa | 114,985 | 122,783 (106.8 %) | 144,255 (125.5 %) | 168,723 (146.7 %) | 331,169 (288.0 %) |
Increased cases from 2013b | 7798 (6.8 %) | 29,270 (25.5 %) | 53,738 (46.7 %) | 216,184 (188.0 %) | |
Increased cases due to population growthc | 4303 | 14,783 | 24,869 | 70,880 | |
Increased cases due to population structure changed | 3494 | 14,487 | 28,869 | 145,304 | |
% increase due to population growthe | 55.20 % | 50.50 % | 46.28 % | 32.79 % |

Fig. 9.1
Calculated age-specific incidence rates for liver cancer in Egypt 2008–2011

Fig. 9.2
Calculated age-specific incidence rates for breast cancer in Egypt 2008–2011

Fig. 9.3
Estimated number of cases in Egypt (2013–2050)

Fig. 9.4
Estimated number of cases in Egypt (2013–2050) and causes of the increase in cases
Cancer Care Facilities in Egypt
Egypt has more facilities for cancer treatment than any other country in Africa; however, many elements of cancer control strategy still need to be implemented or improved [7]. Cancer treatment facilities, in fact, include the biggest and more specialized center. In the Middle East is the National Cancer Institute (NCI) which is affiliated to Cairo University. NCI is carrying research, education, and clinical responsibilities and is considered the main reference in Egypt regarding cancer. Also, South Egypt Cancer Institute, Assiut University, Assiut, Egypt, 14 clinical oncology departments in the other public universities; ten cancer centers affiliated to the Ministry of Health in 12 governorates; 11 military cancer units that treat both civilian and military patients; oncology clinics at the hospitals run by the Egyptian Health Insurance Organization in most major cities; semi-private, NGO-operated cancer facilities; a charity-run Centre of Excellence of Pediatric Oncology in Cairo; and private-sector clinics and centers. In addition to surgery, most of these facilities have chemotherapy and radiotherapy capabilities (either linear accelerators or cobalt-60 units). Most centers have CT scanners and MRI machines, and the country has five PET-CT scanners [8].
According to the WHO survey, Egypt had an operational policy, strategy, or action plan for cancer in 2010. However, no structured national cancer control program as recommended by WHO is in place. Practical measures are needed for the optimum allocation of available resources to reduce the numbers of cancer cases and deaths and to improve quality of life for patients with cancer, through adoption of WHO recommendations [9].
Approaches to Cancer Control
Prevention and Early Detection of Cancer
Although screening by mammography has been accepted as the gold-standard to ensure early detection of BC, its cost–benefit ratio is still debated in the scientific community. It is important to keep in mind that even in the best screening settings, most deaths from breast cancer are not currently prevented by mammography screening. The latest reviews indicate a reduction of no more than 15 % in BC mortality rate after introduction of mammography screening in western countries. Recent studies suggest that screening by CBE could achieve a reduction of 52–88 % of this magnitude with a better cost-effectiveness ratio.
Whatever screening tool is used, screening programs are resource-demanding and heavy-to-implement health interventions. Downstaging programs are an appealing alternative when resources are scarce, and should be considered as the first option in regions where a majority of BC is diagnosed at late stage.
Stay updated, free articles. Join our Telegram channel

Full access? Get Clinical Tree


