Fig. 14.1
Right lateral and top views of the dynamic sequence of gray matter maturation over the cortical surface. The side bar shows a color representation in units of gray matter volume [1]
The impact of these factors on brain tumor development is currently poorly understood. The evidence from age-incidence data and epidemiological studies concerned with oncogenesis need to be integrated with science of the AYA brain development for their full interpretation. Brain tumors are the second most common group of cancers in childhood yet fall in the ranking during adolescence, suggesting that the brain’s state of development that promoted tumor formation in childhood is reducing at this stage in life (Fig. 14.2) [2].
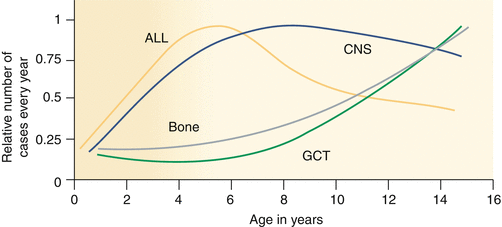

Fig. 14.2
Tumor incidence by age. Age incidence of cancers arising in developing tissues, as registered by the International Childhood Cancer Registries (represented on the y-axis as the actual number of cases, relative to the maximum set a 1, registered internationally per year) (Data are derived from the International Incidence of Childhood Cancer, Volume II [3]). ALL acute lymphoblastic leukemia (y-axis maximum incidence approximately 600) per year, CNS central nervous system tumors excluding germ cell tumors (y-axis maximum incidence approximately 1,400) per year, GCT-CNS germ cell tumors of the CNS (y-axis maximum incidence approximately 100 per year). Note that the incidence profile of GCT is more completely shown in Fig. 14.16
Brain tumors are highly complex involving over 100 different histological types with a rapidly growing evidence base of informative biological differences, which are becoming increasingly discriminant in the identification of tumor types and selection of treatments for trial to improve outcome. For these reasons, brain tumors are the most complex to manage, investigate, and deliver transformative clinical practice in this age group [3].
This chapter describes the models of care applicable to AYA practice in neuro-oncology, age incidence of different tumor types, and recent molecular observations that offer biological explanations that may help select targeted therapies [4]. Epidemiological research into environmental causes describes the growing range of predisposing conditions and the associated tumor types. Outlined are applications of neurosurgical techniques, radiotherapy, and chemotherapy to tumor therapies and their limitations. Also described is evidence for a new consensus on clinical practice emerging from trials over the past two decades, concerning intracranial germ cell tumors. This malignant tumor is primarily associated with the AYA age range. The long-term consequences for brain tumor survivors in adult life are highlighted. The chapter concludes with a summary of research priorities that have recently been developed by a public, professional consensus process in the UK.
14.2 Incidence, Pathology, and Etiology of CNS Tumors in AYAs
According to the United States National Cancer Institute Surveillance, Epidemiology, and End Results Program (SEER), the incidence of CNS tumors in the 15- to 39-year-old age group is ranked fifth compared to other tumor types (Table 14.1) and accounts for 6 % of all neoplasms [5]. AYAs with CNS tumors have a better overall life expectancy than children and older adults, in part because 50 % are benign tumors, many with low risk of malignant transformation in adolescence and adulthood. Age and disease-specific comparisons are rare however, and the poor track record for recruiting AYAs to cancer trials [6] suggests that this favorable comparison of survival requires careful application on a case by case basis. Developing new treatments in the AYA age group requires trials developed with eligibility criteria that embrace the full age range applicable to the disease process. The legal barrier of 18 is in general not biologically relevant to any tumor type yet is a frequent barrier to developing better scientific evidence to justify progress by excluding those, for research governance reasons, for whom the trial is not applicable.
Table 14.1
Five most frequent cancers in AYAs 15–39 years of age, United States SEER18, 2000–2012
Neoplasm (ICD-O-3, AYA recode) | Number of casesc | Incidence per 100,000d | |
|---|---|---|---|
All | Invasive | ||
Carcinoma of the breast | 36,664 | 10.24 | 10.24 |
Thyroid carcinoma | 32,364 | 8.63 | 8.63 |
Melanoma | 27,330 | 7.31 | 7.31 |
Germ cell tumorsa | 22,724 | 5.9 | 5.88 |
CNS tumorsb | 18,536 | 4.92 | 2.87 |
14.2.1 Incidence of CNS Tumors in AYAs
Incidence data for CNS tumors in AYAs are difficult to compare across population studies due to differences in the age group definitions and the way that registries have applied them. Furthermore historically many registries had inconsistent criteria for brain tumor registration frequently excluding benign or premalignant tumor types. In the AYA age range, international comparison identifies a range of incidence per 100,000 populations, determined by inconsistencies of this type. In the United States, population-based incidence data by histological subgroup is available from two large US databases, namely, the SEER Program and the Central Brain Tumor Registry of the United States (CBTRUS) the latter of which published a report on primary brain and other CNS tumors in AYAs in the United States [7]. Historically SEER data included primarily malignant CNS tumors and grouped CNS tumors into five somewhat broad categories (astrocytoma, other gliomas, medulloblastoma/primitive neuroectodermal tumors (PNETs), ependymoma, and miscellaneous CNS tumors), with CNS lymphoma and germ cell tumors registered lymphomas as (all sites) and germ cell tumors with gonadal tumors, disregarding their primary brain site. In 2004, SEER began to include benign CNS tumors in its database and use a more detailed histological classification of both benign and malignant tumor using 5-year age groups.
14.2.2 Invasive Versus Benign and Sex Age-Incidence Patterns
SEER data for 2008–2012 shows that benign CNS tumors had an incidence that steadily increased with age, whereas malignant CNS tumors were least common in young AYAs with an incidence nadir at age 20 (Fig. 14.3). Among AYAs, the proportion of all CNS tumors that were “nonmalignant” increased steadily with age accounting for 54 % of the brain tumors at age 15 and 74 % by age 40 (Fig. 14.3). In females, the increase was more dramatic than in males, increasing to 84 % by age 39 (Fig. 14.4, right panel). The high proportion of “nonmalignant” CNS tumors in older AYAs creates a greater neuropathologic challenge to evaluate the virulence of CNS tumors in this age group and manage the patients accordingly [7].
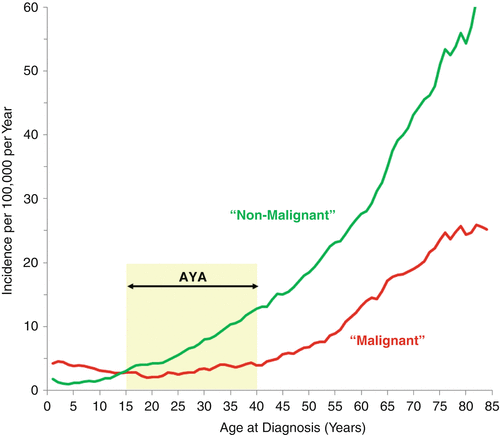
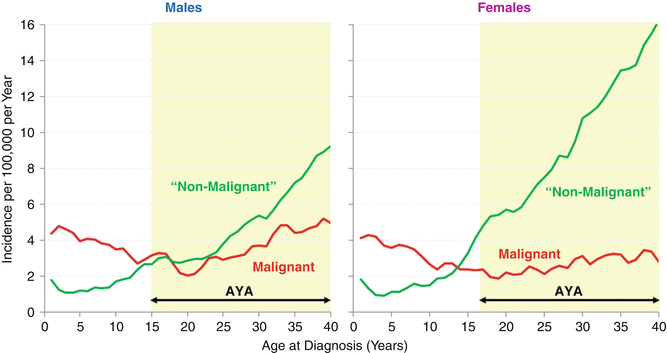

Fig. 14.3
Incidence of malignant and nonmalignant CNS tumors, United States SEER18, 2008–2012, by single year of age at diagnosis [5]. Regressions are 2-year moving averages

Fig. 14.4
Incidence of malignant and nonmalignant CNS tumors, United States SEER18, 2008–2012, by single year of age at diagnosis up to the age of 39 and sex [5]. Regressions are 2-year moving averages
14.2.3 Histology and Anatomical Region Age-Incidence Patterns
In AYAs, neuroepithelial and sellar region tumors predominate, followed by tumors of the cranial nerves (Fig. 14.5). Tumors of the meninges were the most age-dependent histological type, increasing nearly exponentially as a function of age starting at age 15 years. Astrocytoma accounted for 64 % of malignant CNS neoplasms in the 15–29-year age group, whereas “other gliomas” accounted for 19 %, primitive neuroectodermal tumor (PNET) 8 %, ependymoma 6 %, and miscellaneous CNS tumors 3 %.
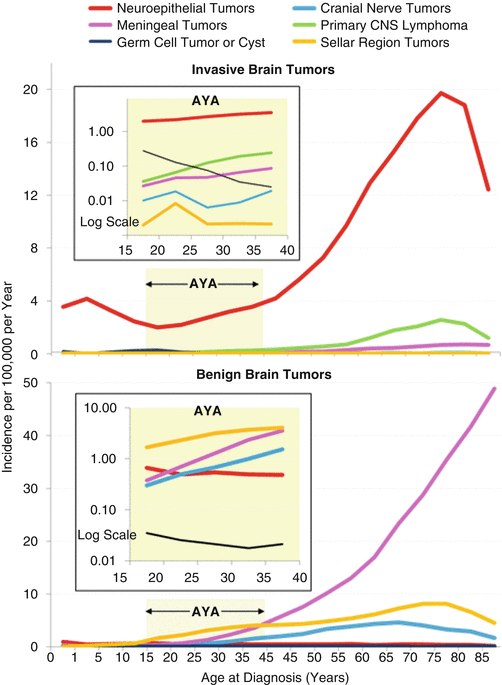

Fig. 14.5
Incidence of invasive (upper panel) and benign (lower panel) CNS tumors, 2004–2011, United States SEER18, by histological type, anatomical region, and age [5]. The insets depict the AYA age range and have log scales for the y-axis
These registries studying overlapping populations from a single large nation permit the impact of adolescent age groups on the types of tumors arising during the final stages of brain growth and development into early adult life. The nature of the changing incidence patterns highlights the vulnerability of different tissue types to generate benign, premalignant (grade 2), and malignant (grades 3 and 4) tumors. The comparison with childhood CNS tumor distribution where grade 1 astrocytomas predominate premalignant tumors (grade 2) and the different spectra of malignant tumors featuring medulloblastoma, ependymoma, diffuse intrinsic pontine glioma, and rare entities such as atypical teratoid rhabdoid tumors (ATRT), high-grade glioma, and supratentorial PNET/embryonal tumor with abundant neuropil and true rosettes (ETANTR) entities are rare, most of which are extremely rare after puberty. An additional contrast with AYA incidence is the older age primary brain tumors which are dominated by glioblastoma and meningioma. Finally, metastatic brain tumors are exceptionally rare in childhood, but as the epithelial cancer incidence rises in adolescence and early adulthood, the risk of secondary brain tumor rises in parallel and becomes a significant part of adult neuro-oncology practice, particularly in older age groups. With increasing life expectancy of AYAs with early-onset carcinomas, prevention or management of secondary brain metastases will become an increasing focus for neuro-oncology practice in this age group.
Four patterns of tumor incidence can be recognized from these databases: peak incidence in the 15–19-year age group (sellar region tumors and germ cell tumors and cysts), decreasing incidence with age (PNET and pilocytic astrocytoma), rising incidence with age (grades 2–4 astrocytoma and meningioma), and varying incidence with age (ependymoma and craniopharyngioma). These population observations are interpreted further scientifically, by recent work identifying specific molecular drivers identified in newly recognized subclasses of medulloblastoma. Looking in more detail at these groups and further characterizing the molecular subgroups permit more subtle relationships between age, tumor subtypes, and anatomical origins to be identified, building upon the developmental hypothesis proposed linked to age-incidence curves in Fig. 14.6; it can be envisaged that this new information will become central to diagnostic assessment and strongly influence trials of novel therapies in the future [9] (Fig. 14.7).
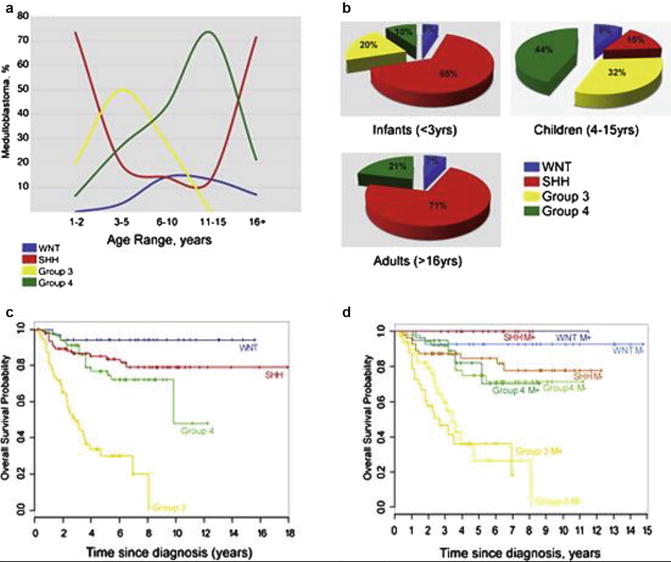
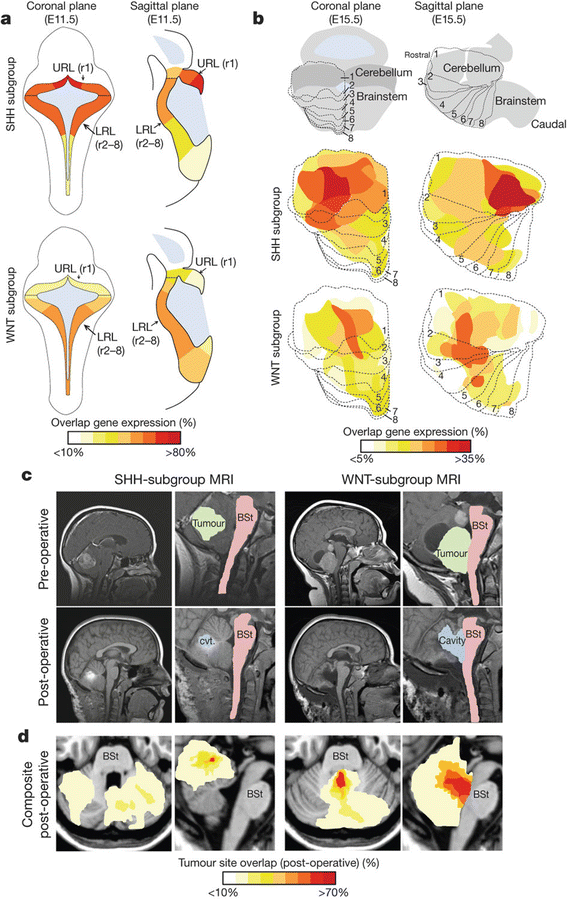

Fig. 14.6
The age distribution and outcome in medulloblastoma. (a) Age at diagnosis by medulloblastoma subgroup. (b) Frequency of subtypes in <3-year-olds, 3- to 16-year-olds, and adults (age >16 years). (c) Kaplan–Meier analysis of overall survival (OS) of combined tissue microarray cohorts from both DKFZ/Heidelburg and Johns Hopkins University (N = 287) separated by subgroup. (d) Kaplan–Meier analysis of metastasis status of sites in panel (c) (Adapted/reprinted with permission of the American Society of Clinical Oncology. All rights reserved [8])

Fig. 14.7
WNT and Sonic Hedgehog (SHH) subtypes of medulloblastoma are anatomically distinct. (a) Expression distribution in (a) E11.5 and (b) E15.5 mouse hindbrain of orthologs that distinguish human WNT- and SHH-subtype medulloblastoma. Cartoons in (b) denote the position of rhombomeres relative to the cerebellum and brain stem. (c) Top = pre- and bottom = postoperative MRI scans of exemplary SHH- and WNT-subtype medulloblastomas. Right panels show closeup views of the left. Brain stem (BSt), postoperative tumor cavity (cvt.). (d) Frequency and site of postoperative surgical cavities of SHH (n = 6)- and WNT (n = 6)-subtype medulloblastomas. Axial (left) and sagittal (right) views are shown [9]
The peak incidence of GCTs, with a male preponderance that is also seen in extracranial GCTs, is considered to be a consequence of pubertal development and the tumor growth promoting consequences of the associated surge in sex hormones. For this reason, intracranial GCTs are a “model” CNS tumor for an AYA neuro-oncology service, despite its relative rarity. The history of translational research is described in detail later in the chapter.
14.2.4 Race/Ethnicity Incidence Patterns
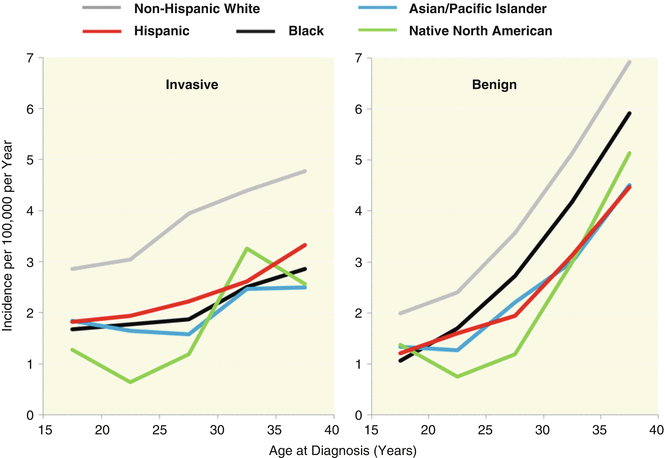
Figure 14.8 shows the racial/ethnic incidence in the United States of invasive tumors (left panel) and benign tumors (right panel) in AYAs as a function of age. At all ages, non-Hispanic whites had the highest incidence of malignant brain tumors. In AYAs, non-Hispanic whites had 1.8×, 1.9×, 2.1× and 1.6× greater incidence of malignant brain tumors than in blacks, Asians/Pacific Islanders, native North Americans, and Hispanics, respectively.
14.2.5 Incidence Trends
The incidence of invasive (malignant) brain tumors in AYAs has increased since 1976, as it did in younger or older persons and at approximately the same rate (Fig. 14.9). Incidence trends for benign tumors are difficult to assess since they have only recently been included in cancer registry statistics. Explanations for this include enhanced registration and awareness and wider application and access to brain scanning techniques with enhanced sensitivity over this time period.
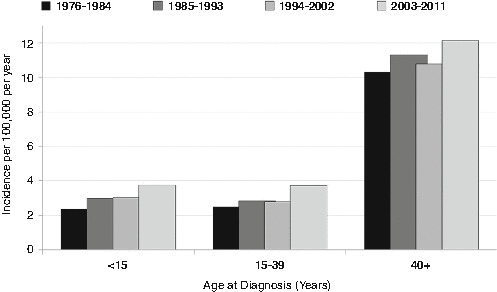

Fig. 14.9
Change in incidence of invasive CNS tumors by 9-calendar-year intervals, 1976-2011, United States SEER9, by age [5]
14.2.6 Environmental and Exogenous Risk Factor
With the processes of brain growth and development as a backdrop, genetic and environmental factors are the most commonly considered potential causes of brain tumors and have been the focus of much research, as the causes of most brain tumors cannot be attributed to rare predisposition syndromes or high doses of ionizing radiation, and so remain elusive. There have been no analytical epidemiological studies of CNS tumors specifically among adolescents and young adults. The diversity of tumor subtypes and the fact that most brain tumors occur in older adults mean that even the best substantiated risk factors do not necessarily apply to tumors occurring in the AYA age range (Table 14.2).
Table 14.2
Established and suspected environmental and exogenous risk factors for brain tumors
Elevated risk | |||
|---|---|---|---|
Risk factor | Tumor types | Details | Comment |
Ionizing radiation – therapeutic | Glioma, embryonal tumors, and meningioma | Glioma/PNET tend to have shorter latency than meningioma | |
Ionizing radiation – childhood CT scans | Brain/CNS cancers | UK retrospective cohort study: Excess Relative Risk (ERR) per mGy = 0.023 (95 % CI 0.010, 0.049) [12] Australian record-linkage study: after brain scan, ERR = 2.44 (95 % CI 2.12, 2.81); after non-brain scan, ERR = 1.51 (95 % CI 1.19, 1.91) [13] German cohort study: SIR = 1.35 (95 % CI 0.54, 2.78) [14] French cohort study: ERR per mGy was 0.022 (95 % CI -0.016, 0.061) when excluding tumors diagnosed <2 years after scan and not adjusting for predisposing factors, but zero when excluding tumors diagnosed <3 years after scan and adjusting for predisposing factors [15] Institutional cohort study of 104 children who underwent shunt placement: no tumors detected after ≥10 years follow-up [12] | UK and Australian studies probably made inadequate allowance for scans being indicated by symptoms of undiagnosed tumor [16]. German cohort study result based on only seven cases. French study shows importance of adjusting for predisposing factors |
Ionizing radiation – natural background | Childhood brain/CNS tumors | Statistical power of even the largest studies is low [20] | |
Adult brain tumors | Danish cohort study of older adults: adjusted IRR per 1,000 Bq/m3-year increase in cumulated residential radon = 1.37 (95 % CI 1.03, 1.82) [22] | Subjects were aged 50–64 at enrolment and followed up for 12–16 years | |
Dietary N-nitroso compounds | Childhood brain tumors | Dietary information apparently not validated | |
Adult glioma | Most studies failed to adjust for total energy intake | ||
Pesticides | Childhood brain tumors | Meta-analysis of five studies of indoor pesticide exposure: nonsignificant RR = 1.11 (95 % CI 0.87, 1.42) [26] Meta-analyses of 16 case-control studies and five cohort studies of parental occupational exposure: RR = 1.30 (95 % CI 1.11, 1.53) and RR = 1.53 (95 % CI 1.20, 1.95), respectively [27]. In case-control studies, RR = 1.39 (95 % CI 1.10, 1.75) for maternal exposure (six studies), RR = 1.19 (95 % CI 1.03, 1.38) for paternal exposure (13 studies), RR = 1.44 (95 % CI 1.05, 1.98) for astrocytoma (five studies), and nonsignificant RR = 1.18 (95 % CI 0.81, 1.71) for embryonal tumors (four studies) | No breakdown by tumor type Upper age limit for diagnosis was 20 years in several studies and 25 years in one study. Impact of other occupational factors was unknown |
Other parental occupational exposures | Childhood brain tumors | Pooled analysis of three case-control studies. For paternal exposure around time of conception, nonsignificant OR = 1.22 (95 % CI 0.98, 1.52) for polycyclic aromatic hydrocarbons, OR = 1.12 (95 % CI 0.95, 1.32) for asbestos, and OR = 1.18 (95 % CI 0.96, 1.46) for metals [28] | Lower OR for exposure around time of diagnosis. No association with exposure to diesel exhaust or crystalline silica. No association for any maternal exposure |
Methotrexate | Meningioma | UK case-control study of childhood cancer survivors: unadjusted RR = 6.4 (95 % CI 1.7, 23.5) for intrathecal dose ≥70 mg/m2 and RR = 35.6 (95 % CI 4.8, 599) adjusted for radiation exposure [11] | Lower RR for lower doses. No other published study of this risk factor |
Human immunodeficiency virus (HIV)/acquired immunodeficiency syndrome (AIDS) | Lymphoma | Primary NHL of the brain is an AIDS-defining illness in about 0.5 % of people with AIDS [29]. Risk among HIV-seropositive people decreased substantially with the introduction of highly active antiretroviral therapy; adjusted incidence among nearly 48,000 HIV-positive people from North America, Europe, and Australia fell significantly from 1.7 per 1,000 person-years during 1992–1996 to 0.7 per 1,000 during 1997–1999 [30] | |
Birth weight and fetal growth rate | Childhood CNS tumors | The UK and US case-control studies: OR per 0.5 kg increase in birth weight for all tumors in ICCC-3 group III was 1.07 (95 % CI 1.04, 1.10) in the UK and 1.05 (95 % CI 1.01, 1.08) in the Unites States [31] | Similar results for astrocytoma and embryonal tumors. Similar but nonsignificant OR for ependymoma/choroid plexus tumors Inconsistent results between the UK and United States for germ cell tumors No evidence of effect for other astrocytoma, medulloblastoma, or ependymoma |
Swedish national cohort study: IRR per 1 SD increase in fetal growth rate was 1.04 (95 % CI 1.01, 1.08) overall and 1.05 (95 % CI 1.00, 1.12) for pilocytic astrocytoma [32] | |||
Adult stature | Adult glioma | Meta-analysis of 15 studies: RR = 1.70 (95 % CI 1.11, 2.61) for ≥190 cm vs. 170–174 cm in males, nonsignificant RR = 1.06 (95 % CI 0.70, 1.62) for ≥175 cm vs. 160–164 cm in females [33] | Association slightly stronger when restricted to glioblastoma. No obvious reason why effect should vary by sex |
High BMI | Adult glioma | ||
Meningioma | |||
Reduced risk | |||
Prenatal vitamin and folic acid supplements | Childhood brain tumors | Numerous studies have found protective relationship [36] | Some inconsistency between studies regarding effects of specific supplements and by tumor type |
History of allergic/atopic conditions | Adult glioma | Meta-analysis of eight studies: allergy, OR = 0.61 (95 % CI 0.55, 0.67); asthma, OR = 0.68 (95 % CI 0.58, 0.80); eczema, OR = 0.69 (95 % CI 0.58, 0.82) [37] Meta-analysis of 11 studies: allergy, OR = 0.60 (95 % CI 0.52, 0.69); asthma, OR = 0.70 (95 % CI 0.62, 0.79); eczema, OR = 0.69 (95 % CI 0.62, 0.78); hay fever, OR = 0.78 (95 % CI 0.70, 0.87) [38] Pooled analysis of 3 studies for any atopic condition by ethnicity: OR = 0.47 (95 % CI 0.41, 0.55) in whites; OR = 0.32 (95 % CI 0.14, 0.75) in Asians; nonsignificant OR = 0.96 (95 % CI 0.50, 1.84) in blacks, and OR = 0.81 (95 % CI 0.42, 1.57) in Hispanics [39] | Similar results when restricted to glioblastoma |
Oligodendroglioma (including anaplastic oligodendroglioma) | Pooled analysis of seven studies: asthma and/or allergies, OR = 0.7 (95 % CI 0.6, 1.0); asthma, OR = 0.4 (95 % CI 0.2, 0.7) [40] | Effect for asthma and/or allergies limited to anaplastic oligodendroglioma. Nonsignificant reduced OR for eczema in both tumor subtypes | |
Meningioma | Meta-analysis of seven studies: eczema, OR = 0.75 (95 % CI 0.65, 0.87); nonsignificant for asthma, OR = 0.88 (95 % CI 0.75, 1.04); and hay fever, OR = 0.90 (95 % CI 0.79, 1.03) [41] Case-control study in four regions of the United States: allergy, OR = 0.6 (95 % CI 0.5, 0.7); asthma, OR = 0.7 (95 % CI 0.5, 0.9) [42] INTERPHONE study from five countries: allergy, OR = 0.77 (95 % CI 0.63, 0.93); nonsignificant for asthma, OR = 0.78 (95 % CI 0.59, 1.03) [43] | ||
High level of physical activity | Adult glioma | Meta-analysis of five studies: RR = 0.86 (95 % CI 0.76, 0.97) vs. low physical activity [35] | |
Meningioma | Meta-analysis of four studies: RR = 0.73 (95 % CI 0.61, 0.88) vs. low physical activity [35] | ||
History of diabetes | Adult glioma | Pooled analysis of seven studies: OR = 0.58 (95 % CI 0.40, 0.84) [44] Meta-analysis of the above plus 10 other studies: OR = 0.79 (95 % CI 0.67, 0.93) [45] | Association similar for males and females and after restricting to glioblastoma Association appeared to be confined to males and to people of Caucasian race |
Female reproductive hormones | Adult glioma | Meta-analysis of 11 studies: age at menarche, RR = 1.40 (95 % CI 1.05, 1.87) for oldest vs. youngest; the use of oral contraceptives, RR = 0.71 (95 % CI 0.60, 0.83) [46] Pooled analysis of three studies: age at menarche, OR = 2.00 (95 % CI 1.47, 2.71) for >15 vs. <12; the use of oral contraceptives, OR = 0.61 (95 % CI 0.50, 0.74) and P trend <0.0001 for duration of use [47] | Results for premenopausal and postmenopausal women combined; no analysis of either factor by menopausal status. No analysis of duration of oral contraceptive use Results for premenopausal and postmenopausal women are combined. Data for premenopausal women are not presented separately, but premenopausal status is not associated with glioma risk |
Little or no evidence of elevated or reduced risk or conflicting evidence | |||
Nonionizing radiation | Childhood brain tumors | Meta-analysis of 13 studies of residential magnetic field exposure: nonsignificant summary OR = 1.68 (95 % CI 0.83, 3.43) for measured or calculated exposures above 0.3 or 0.4 μT; OR for lower exposures were lower and nonsignificant [48] Pooled analysis of ten studies of exposure to extremely low-frequency magnetic fields: no significant results and no evidence of dose–response [49] CEFALO study of mobile phone use by children and adolescents in four countries: nonsignificant OR = 1.36 (95 % CI 0.92, 2.02) for regular vs. never regular use, OR = 1.26 (95 % CI 0.70, 2.28) for use over ≥5 years vs. never regular use [50] | Moderate risk increase in the highest exposure category could not be excluded, but no evidence of increased risk for lower exposures The absence of exposure–response argues against causal association |
Adult brain tumors | Meta-analysis of 47 studies of occupational exposure to electromagnetic fields (EMF): RR = 1.14 (95 % CI 1.07, 1.22) [51] | Studies showed considerable heterogeneity, many studies involved small numbers of cases, and there was little evidence of dose–response | |
Adult glioma | Meta-analysis of 22 studies of occupational EMF exposure: RR = 1.18 (95 % CI 1.10, 1.26) [51] INTEROCC study of occupational ELF exposure in seven countries: no association with cumulative exposure, average exposure, and maximum exposed job or duration of exposure and no evidence of dose–response; OR = 1.67 (95 % CI 1.36, 2.07) for ≥90th percentile vs. <25th percentile cumulative ELF 1–4 years pre-diagnosis with Plinear trend <0.0001 [52] Meta-analysis of 17 studies of mobile phone use: nonsignificant OR = 0.99 (95 % CI 0.84, 1.17) forever vs. never regular use, OR = 1.26 (95 % CI 0.86, 1.84) for long-term vs. never regular use [53] | As above. Results of more recent studies of glioma have been mixed [54]. Weaker association for 5–9 years pre-diagnosis, and inverse association (Plinear trend = 0.04) for ≥10 years pre-diagnosis Significant heterogeneity between studies (P = 0.001) | |
Meningioma | INTEROCC study of occupational ELF exposure in seven countries: no association with cumulative exposure, average exposure, or maximum exposed job; OR = 1.30 (95 % CI 1.03, 1.64) for ≥25 years vs. <5 years exposure; Plinear trend = 0.02 for cumulative ELF 1–4 years pre-diagnosis [52] Meta-analysis of 15 studies of mobile phone use: nonsignificant OR = 0.91 (95 % CI 0.78, 1.05) forever vs. never regular use, OR = 1.02 (95 % CI 0.74, 1.40) for long-term vs. never regular use [53] | ||
Smoking | Childhood brain tumors | Meta-analysis of 17 studies: nonsignificant RR = 0.93 (95 % CI 0.85, 1.00) for maternal smoking before pregnancy, RR = 1.09 (95 % CI 1.00, 1.20) for paternal smoking before pregnancy, RR = 0.96 (95 % CI 0.86, 1.07) for maternal smoking during pregnancy, and RR = 1.09 (95 % CI 0.97, 1.22) for paternal smoking during pregnancy [55] | Similar results for astrocytoma, ependymoma, and embryonal tumors |
Adult glioma | Meta-analysis of 17 studies: nonsignificant RR = 1.06 (95 % CI 0.97, 1.15) forever vs. never smoking [56] | Little evidence of any dose–response | |
Meningioma | Meta-analysis of 9 studies: nonsignificant RR = 0.95 (95 % CI 0.87, 1.05) forever vs. never smoking [57] | RR = 1.49 (95 % CI 1.06, 2.09) among men and RR = 0.86 (95 % CI 0.65, 1.13) among women, but no obvious reason why risk should vary by sex | |
Alcohol | Adult brain tumors | Meta-analysis of 12 studies: nonsignificant RR = 0.97 (95 % CI 0.82, 1.15) for drinkers vs. nondrinkers [58] | Broadly similar results for glioma and meningioma |
Coffee | Adult glioma | Meta-analysis of six studies: nonsignificant RR = 1.01 (95 % CI 0.83, 1.22) for highest vs. lowest consumption [59] | |
Tea | Adult glioma | Meta-analyses: RR = 0.86 (95 % CI 0.78, 0.94) for regular vs. never/occasional consumption based on three studies, nonsignificant RR = 0.88 (95 % CI 0.69, 1.12) for highest vs. lowest consumption [59] | |
Exposure to common infections | Childhood brain tumors | Several studies suggest protective effect of early exposure, but elevated risk with exposure later in childhood [36] | Level of risk often varied with tumor type and age at diagnosis |
Oligodendroglioma (including anaplastic oligodendroglioma) | Pooled analysis of seven studies: chickenpox, OR = 0.6 (95 % CI 0.4, 0.8) [40] | Result for both tumor subtypes combined; effect similar for each subtype | |
Meningioma | Case-control study in four regions of the United States: chickenpox, OR = 0.6 (95 % CI 0.5, 0.8) [42] | ||
Anti-inflammatory drugs | Adult brain tumors | Meta-analysis of ten studies: RR = 1.01 (95 % CI 0.89, 1.15) for overall use of nonsteroidal anti-inflammatory drugs (NSAIDs) [60] | Results were similar for aspirin and nonaspirin NSAIDs and for glioma and meningioma |
Adult glioma | Recent studies of antihistamine use have inconsistent results [54] | ||
SV40 | Ependymoma, choroid plexus tumors | Danish national incidence study: no evidence of increased incidence associated with contaminated poliovirus vaccine [61] | Unlike in previous studies, period of contamination was known and extent of use was well documented |
14.2.7 Meta-analysis of Epidemiological Studies
This section draws on recent meta-analyses, pooled analyses, and reviews of specific risk factors and selected individual studies, together with the most recent comprehensive reviews of environmental and exogenous risk factors for childhood brain tumors [36], adult gliomas [54], and meningioma [62]. The results for factors regarding which there is most evidence are discussed briefly.
Acquired Immune Deficiency Syndrome (AIDS)
Primary non-Hodgkin lymphoma (NHL) of the brain has occurred consistently as an acquired immune deficiency syndrome (AIDS)-defining illness in around 0.5 % of AIDS patients [29] and brain NHL being associated with HIV infection in 55 % at ages 15–49 years. In an analysis of cancer incidence among nearly 48,000 human immunodeficiency virus (HIV)-seropositive people from North America, Europe, and Australia, the adjusted annual incidence of cerebral NHL fell significantly from 1.7 per 1,000 during the period 1992–1996 to 0.7 per 1,000 during the years 1997–1999, indicating a substantial reduction in risk with the introduction of highly active antiretroviral therapy [30].
Ionizing Radiation
The only established environmental risk factor for CNS tumors is ionizing radiation. Radiotherapy (RT) for cancer, including prophylactic CNS irradiation as part of the treatment for childhood leukemia, increases the risk of CNS tumors in young people. The predominant tumor types are meningiomas and high-grade astrocytomas [10, 11]. There is also evidence supporting radiation related to diagnostic imaging, including CT scanning, as a risk factor [15, 63, 64], but the evidence regarding high background radiation is less strong.
Nonionizing Radiation
There is much less evidence that exposure to nonionizing radiation is a risk factor for brain tumors. Studies of occupational exposure to electromagnetic fields are heterogeneous, and the absence of a dose–response relationship in most studies makes the results hard to interpret. Epidemiological studies of exposure to radiofrequency emissions from the use of mobile telephones suggest that a large risk over a short time of use is unlikely, but there is insufficient evidence regarding the possibility of increased risks that are relatively small or related to longer follow-up periods [48, 50, 51].
Carcinogens
Intra-CSF (intrathecal) methotrexate with a cumulative exposure >70 mg/m2 is associated with an increased risk of meningioma (RR 35.6 adjusted for radiation exposure) [11]. Since N-nitroso compounds (NOCs) were found to be potent experimental carcinogens more than 30 years ago, a succession of epidemiological studies has investigated the hypothesis that exposure to preformed NOCs or their precursors can cause brain tumors in humans. Studies have been most consistent for cured meat consumption but have often depended on un-validated data [23–25, 65]. Tobacco smoke is a potent source of NOCs and polycyclic aromatic hydrocarbons (PAHs), among other carcinogens, but there is little evidence to associate smoking by parents or patients [55, 56], alcohol intake [58], and coffee or tea drinking [59] with CNS tumors. There is some evidence that parental exposure to pesticides is a risk factor for childhood CNS tumors [27], but there has been little consistency in studies of other parental occupations [28].
Fetal Growth Rate, Weight, and Stature
Epilepsy and Head Injury
Raised risks of glioma in association with a history of epilepsy have been found in several studies of children [66] and adults [64, 65]. It seems likely, however, that this reflects at least in part the fact that epilepsy can be an early symptom of a brain tumor, especially low-grade astrocytomas of childhood [66]. There is little consistent evidence that head injury is a risk factor for CNS tumors [67–69].
Protective Effects
Many studies have found a protective effect of prenatal vitamin or folic acid supplements against childhood brain tumors, though with limited consistency regarding particular supplements [36]. There is a growing body of evidence that past history of allergies, asthma or eczema [37–43], or certain common viral infections [36, 40, 42] are protective against glioma and meningioma. This may indicate a role for immunological factors in the etiology of CNS tumors. The apparent protective effect of female reproductive hormones is consistent with the generally lower incidence of glioma in women compared with men [46, 47]. High levels of physical activity [35] and the presence of diabetes [44, 45] have been found protective.
14.2.8 Predisposing Genetic, Familial, and Endogenous Conditions
An appreciable proportion of AYAs with CNS tumors may be associated with predisposition syndromes that in some instances may not be diagnosed until the CNS tumor presents. Their recognition is critical as the predisposing condition may:
Determine the diagnostic process.
Affect the prognosis for the tumor.
Play a part in treatment selection.
Provide novel genetically determined approaches for therapy.
Be the presenting symptom of a previously unrecognized genetic disease and provide an opportunity for participation in important tumor-related research, which, with current rates of progress, may influence treatment options in the foreseeable future. The range of currently recognized predisposing genetic conditions is listed in Table 14.3 [70–82].
Table 14.3
Syndromes associated with CNS tumors
Syndrome (gene)
Associated CNS tumors
Ataxia-telangiectasia (ATM)
Medulloblastoma
Constitutional Mismatch Repair Deficiency Syndrome (MSH2, MSH6, MLH1, PMS2)
Astrocytoma
Glioblastoma
CNS primitive neuroectodermal tumor
Medulloblastoma
Familial adenomatous polyposis (APC)
Astrocytoma
Medulloblastoma
Ependymoma
Pineoblastoma
Carney complex (PRKAR1A)
Schwannoma (psammomatous melanotic)
Cowden syndrome (PTEN)
Dysplastic gangliocytoma of cerebellum
Meningioma
DICER1 syndrome (DICER1)
CNS primitive neuroectodermal tumor (specifically medulloepithelioma)
Pineoblastoma
Pituitary blastoma
Fanconi anemia (FANCD1/BRCA2, FANC-N, or PALB2)
CNS primitive neuroectodermal tumor
Medulloblastoma
Hereditary retinoblastoma (RB1)
Pineoblastoma
Li–Fraumeni Syndrome (TP53)
Astrocytoma
High-grade glioma (diffuse astrocytoma, anaplastic astrocytoma, glioblastoma)
Choroid plexus tumor
CNS primitive neuroectodermal tumor
Medulloblastoma
Neurofibromatosis type 1 (NF1)
Glioma (brain stem, neuraxial)
Pilocytic astrocytoma/optic pathway glioma
Diffuse astrocytoma
Glioblastoma
Malignant peripheral nerve sheath tumor
Neurofibroma
Neurofibromatosis type 2 (NF2)
Glioma
Astrocytoma
Ependymoma
Meningioma
Neurofibroma
Schwannoma
Vestibular schwannoma
Nevoid basal cell carcinoma syndrome (PTCH/SUFU)
Astrocytoma
Craniopharyngioma
Medulloblastoma (desmoplastic subtype)
Meningioma
Oligodendroglioma
Rhabdoid tumor predisposition syndrome (SMARCB1)
Atypical teratoid/rhabdoid tumor
Malignant peripheral nerve sheath tumor
Rubinstein–Taybi syndrome (CREBBP)
Medulloblastoma
Schwannomatosis (SMARCB1)
Schwannoma
Tuberous sclerosis complex (TSC)
Subependymal giant cell astrocytoma
Von Hippel–Lindau (VHL)
Hemangioblastoma (intracranial, spinal)
14.2.9 Genetic Factors
The possible effects of common heritable variants on the risk of glioma started to be investigated over 20 years ago, though it was only with the advent of genome-wide association studies (GWAS) for glioma around 2009 that reproducible results began to emerge [54]. By the end of 2013, eight independently significant germ-line single nucleotide polymorphisms (SNPs) had been identified in five GWAS; of these, some appeared to contribute to glioma risk in general, whereas others were limited to particular histological or molecular subtypes [54]. Since then, GWAS have proliferated, and a recent genome-wide complex trait analysis indicated that one quarter of variation in glioma risk is associated with common SNPs that are in linkage disequilibrium with functional variants, with the proportion being very similar for glioblastoma and non-glioblastoma tumors [83].
Of course, SNPs implicated in glioma etiology may in fact be irrelevant to tumors of adolescents and young adults, but a recent analysis of data from the multinational CEFALO study found that several SNPs previously associated with adult glioma risk may also be associated with risk of childhood brain tumors [84]. This suggests that brain tumors in children and adults – and thus also in AYA – may share common genetic risk factors and similar etiological pathways [84]. Particular interest has developed in the possible involvement of telomere maintenance in predisposition to, and initiation of, gliomas, as with many other cancers, especially as inherited variants in some telomere-related genes influence glioma risk [85].
14.2.9.1 Neurofibromatoses
Neurofibromatosis Type 1 (NF1)
NF1 is associated with visual pathway glioma and other tumors of the CNS [86–90]. About 20 % of NF1 cases are associated with low-grade glioma which are almost always pilocytic astrocytomas, the most common locations for them being the visual pathways, cerebellum, and brain stem [91]. They can occur anywhere in the central nervous system. Their frequency in early childhood affecting the visual pathways is classical and justifies visual screening during early childhood. Their treatment, where visual function is progressively affected or seriously threatened, is by chemotherapy, vincristine and carboplatin or vinblastine alone being the most commonly used drugs. New biological markers of the MAP kinase pathway are underdevelopment and in trial; antiangiogenic drugs may effectively reverse neurological signs, but sustained use is associated with vascular risks. Radiotherapy, while effective, is potentially damaging to vascular structures within the radiation field and is generally avoided or used with highly focused techniques. Where surgical removal is not possible, the tumors can be seen to grow, arrest, and then in some cases involute or even regrow, during childhood and adolescence. This growth pattern may be derived from growth characteristics of the normal brain. Benign tumors associated with NF1 are generally seen to burn themselves out by the end of adolescence, remaining static or indeed involuting. There is an association between NF1 and high-grade glioma; their treatment is complicated by enhanced radiosensitivity linked to the NF1 genotype, which can lead to encephalopathy or late vascular damage. As a consequence, surgery and chemotherapy or biologically targeted therapy would be recommended before considering radiotherapy.
Neurofibromatosis Type 2 (NF2)
NF2 is a genetic condition where mutations in the NF2 gene leads to abnormalities of the gene product, a protein called merlin. This protein is made in the nervous system, particularly in specialized cells that wrap around and insulate nerves (Schwann cells) where it is thought to control cell shape, cell movement, and communication between cells. Merlin also functions as a tumor suppressor protein, which prevents cells from growing and dividing too fast or in an uncontrolled way. This shortened protein cannot perform its normal tumor suppressor function in cells permitting cells, especially Schwann cells, to multiply too frequently and form noncancerous tumors, characterized by the presence of acoustic neuromas or auditory nerve sheath schwannomas, causing hearing difficulties. Other clinical features include skin nodules or plaque-like lesions, cafe au lait patches, mono- or polyneuropathies, and visual loss due to cataracts or post lenticular opacities. In addition there is high risk of intracranial meningioma, affecting 18–58 % of patients [92], astrocytomas and ependymomas in about 3 % of patients [90]. When present in the AYA age group, they may represent the more aggressive version of the disease, the Wiseheart type, which present in childhood are progressive and reduce life expectancy compared to the adult presentation [93].
14.2.9.2 Meningiomas
Multiple meningiomas are also a feature of NF2, occurring earlier in life than sporadic meningiomas, and are usually WHO grade 1 tumors. There is no increased frequency of atypical or malignant meningiomas, although they are more frequently fibroblastic [94].
14.2.9.3 Schwannomas
NF2-associated schwannomas are WHO grade 1 tumors that differ from sporadic schwannomas by presenting at an earlier age and at multiple sites (e.g., bilateral vestibular schwannomas occurring in the third decade of life). The role of antiangiogenic drugs bevacizumab is currently under investigation and extended use to inhibit tumor progression/development [95]. They affect multiple cranial and spinal nerves, predominantly sensory (5th and 8th), although motor roots such as the 12th are reported. They may present as either multilobular tumors or as multiple schwannomatous tumorlets with potential to progress to schwannomas. Vestibular schwannomas may entrap several cranial nerves, exhibiting high-proliferative activity.
14.2.9.4 Astrocytomas/Gliomas
The overwhelming majority (80 %) of gliomas associated with NF2 are intramedullary, either within the spinal cord or the cauda equina. A further 10 % affect the medulla. Up to 75 % of these gliomas are ependymomas, frequently multiple, the remainder being diffuse or pilocytic astrocytomas.
14.2.9.5 Neurofibromas
Although these occur, they are frequently found to be schwannomas upon review. Plexiform neurofibromas are not seen in NF2.
14.2.9.6 Von Hippel–Lindau Syndrome
This is an autosomal dominant disorder caused by mutation in the VHL antiangiogenic tumor suppressor gene on chromosome 3p, with an incidence of between 1:36,000 and 1:45,500. Diagnostic criteria are based upon:
Capillary hemangioblastoma in the CNS or retina
The presence of one of the typical VHL-associated tumors
A previous family history
Among 83 subjects in a genetic register for VHL disease in North West England, cerebellar hemangioblastoma affected 60 % and was the presenting manifestation in 35 % [96]. Hemangioblastoma was diagnosed at a mean age of 30 years (range 15–56 years), so a sizeable proportion of diagnoses must have been at age 15–29 years. Spinal hemangioblastoma occurred in 14 % of subjects, at slightly more advanced ages. Of 86 people with a CNS hemangioblastoma in the regional cancer registry, 13 % were on the VHL register. Ependymomas and choroid plexus papillomas have been reported in association with VHL, probably mediated through the loss of suppression of the pro-angiogenic hypoxia inducible factor (HIF 1a) when the VHL gene is mutated.
14.2.9.7 Capillary Hemangioblastoma
A WHO grade 1 tumor of stromal cells and abundant capillaries, an uncertain histogenesis, and a preferential cerebellar location, capillary hemangioblastoma has been reported in the brain stem, spine, and, rarely, supratentorially. When associated with VHL, these tumors are frequently multiple in number. They occur with increasing frequency during development and with the peak incidence occurring in the thirties. The success of surgical resection (though repeated resection of cerebellar tumors can carry significant morbidity) means that life-limiting tumor problems of VHL often relate to malignancy at other sites (e.g., renal cell carcinoma), justifying surveillance at regular intervals.
Stay updated, free articles. Join our Telegram channel

Full access? Get Clinical Tree


