Age 15–39
Estimated cases a
Incidence rate
Estimated deaths
Death rate
All cancers
1,048,821
37.5
390,579
14.0
Males
383,209
26.8
183,116
12.8
Females
665,612
48.7
207,463
15.2
LDRb
807,768
33.8
349,529
14.6
MDRc
241,053
58.4
41,050
9.9
Age group
Estimated cases
Incidence rate
Estimated deaths
Death rate
All agesd
14,067,894
182.0
8,201,575
102.4
0–14
163,284
8.8
79,956
4.3
15–39
1,048,821
37.5
390,579
14.0
40–44
655,050
138.8
264,542
56.1
45–49
933,844
220.9
409,105
96.8
50–54
1,239,316
338.2
577,123
157.5
55–59
1,577,831
489.1
784,558
243.2
60–64
1,765,236
683.9
929,790
360.2
65–69
1,671,710
895.8
939,692
503.6
70–74
1,609,588
1114.4
1,023,544
708.7
75+
3,403,214
1544.0
2,802,686
1271.6
This chapter expands the age range used in the first edition of 15–29 years of age to a higher upper age limit, 39 years, as defined by the National Cancer Institute Progress Review Group of 2004–2005 [1] and explained in the introductory chapter. Thus, most of the data in this chapter are new, and previously unreported observations are identified as such. The overview in this chapter emphasizes general epidemiologic and survival comparisons of the different cancers by sites and organ systems and how they vary over age, sex, and time. To the extent possible, global, continental, and national data, including those of regional areas in Europe, of Japan, and of the United States, are included. Detailed results for specific sites can be found in the site-specific chapters.
2.2 Sources of Information and Modes of Analysis: Incidence, Survival, and Mortality
2.2.1 Age
The age range for AYAs in this edition of the textbook is 15–39 years, inclusively. It had been 15–29 years in an initial United States (US) National Cancer Institute (NCI) treatise [2], but during the second NCI Workshop on AYA oncology, the upper age limit was raised to 39 years [1]. The Progress Review Group (PRG) on AYA Oncology in 2004–2005 affirmed this age range with full cognizance of the increased heterogeneity and diversity that the additional years encompassed [3].
2.3 Data Sources and Analyses
The data from Europe were obtained from EUROCARE-5 for survival analyses (Fig. 2.1). The data from Japan are taken from six prefectures (J-CANSIS) (Fig. 2.1) representing 14 % of the country’s population and in more detail from the Osaka Cancer Registry. Data from the United States were obtained from the NCI Surveillance, Epidemiology, and End Results (SEER) Program (Fig. 2.1). GLOBOCAN data were used to assess incidence by continent and in Europe by region.
Fig. 2.1
Cancer registries included in EUROCARE-5, US SEER, and J-CANSIS
2.3.1 Incidence
GLOBOCAN estimates for 2012 were used for the worldwide projections of cancer incidence counts and rates by sex and cancer site [4]. For the presentation of the incidence data by population, we identified first two large geographic regions: a more developed region (MDR) including all regions of Europe plus Northern America, Australia/New Zealand, and Japan versus less developed regions (LDR), including all regions of Africa, Asia (excluding Japan), Latin America and the Caribbean, Melanesia, Micronesia, and Polynesia. Furthermore, for a more detailed description, we also identified six geographic regions: North America (N America) (United States and Canada) and Northern, Western, and Southern Europe (N, W, S Europe), Central and Eastern Europe (C & E Europe), South America (S America), Asia, and Africa. A listing of the countries in each group can be found in the reference for GLOBOCAN [5].
The SEER Program collected cancer incidence and survival data on approximately 10 % of the US population between 1973 and 1992 (SEER9), 14 % of the US population between 1992 and 2000 (SEER13), and 26 % thereafter (SEER18) (Fig. 2.1), the last of which has 28–29 % of the country’s 15- to 39-year-olds. The SEER Program, described in detail elsewhere [6], collects information on primary site and detailed histology according to the International Classification of Diseases for Oncology third edition (ICD-O-3) [7] since 2001. Prior to 2001, site and histology were collected based on International Classification of Diseases for Oncology 1976 (ICD-O-1) up to 1992 and International Classification of Diseases for Oncology second edition (ICD-O-2) [8] from 1992 to 2000. The ICD-O-3 hematopoietic codes were updated based on WHO classification of tumours of haematopoietic and lymphoid tissues (2008) [9]. Long-term trends were based on 9 SEER geographic areas (SEER9) [10] and more recent information since 2000 on 18 SEER geographic areas (SEER18) [5]. SEER*Stat (version 8.1.5), Excel 2007, and STATA 13 were used for analysis of SEER data.
In order to analyze site and histology, the SEER data were recoded into meaningful groups. For some chapters, the AYA recode based on Barr et al. [11] was used because it was designed to group site and histology with an emphasis on histology for the AYA age group. The AYA recode was adapted slightly to account for the new hematopoietic codes implemented in 2010 [12]. Since the upper age limit of the AYA age group was raised to 39 years of age [1], some of the chapters used the SEER site recode [13] to emphasize primary site, i.e., all histologies except lymphoma are included for each of the solid tumors. In the AYA recode, the histologies are usually limited to carcinomas for the solid tumors and excluded in situ tumors. In situ cancers of the bladder were combined with the invasive tumors, and pilocytic astrocytomas were excluded.
2.3.2 Survival
European survival data were obtained from EUROCARE (EUROpean CAncer REgistry-based study on survival and care of cancer patients) fifth edition [14]. EUROCARE is the widest collaborative research project on cancer survival in Europe. It started in 1989 to provide an updated description of cancer survival time trends and survival differences across European countries, measure cancer prevalence, and study patterns of care of cancer patients. The fifth edition, EUROCARE-5, included data on more than 21 million cancer diagnoses provided by 116 cancer registries (including 10 specialized childhood cancer registry) in 30 European countries from Jan 1, 1978, to Dec 31, 2007, with the date of death updated to at least December 31, 2008 (except for France cancer registries; December 31, 2007) (Fig. 2.1) [15].
Survival was analyzed for 56,505 cancer cases in European children (age <15 years), 312,483 cancer cases in AYAs (age 15–39 years), and 3,567,383 cancer cases in adults (40–69) diagnosed during the period 2000–2007. Only malignant cancers were included (pilocytic astrocytoma was excluded). Patients who had more than one type of cancer were included in the survival analyses; thus, if two or more cancers were diagnosed in a single patient, all were included in the analyses. More information on the database and the quality can be found in Trama et al. [16].
Individual types of AYA cancers were grouped into 19 diagnostic categories affecting AYAs and children and 20 carcinoma categories affecting AYAs and adults (Table 2.4) defined by the International Classification of Childhood Cancers (ICCC) third edition [17] with the addition of “all cancers combined.” We estimated relative survival, the ratio of observed survival to the expected survival in the general population of the same age and sex, to correct for deaths from causes other than the cancer under investigation. We used the cohort approach, Ederer II method [18], to estimate survival for patients diagnosed in 2000–2007 and followed up until at least the end of 2008, enabling estimation of 5-year relative survival. We used a complete analysis which is a modification of traditional cohort analysis, in which more recently diagnosed patients are also included, even if they could not possibly have completed the entire follow-up interval of interest [19].
The differences in survival by age groups (0–14 vs 15–39 and 15–39 vs 40–69) were tested with a z test with a significance level α = 0.05 [20]. The survival for the comparison of adults and AYAs was truncated at 69 years of age. To compare children and AYAs, survival in Europe as a whole was obtained by directly weighting the regional grouping survival estimates with weightings proportional to the population of 0–39 years in each regional grouping in 2000–2007. To provide the overall EU survival for adults, the weighting used to estimate survival in Europe was proportional to the adult population (15–99 years) [21].
Japanese survival data were obtained from J-CANSIS (Japanese CANcer Survival Information for Society), representing 14 % of the country’s population. J-CANSIS data were provided by the population-based cancer registries of six prefectures (Yamagata, Miyagi, Fukui, Niigata, Osaka, and Nagasaki). These prefectural cancer registries have cancer records with high data quality (death certificate only = 3.9–17.7 %) and have been used to estimate national statistics for cancer survival in Japan for a long time. Survival was analyzed for 1852 Japanese children (aged 0–14 years) and 13, 190 AYAs (age 15–39 years) diagnosed with cancer during the period 2000–2006. The same site/histology groupings as in the European and SEER data were used (pilocytic astrocytoma was excluded). The maximum likelihood method was applied to estimate relative survival using the strel command in the publicly available STATA program. More information on the database and its quality can be found elsewhere [22].
To assess changes in survival over time from 1999 to 2007, 5-year relative survival was estimated by the period approach [19] for patients under observation/follow-up in 1999–2001 (diagnosed 1995–2001), 2002–2004 (diagnosed 1998–2004), and 2005–2007 (diagnosed 2001–2007). To assess the statistical significance of survival changes over time, the relative survival was modeled with a generalized linear model, which implies a Poisson distribution of the number of observed deaths in each interval. The Poisson regression model, with the year of diagnosis included as a continuous variable, was used to obtain the average yearly reduction in mortality for the period of diagnosis 1999–2007 expressed as the relative excess risk of death. The relative excess risk of death was estimated for each diagnostic group for Europe as a whole adjusted by country, age class, sex, and year of diagnosis.
The US survival data from 18 SEER geographic areas from 2000 to 2007 were used for the comparison of survival data from Europe and Japan. The same site/histology groupings were used as in the European data: in situ bladder cancers were included, and pilocytic astrocytomas were excluded. For urinary bladder, benign, in situ, and invasive tumors were included for Europe and in situ and invasive tumors for SEER. In addition, carcinoids (ICD-O-3 8240–8244) were excluded from the colon and appendix in both the European and SEER analyses.
Five-year survival trends in the United States were assessed from 1975 to 2012 by excluding Kaposi sarcoma and non-Hodgkin lymphoma in males and thyroid cancer in females. The former was necessary since the human immunodeficiency virus/acquired immunodeficiency syndrome (HIV/AIDS) epidemic during the 1980s and early 1990s markedly increased the incidence of Kaposi sarcoma and non-Hodgkin lymphoma (NHL) in AYA males, cancers with such a poor prognosis that the overall survival rate substantively declined. The latter was necessary because of the overdiagnosis of thyroid cancer, predominantly in females, that began in the 1990s and has escalated since, progressively inflating the overall survival in AYA females.
2.3.3 Mortality
GLOBOCAN estimates for 2012 were used for the worldwide projections of cancer mortality counts and rates by sex and cancer site [10]. The US mortality data were from the National Center for Health Statistics (NCHS) as analyzed by the SEER Program which obtained files containing all deaths occurring in the United States by calendar year since 1969. Further details can be found elsewhere [6]. Only the underlying cause of death was used in the calculation of death rates. Cause of death was coded according to ICD-9 (1979–1988) and ICD-10 (1999+). Mortality groupings were used that correspond to the SEER site recode [17].
2.4 Global, Regional, and National Perspectives
2.4.1 Incidence
2.4.1.1 Cancer Incidence Worldwide
Worldwide over one million AYAs aged 15–39 years were diagnosed with malignant cancer in 2012 based on GLOBOCAN [4] (Table 2.1), which is 7 % of the 14.1 million new cancer cases of all ages worldwide estimated by GLOBOCAN for the same year [23].
The mix of malignant tumors in AYAs differs from that for all ages combined and from that in both younger and older persons. For all ages and both sexes, the top five cancers worldwide in 2012, in order of incidence, were cancer of the lung (13 %), breast (12 %), colorectum (10 %), prostate (8 %), and stomach (7 %) [23]. For AYAs, the order for the same year was breast cancer (18 %), cervix uteri cancer (11 %), thyroid cancer (8 %), leukemia (6 %), and central nervous system (CNS) tumors (4 %) (Table 2.2). In the United States, the predominant cancers in AYA males and females differ from the worldwide sequence in that, for the year 2012, the order was thyroid carcinoma (16 %), breast carcinoma (15 %), melanoma (9 %), cervix uteri carcinoma (7 %), and colorectal carcinoma (6 %).
Table 2.2
Worldwide estimated cancer incidence and mortality frequencies for ages 15–39 in 2012 based on GLOBOCAN
Cancer | Incidence | Mortality | ||||||||
|---|---|---|---|---|---|---|---|---|---|---|
Males and females | Males | Females | Overall rank | Male to female ratio | Males and females | Males | Females | Overall rank | Male to female ratio | |
All cancersa | 1,048,821 | 383,209 | 665,612 | 0.6 | 390,579 | 183,116 | 207,463 | 0.9 | ||
Bladder | 7401 | 4856 | 2545 | 21 | 1.9 | 1639 | 1149 | 490 | 22 | 2.3 |
Brain, nervous system | 46,915 | 26,670 | 20,245 | 5 | 1.3 | 23,661 | 13,814 | 9847 | 5 | 1.4 |
Breast (female only) | 191,844 | 191,844 | 1 | 48,961 | 48,961 | 1 | ||||
Cervix uteri | 111,503 | 111,503 | 2 | 28,201 | 28,201 | 4 | ||||
Colorectum | 42,647 | 21,947 | 20,700 | 7 | 1.1 | 21,474 | 10,979 | 10,495 | 6 | 1.0 |
Corpus uteri | 15,535 | 15,535 | 18 | 1608 | 1608 | 23 | ||||
Gallbladder | 3879 | 1401 | 2478 | 24 | 0.6 | 2411 | 958 | 1453 | 21 | 0.7 |
Hodgkin lymphoma | 28,330 | 15,396 | 12,934 | 11 | 1.2 | 6199 | 3727 | 2472 | 14 | 1.5 |
Kaposi sarcoma | 22,975 | 14,437 | 8538 | 16 | 1.7 | 8795 | 5032 | 3763 | 12 | 1.3 |
Kidney | 13,660 | 7798 | 5862 | 19 | 1.3 | 3722 | 1912 | 1810 | 19 | 1.1 |
Larynx | 3506 | 2575 | 931 | 25 | 2.8 | 1388 | 1002 | 386 | 24 | 2.6 |
Leukemia | 61,432 | 35,313 | 26,119 | 4 | 1.4 | 45,169 | 26,322 | 18,847 | 2 | 1.4 |
Lip, oral cavity | 24,251 | 15,267 | 8984 | 14 | 1.7 | 10,327 | 7836 | 2491 | 10 | 3.1 |
Liver | 42,372 | 32,871 | 9501 | 8 | 3.5 | 37,528 | 29,765 | 7763 | 3 | 3.8 |
Lung | 23,182 | 13,465 | 9717 | 15 | 1.4 | 15,977 | 9636 | 6341 | 9 | 1.5 |
Melanoma of the skin | 26,600 | 10,055 | 16,545 | 12 | 0.6 | 3200 | 1642 | 1558 | 20 | 1.1 |
Multiple myeloma | 2277 | 1444 | 833 | 26 | 1.7 | 743 | 497 | 246 | 27 | 2.0 |
Nasopharynx | 15,949 | 10,340 | 5609 | 17 | 1.8 | 5547 | 3505 | 2042 | 15 | 1.7 |
Non-Hodgkin lymphoma | 45,824 | 27,229 | 18,595 | 6 | 1.5 | 20,214 | 12,118 | 8096 | 7 | 1.5 |
Esophagus | 8737 | 5362 | 3375 | 20 | 1.6 | 6986 | 3927 | 3059 | 13 | 1.3 |
Other pharynx | 5727 | 3726 | 2001 | 22 | 1.9 | 3935 | 2680 | 1255 | 17 | 2.1 |
Ovary | 31,492 | 31,492 | 10 | 9498 | 9498 | 11 | ||||
Pancreas | 5310 | 2800 | 2510 | 23 | 1.1 | 3888 | 2243 | 1645 | 18 | 1.4 |
Prostate | 1087 | 1087 | 27 | 978 | 978 | 26 | ||||
Stomach | 26,313 | 13,598 | 12,715 | 13 | 1.1 | 18,697 | 9689 | 9008 | 8 | 1.1 |
Testis | 33,871 | 33,871 | 9 | 4233 | 4233 | 16 | ||||
Thyroid | 83,980 | 16,734 | 67,246 | 3 | 0.2 | 1116 | 251 | 865 | 25 | 0.3 |
Figures 2.2 and 2.3 illustrate with the United States data how the cancer mix in AYAs is highly age dependent within the AYA age span, as the cancers of childhood transit to those in adulthood (Fig. 2.2). From the youngest AYAs to the oldest, the incidence of breast cancer increases from extremely rare to the most frequent cancer. Cancer of the female genital tract (cervix, uterus, vagina, vulva) undergoes a similar increase. Leukemia on the other hand decreases from the most frequent type in children to a few percent in the oldest AYAs. When considered as a proportion of all cancer (Fig. 2.3), at least seven cancers have their highest percentage within the AYA age range: thyroid cancer, Hodgkin lymphoma, testis cancer, osteosarcoma, Ewing tumor, and Kaposi sarcoma. More than half of the cancers in AYAs are accounted for by those that peak in proportion during the AYAs years, further rendering the array of cancer types unique to the age group.
Fig. 2.2
Cancer site distribution, US SEER18, 2000–2011, by age
Fig. 2.3
Invasive cancers that have the highest proportion in AYAs, US SEER13, by single year of age
Nearly two-thirds of the incident cases were in females because the most common cancers in this age group are female-specific tumors (cervix uteri and other female gynecologic malignancies) or sites where the rates among females are much higher than for males (breast and thyroid) (Table 2.2). The most common cancer site for ages 15–39 years was female breast cancer with nearly 192,000 cases worldwide in 2012. The second most common was cancer of the cervix uteri and third was cancer of the thyroid, with 112,000 and 84,000 cases, respectively (Table 2.2). In AYA males, the most common was the leukemia, with 35,000 cases worldwide in 2012, followed by testis cancer and liver cancer with 34,000 and 33,000 cases, respectively (Table 2.2).
2.4.1.2 Worldwide Geographic Variation
A broad grouping was used as a first cut of MDR. Since the populations of the LDR are so much greater than the MDR, it is expected based on GLOBOCAN estimates that more than two-thirds of the cases among 15–39-year-olds will reside in LDR, while the incidence rate is lower in LDR than MDR (Table 2.1).
Worldwide, the cancer incidence rates for AYAs vary from country to country and continent to continent. Figures 2.4 and 2.5 show, for males and females, respectively, the higher rates of total invasive cancers for North America (N America) (United States and Canada) and Northern, Western, and Southern Europe (N, W, S Europe) compared to the overall world rate of Central and Eastern Europe (C and E Europe), South America (S America), Asia, and Africa. While the overall cancer rates for N America and N, W, S Europe are similar, there are differences by site. In males, colorectal and renal cancer and leukemia and thyroid cancers are higher in N America, and melanoma and testicular cancer are higher in N, W, S Europe. The high rate in males of Kaposi sarcoma (KS) in Africa is in sharp contrast to the almost nonexistent KS rate in Asia and C and E Europe. Liver cancer is higher in Africa and Asia than in Europe (N, W, S and C and E Europe) and N America. In contrast, leukemia incidence rates in males are much lower in Africa than the other countries. Testicular cancer is much higher in N America and N, W, S Europe than in other regions. The incidence of nasopharyngeal cancer is higher in Asia than in any other regions.
Fig. 2.4
World cancer crude incidence rates, age 15–39, 2012, by geographic area and site, males. GLOBOCAN, N North/Northern, S South/Southern, W Western, C Central, E Eastern
Fig. 2.5
World cancer crude incidence rates, age 15–39, 2012, by geographic area and site, females. GLOBOCAN, N North/Northern, S South/Southern, W Western, C Central, E Eastern
For females (Fig. 2.5), the AYA breast cancer rates are similar between N, W, S Europe and N America, but nearly double those for the other regions. The rates for cancer of the cervix uteri range from a low of 6.7 in N America to a high of 14 per 100,000 females in S America and C and E Europe where it is the number one cancer among AYA females. The cervical cancer rates for N, W, S Europe are lower than for C and E Europe. However, in North Europe, cervix cancer incidence is also high in the Baltic countries which are included in the N, W, S Europe (data not shown). Thyroid cancer among AYA females in N America has more than double the rate of any other group of countries, and the thyroid cancer rate in Africa is one-twentieth that of N America. For females, N America has the highest rates for cancers of the colorectum, corpus uteri, and kidney and leukemia and NHL. S America has the highest rate for cancers of the ovary and the second highest rate for corpus uteri. While the KS rate among African females is lower than that for African males, the rate for African females is much higher than in the other country groups. Melanoma is higher in N, W, S Europe and N America and very low in Asia and Africa. For AYA females, nearly half of the cancers are breast or thyroid in N America and breast or cervix in C and E Europe, S America, Africa, and Asia. While Asia has the lowest breast cancer rate, breast cancer comprises nearly 30 % of the cancer burden among AYA females.
2.4.1.3 Overall Incidence by Single Years of Age (US SEER)
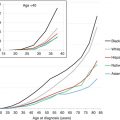
Since GLOBOCAN data are not available in finer age breakdowns than 15–39 years of age, SEER data were used to show how the cancer sites can vary across the age groups comprising the AYA group. Figure 2.6 shows the incidence rates for males and females by single years of age. After the childhood cancer peak between 2 and 4 years of age, the incidence decreases until age 8 in girls and 10 in boys and then increases exponentially until age 60 after which the increase slows until it plateaus after age 80. In females, the incidence is a smoothly exponential phase from age 10 to 50, whereas in males it is triphasic with separate exponential phases from age 10 to 25, 25 to 40, and 40 to 60. Males have a higher incidence from infancy to age 20 and after age 55, whereas females have a distinctly higher rate in between and particularly during the older AYA years.
Fig. 2.6
Incidence of invasive cancer, 2000–2011, US SEER18, by single year of age and sex
2.4.1.4 Individual Cancer Incidence by 5-Year Age Intervals (US SEER)
For ages 15–39 years, the overall cancer incidence rate increases with each 5-year age group from around 20 (ages 15–19) to 130 (ages 35–39) per 100,000 (Fig. 2.7). The rates for the 35–39-year-olds are much higher than the rates for other age groups for males and females. The rates for children under 15 years of age are less than the 15–19 age group and for those 40 and over are much greater (notice the scale break) than the 35–39 age group. For males (Fig. 2.8), the incidence rates range from less than 25–90 per 100,000 compared to a range of less than 25 to over 170 per 100,000 for females. For the older AYA age groups especially 35–39 years, the overall rates for males (Fig. 2.8) are lower than that for females (Fig. 2.9). Even though breast cancer is predominately a cancer for females, it remains the cancer with the highest rate for both males and females combined and females alone for the 35–39-year age group. The increase in the breast cancer rate across the female age groups is dramatic, and it ranges from 0.2 for ages 15–19 to 60.1 per 100,000 for females aged 35–39 (Fig. 2.9).
Fig. 2.7
Cancer incidence rates, 2000–2011, US SEER18, males and females, by site and age
Fig. 2.8
Cancer incidence rates, 2000–2011, US SEER18, males, by site and age (Note that the ordinate scale is different here from that used in Fig. 2.9)
Fig. 2.9
Cancer incidence rates by site and age, 2000–2011, US SEER18, females (Note that the ordinate scale is different here from that used in Fig. 2.8)
2.4.1.5 Individual Cancer Incidence by Age Group, Site, and Sex (US SEER)
In order to portray the incidence rates and trends more graphically, broader groups of sites were used in Figs. 2.7, 2.8, and 2.9. For males, genital (mostly testicular) cancer predominates for most age groups (from 20 years onward) except age group 35–39 in which three sites (lymphoma, male genital, and melanoma) dominate the picture.
For males aged 15–19 years, more than half of the cancers are leukemia, lymphoma, or genital tumors with corresponding rates of 3.6, 5.2, and 3.7 per 100,000. For males, the colorectal cancer rates increase from less than 1 per 100,000 for ages 15–19 to nearly 10 per 100,000 in 35–39-year-olds. Similarly, there is a large increase in cancer risk for melanoma between ages 15–19 and 35–39. Invasive CNS tumor rates and leukemia rates varied between 2 and 4 per 100,000 across all AYA age groups.
In proportional terms, breast cancer alone comprises 35 % of all female cancers in the 35–39-year age group and together with thyroid and genital cancers comprise over half of the cancers in this age group. Breast cancer is very rare for 15–19 (0.2) in comparison to 60 per 100,000 for ages 35–39. Large increases in rates across the age groups were seen for melanoma and cancers of the thyroid, genital tract, and colorectum.
Figure 2.10 shows the incidence rates for ages 15–39 combined by sex for a detailed list of over 25 cancer sites. Based on US SEER data, breast cancer is the number one cancer among AYA females with a rate of nearly 21 per 100,000, which is more than double the highest rate among males, cancer of the testis (10.17 per 100,000) (Fig. 2.10). For females, thyroid and melanoma complete the top three and for males, melanoma and NHL complete the top three. Cancer among AYAs is relatively rare with only female breast cancer, female thyroid cancer, and cancer of the testis with rates over 10 per 100,000 females/males.
Fig. 2.10
Cancer incidence rates, 2000–2011, ages 15–39, US SEER18, by site and sex. *oral cavity and oropharynx **soft-tissue sarcoma ***nonmelanoma skin cancer ^intrahepatic bile duct ^^non-thyroid endocrine
2.4.1.6 Incidence Trends by Site (US SEER)
Figure 2.11 depicts for American AYAs the average annual percent change (APC) during 2000-2011 of the incidence rate of cancer and of 28 individual types of cancer for females and for males. The average was 1 % per year in females and 0.25 % per year in males. For females, about half of the cancers show decreasing incidence trends and half show increasing trends. For males, more cancers decreased than increased in incidence. Lung and cervix uteri showed the largest decreases for females, whereas Kaposi sarcoma, anus, eye, and urinary bladder had decreases of more than 2 % per year for males. Two cancers, those of the kidney and thyroid, have had disproportionately greater increases in both females and males. For kidney cancer, the increases were 6.1 % and 5.8 % per year in males and females, respectively. For thyroid cancer, the corresponding rates were 5.1 and 4.7 % per year. In the United States, the cancers with the greatest increase during 1975–2011 among the oldest AYAs, those 35–39 years of age, were cancer of the thyroid, kidney, anorectum, and prostate (Fig. 2.12), the last a previously unreported finding. In females, the thyroid cancer increase accounts for most of the total increase, 61 % of the total during 1975–2011 and 83 % of the total during 2000–2011.
Fig. 2.11
Annual % change (APC) in cancer incidence, 2000–2011, age 15–39, US SEER18, by site and sex. *oral cavity and oropharynx **soft-tissue sarcoma ***nonmelanoma skin cancer ^intrahepatic bile duct ^^non-thyroid endocrine ^^^trachea and mediastinum
Fig. 2.12
Annual incidence of cancers in 35–39-year-olds with the greatest increase during 1975–2012, males and females, US SEER9
2.4.2 Survival
2.4.2.1 Site Distribution and Survival (Europe, US SEER, Japan)
Table 2.3 lists the 5-year relative survival rates for the United States (SEER) and Europe by diagnostic group for each of the 5-year AYA age groups (15–19, 20–24, 25–29, 30–34, 35–39). To better understand the composition of the overall rates, the site distributions by age are presented in Table 2.4. Table 2.5 contrasts the survival for children (<15 years) and AYAs (15–39 years combined) by geographic area and is limited to site/histology groups affecting both AYAs and children. In contrast, Table 2.6 displays survival rates limited to carcinomas affecting AYAs (15–39 years) and adults (40–69 years). Obviously not all possible cancers are displayed in each table; the totals, however, include all cancers in that age group.
Table 2.3
Five-year relative survival of AYAs with cancer in the European (EUR) pool and US (SEER) diagnosed during 2000–2007, by type of cancer and 5-year age interval
Diagnostic groupb | Age at diagnosis (years) | |||||||||
|---|---|---|---|---|---|---|---|---|---|---|
15–19 | 20–24 | 25–29 | 30–34 | 35–39 | ||||||
EUR | SEER | EUR | SEER | EUR | SEER | EUR | SEER | EUR | SEER | |
5-year relative survival (%) | ||||||||||
Acute lymphoid leukemia | 62.2 | 67.3 | 45.6 | 47.2 | 47.8 | 42.2 | 53.6 | 52.3 | 60.5 | 60.5 |
Acute myeloid leukemia | 52.2 | 48.5 | 55.2 | 48.3 | 47.7 | 49.4 | 49.3 | 51.6 | 47.3 | 46.7 |
Hodgkin lymphoma | 94.3 | 95.7 | 93.9 | 93.2 | 93.9 | 93.2 | 91.6 | 93.5 | 90.2 | 89.8 |
Non-Hodgkin lymphoma (except Burkitt) | 78.0 | 77.6 | 76.3 | 76.6 | 77.8 | 76.8 | 78.0 | 77.7 | 76.9 | 76.2 |
CNS | 61.8 | 64.7 | 63.4 | 65.6 | 60.1 | 66.4 | 57.4 | 61.1 | 49.8 | 57.8 |
Astrocytomas excluding pilocytic | 50.8 | 53.3 | 54.2 | 53.8 | 51.5 | 54.8 | 47.6 | 45.8 | 38.7 | 40.3 |
Intracranial and intraspinal embryonal tumors | 67.0 | 60.4 | 61.3 | 65.9 | 60.0 | 57.7 | 53.3 | 61.6 | 56.1 | 51.8 |
Medulloblastoma | 72.8 | 66.8 | 63.3 | 74.2 | 69.0 | 66.7 | 65.7 | 76.7 | 66.2 | 62.9 |
Osteosarcoma | 60.3 | 61.9 | 61.4 | 64.9 | 65.3 | 69.3 | 65.2 | 72.6 | 60.1 | 55.2 |
Chondrosarcoma | 80.7 | 94.7 | 80.5 | 87.3 | 85.5 | 89.8 | 82.7 | 90.2 | 83.1 | 89.5 |
Ewing tumor and related sarcomas of the bone | 51.1 | 56.2 | 50.4 | 54.2 | 45.3
Related posts:Stay updated, free articles. Join our Telegram channel
Full access? Get Clinical Tree
 Get Clinical Tree app for offline access

| |||||