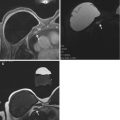
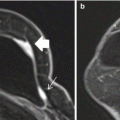
Amount of fibroglandular tissue (FGT)
Almost entirely fat
Scattered fibroglandular tissue
Heterogeneous fibroglandular tissue
Extreme fibroglandular tissue
Background Parenchymal Enhancement
Level
Minimal
Mild
Moderate
Marked
Symmetric or Asymmetric
Focus
Masses
Shape
Oval
Round
Irregular
Margin
Circumscribed
Not circumscribed
Irregular
Spiculated
Internal enhancement patterns
Homogeneous
Heterogeneous
Rim enhancement
Dark internal septations
Non-mass enhancement (NME)
Distribution
Focal
Linear
Segmental
Regional
Multiple regions
Diffuse
Internal enhancement pattern
Homogeneous
Heterogeneous
Clumped
Clustered ring
Non-enhancing findings
Ductal pre-contrast high signal on T1 W
Cyst
Post-operative collections (hematoma/seroma)
Post-therapy skin and trabecular thickening
Non-enhancing mass
Architectural distortion
Signal void from foreign bodies, clips, etc
Associated features
Nipple retraction
Nipple invasion
Skin retraction
Skin thickening
Skin invasion
a. Direct invasion
b. Inflammatory cancer
Axillary adenopathy
Pectoralis muscle invasion
Chest wall invasion
Architectural distortion
Kinetic Curve Assessment
Initial phase
Slow
Medium
Fast
Delayed phase
Persistent
Plateau
Washout
The standardized language used in the lexicon facilitates communication between the radiologist and ordering physician regarding morphologic and kinetic features of the pertinent findings, and promoting collaborative management.
2.2.1 Amount of Fibroglandular Tissue (FGT)
The amount of FGT correlates with breast density on mammography and is divided into quartiles. The proportion of fat and fibroglandular tissue varies widely and may be dependent on the patient’s age, hormonal influences and individual characteristics. While there are substantial individual variations, generally there is a greater proportion of fat in older women and more FGT in younger women.
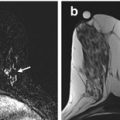
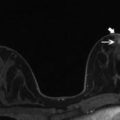
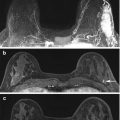
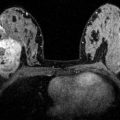
The amount of FGT is assessed on T1W imaging with or without fat suppression and is divided into almost entirely fatty, scattered fibroglandular tissue, heterogeneous fibroglandular tissue and extreme fibroglandular tissue (Fig. 2.1). In contrast to mammography, the amount of FGT does not limit the sensitivity of breast MRI.
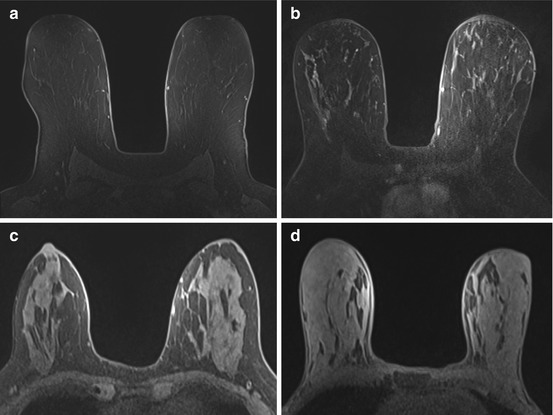

Fig. 2.1
Amount of fibroglandular tissue. Axial T1 pre-contrast images demonstrate entirely fatty (a), scattered (b), heterogeneous (c) and extreme (d) fibroglandular tissue
2.2.2 Background Parenchymal Enhancement (BPE)
BPE is the normal enhancement of fibroglandular tissue and should be assessed on the first set of post-contrast images, which are obtained 90 seconds after contrast administration. BPE does not necessarily correlate with the amount of fibroglandular tissue. For example, women with heterogeneously or extremely dense breast tissue counterintuitively may have minimal BPE (Fig. 2.2) and those with scattered fibroglandular tissue may have marked BPE.
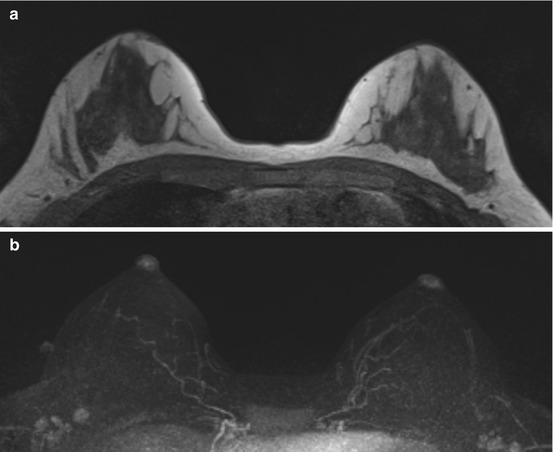

Fig. 2.2
The amount of FGT does not necessarily correlate with the degree of BPE. 54-year-old woman with heterogeneous FGT (a) has minimal BPE (b)
Due to the masking effects of BPE, there is the potential for decreased lesion conspicuity. Studies have shown that breast cancers can be detected regardless of BPE. However, the reduced specificity of breast MRI from BPE may lead to increased recommendations for follow-up or biopsy [4].
In general, BPE is more prominent during the luteal phase of the menstrual cycle in pre-menopausal women. As BPE is least prominent during week 2 of the menstrual cycle, screening breast MRI exams should be scheduled during this time whenever possible [5]. During weeks 1 and 4, the enhancement is more avid, and screening breast MRI exams should be avoided. When MRI is performed to assess extent of disease in women with known breast cancer, imaging should be performed regardless of the timing of the menstrual cycle, to avoid delay in care.
The level of BPE is divided into minimal (<25 % of FGT enhancement), mild (25–50 % of FGT enhancement), moderate (>50–75 % of FGT enhancement) and marked (>75 % of FGT enhancement) Fig. 2.3.
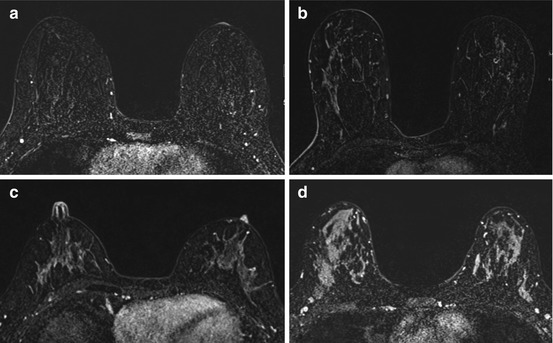

Fig. 2.3
Level of BPE. Axial T1 post-contrast subtracted images with minimal (a), mild (b), moderate (c) and marked (d) amount of background parenchymal enhancement
In addition to the level of BPE, it is also important to observe whether BPE is symmetric or asymmetric. Bilateral symmetric BPE appears as mirror image enhancement which is physiologic and likely related to the vascular supply of the breast. Preferential enhancement typically occurs in a peripheral and posterior distribution, creating a “picture frame appearance.” This pattern of enhancement is suggestive of benign BPE.
Asymmetric BPE, on the other hand, may be due to benign or malignant causes. Asymmetry denotes more enhancement in one breast relative to the other, and may be physiologic in a patient who has received radiation therapy, post breast conservation. The radiated breast has less BPE than the non-radiated breast, possibly due to localized decrease in vascularity from radiation therapy. In the absence of radiation, asymmetric BPE is suspicious for extensive disease and should be biopsied (Fig. 2.4).
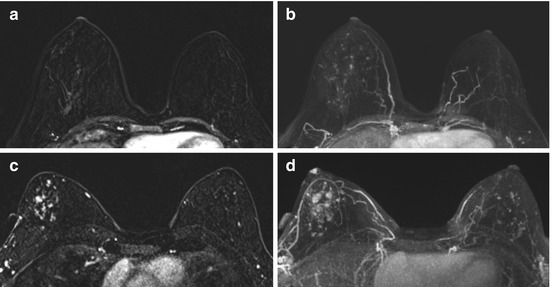

Fig. 2.4
Asymmetric BPE. Axial T1 post contrast subtracted (a) and axial MIP (b) images demonstrate asymmetric, increased background parenchymal enhancement within the right breast in this patient with history of left lumpectomy and radiation therapy. Axial T1 post contrast subtracted (c) and axial MIP (d) images in another patient demonstrate asymmetric increased enhancement within the right breast compared to the left in this patient with extensive right breast DCIS
2.2.3 Focus
A focus is defined as a punctuate dot of enhancement which is smaller than 5 mm and too small for its shape and margin to be accurately characterized (Fig. 2.5). A focus has no corresponding finding on the pre-contrast scan and is unlikely to have a correlate on ultrasound. A focus may be benign or malignant and should be evaluated in the clinical context. Tiny foci of enhancement widely separated by normal breast parenchyma represent BPE and should be assessed as benign. Other features that support benignity include high T2 signal, persistent enhancement kinetics, and stability from prior exams. Features of a focus that are more suspicious include low signal on T2 weighted images, washout kinetics, increased size and interval development compared to prior exams.


Fig. 2.5
Focus. Solitary punctate dot of enhancement inferior to site of recent surgical excision for DCIS in the upper central right breast on axial post contrast subtracted (a), sagittal (b) and sagittal MIP (c) images (arrows). MRI biopsy yielded DCIS involving a radial scar and intraductal papilloma
2.2.4 Masses
As in mammography and ultrasound, a mass is three dimensional and occupies space. It has a convex outward contour and is usually larger than or equal to 5 mm. Analysis of the shape, margin and internal enhancement can help differentiate benign masses like fibroadenomas from invasive breast cancer. The mass should be assessed on pre- and post-contrast images as well as on T2 weighted imaging.
Masses may be oval, round, or irregular in shape (Fig. 2.6). The descriptor oval is used for a mass that is elliptical and includes gentle lobulation with up to three undulations (Fig. 2.7). A round mass is one that is spherical, ball shaped, circular or globular (Fig. 2.8). By definition, a mass that is neither round nor oval is irregular (Fig. 2.9).
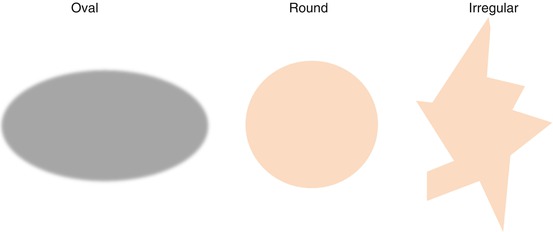
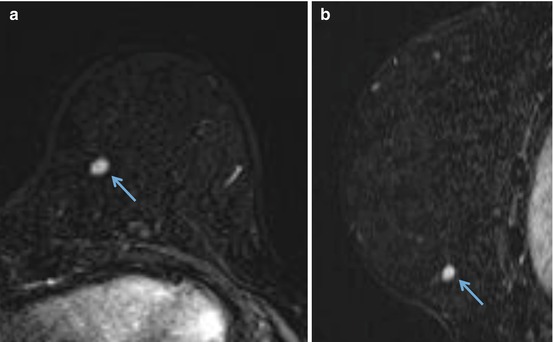

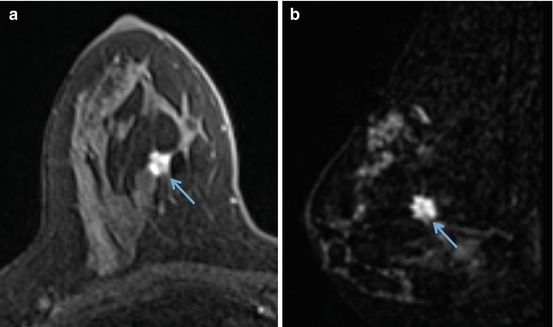

Fig. 2.6
Schematic of shape

Fig. 2.7
Mass shape – oval. Post contrast axial (a) and sagittal (b) images demonstrate a 0.8 cm oval enhancing mass in the left lower inner breast (arrows). MR biopsy revealed breast tissue with chronic inflammation, histiocytic reaction, and fat necrosis

Fig. 2.8
Mass shape – round. Round mass with circumscribed margins in the upper central left breast has high T2 signal (a) and uniform rim enhancement on the axial (b) and sagittal (c) post contrast images (arrows), consistent with a benign inflamed cyst

Fig. 2.9
Mass shape – irregular. MRI performed for extent of disease in a 42 year old female with a biopsy proven invasive ductal carcinoma in the right breast. Axial (a) and sagittal (b) post contrast images show an irregular 7 mm enhancing mass (arrows) which corresponds with the known cancer
Margin is the edge or border of the lesion and is an important predictor of the likelihood of malignancy of a mass. Margins are circumscribed or not circumscribed. A circumscribed margin is one that is well defined or sharp, with an abrupt transition between the lesion and the surrounding tissue (Fig. 2.10). Unlike mammography, for MRI, the entire margin of a mass must be well defined in order to be characterized as having a circumscribed margin. If any portion of the mass is not well defined, the mass is assessed as being not circumscribed. Margin and shape analysis should be performed on the first post contrast sequence to avoid lesion washout or progressive enhancement of the background parenchyma. Nunes et al. reported that 97–100 % of masses with circumscribed margin were benign [6, 7].
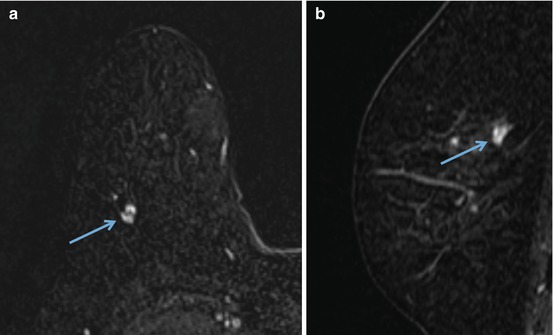

Fig. 2.10


Margin – circumscribed. Oval enhancing mass with circumscribed margins and non-enhancing internal septations in the right upper outer breast on post contrast axial (a) and sagittal (b) images (arrows) is consistent with a fibroadenoma
Stay updated, free articles. Join our Telegram channel

Full access? Get Clinical Tree


