Fig. 21.1
Markers of breast CTCs depend on the EMT stage. MET Mesenchymal-Epithelial Transition, EMT Epithelial-Mesenchymal Transition
CTCs are considered as EMT forms of primary tumor cells. Carcinoma cells initially activate the trans-differentiation EMT program, during which they acquire the traits needed to execute the multiple steps of metastasis [29]. During the metastatic process, carcinoma cells in primary breast tumors gradually change from an epithelial phenotype (in the primary tumor), via EMT to a mesenchymal phenotype (in the blood), to an epithelial phenotype again (at the metastatic sites). CTCs in the blood thus exhibit the EMT phenotype.
Breast CTCs in the blood have been recognized with different phenotypes ranging from epithelial to mesenchymal, depending on the stage of EMT. CTCs usually express an epithelial phenotype during the early stage of EMT, both epithelial and mesenchymal phenotypes in the intermediate stage, and a mesenchymal phenotype in late EMT. Pecot et al. recently showed that CTC capture based on cytokeratin (CK) expression would be likely to miss populations of CTCs that had undergone EMT because CTCs in the late stage of EMT lack expression of CK markers [30].
CTCs with Epithelial Phenotypes in Early Epithelial–Mesenchymal Transition
One epithelial marker detected in CTCs is the surface epithelial cell adhesion molecule (EpCAM). EpCAM is a pan-epithelial differentiation antigen expressed on most carcinomas. CTCs express high levels of this marker. Indeed, EpCAM levels are 100- to 1,000-fold greater in primary and metastatic breast cancers than in normal epithelial cells, and this molecule is implicated in tumor invasion and migration [31]. EpCAM has been suggested as a potential therapeutic target in patients with advanced malignancies [19]. EpCAM-positive CTCs could reflect both the volume of metastatic disease in breast cancer patients and the tumor biology in terms of aggressiveness, drug resistance, and mutation.
CTCs have also been defined as mononuclear cells lacking CD45 (which is expressed in blood cells) but expressing CKs (which are strongly expressed in epithelial cells) [32]. Some specific CKs such as CK8, CK18, CK19, and CK20 have been used as markers of CTCs, included breast CTCs [33–36]. Some commercially available methods for isolating CTCs have been developed based on antibodies to these marker proteins, in combination with CD45-negative selection to eliminate white blood cells.
Zhao et al. demonstrated that EpCAM-, CK19-, and hMAM-positive cells were detected in 50 (51.0 %), 43 (43.9 %), and 68 (69.4 %) of 98 patients, respectively, and triple-marker-positive CTCs were detected in 86 of the 98 (87.8 %) patients, which was a significantly higher rate than in the control group [37]. In a recent study, Tunca et al. showed that CK20 was a novel biomarker of breast CTCs, which could be used to identify CTCs as well as to predict breast cancer progression. The CK20-positivity rate was 28.57 % (24/84) [38]. CD227 (Mucin-1 or Ca 15.3) is highly expressed by virtually all mucosal epithelial tissues and is aberrantly expressed in most human breast cancers. It is also used as marker of breast cancer cells and breast CTCs [39–41].
CTCs with Epithelial–Mesenchymal Phenotype in Intermediate Epithelial–Mesenchymal Transition
During the intermediate stage of the EMT process, CTCs exhibit both epithelial and mesenchymal traits. In patients with metastatic CTCs, more than 80 % of CTCs co-express epithelial proteins, such as EpCAM, CKs, and E-cadherin, together with mesenchymal proteins including vimentin, N-cadherin and O-cadherin, and the stem cell marker CD133 [42]. Another study showed that 77 % of CTCs in early breast cancer patients expressed vimentin, Twist, and CK, while 100 % of CTCs expressed these proteins in patients with metastatic breast cancer. CTCs in patients with metastatic disease thus express antigens characteristic of EMT more than those with early cancer, suggesting that EMT is involved in the metastatic potential of CTCs [43].
CTCs with Mesenchymal Phenotype in Late Epithelial–Mesenchymal Transition
A recent study by Gorges et al. used the AdnaTest to detect CTCs in metastatic breast cancer patients. However, the kit failed to detect CTCs because of the downregulation of EpCAM, whereas mesenchymal markers such as Twist and epidermal growth factor receptor were upregulated, indicating that the CTCs in these patients were in the late stage of EMT. They also recognized that the late stage of EMT was associated with metastatic cancers [44].
CTCs Express Breast Cancer Stem Cell Phenotypes
Breast cancer stem cells (BCSCs) are known to have specific phenotypes, such as EpCAM+CD44+CD24−/dim or CD44+CD24−/dim. Based on the BCSC phenotype, CTCs contain 20–30 % BCSCs with the EpCAM+CD44+CD24−/dimCD45− phenotype. Other CTC phenotypes are also found in breast cancer patients, including EpCAM+CD44−CD24−/dimCD45−, EpCAM+CD44+CD24+CD45−, and EpCAM+CD44+CD24+CD45dim [26]. Theodoropoulos et al. detected CTCs in 66.7 % patients, with 35.2 % of CTCs positive for the BCSC phenotype CD44+CD24−/dim. CTCs also exhibited another BCSC phenotype aldehyde dehydrogenase 1 (ALDH1)hiCD24−/dim in 17.7 % patients [27]. Like BCSCs that are the most tumorigenic cells in solid tumors, CTCs expressing BCSC markers are also known as breast circulating tumor stem cells (CTSCs). Breast CTSCs are determined as CD45−EpCAM+CD44+CD24− cells in the blood. The percentage of CTSCs in CD45-negative cells detected by flow cytometry increased with increasing TNM stage (0, 0.00 ± 0.00 %; I, 0.03 ± 0.05 %; II, 0.06 ± 0.14 %; III, 0.10 ± 0.09 %; IV, 0.29 ± 0.35 %; P = 0.034) [28].
Notably, the expression of ALDH1 on CTCs was found to correlate with the stage of disease and with the expression of vimentin and fibronectin [45]. CTCs also express some other BCSC markers such as NOTCH1, a gene associated with self-renewing cancer stem cells [46], and almost 70 % of CTCs were found to express ALDH1 [47, 48]. Similarly to BCSCs, CTCs were also shown to be triple negative for ER, PR, and HER2 [47, 48].
Breast CTCs and HER2, ER, PR Tumor Phenotype
HER2/neu is considered as a target for breast treatment. Some studies have evaluated the correlation between HER2/neu expression in CTCs and in primary tumor cells, as well as HER2/neu expression in primary tumor cells with some specific genes in individual CTCs [48–55]. Evidence to date suggests that HER2/neu expression in CTCs does not depend strictly on HER2/neu expression in the primary tumor cells; indeed, HER2/neu-positive cells were detected in patients with HER2/neu-negative tumors [51, 54]. These results have also been confirmed by other groups [56, 57]. Punnoose et al., however, reported that there was a concordance between HER2 status in CTCs and in the primary tumor tissue in the majority of patients (89 %), though the HER2 status in CTCs differed from that in the primary tumor in a subset of patients (11 %) [58]. Thus, some patients negative for HER2/neu in the primary tumor cells may still benefit from HER-2-directed therapy [59]. Moreover, HER-2-positive CTCs were more common in women with HER-2-positive primary tumors [54].
Similarly to HER2/neu expression, ER/PR expression in CTCs does not depend on ER/PR expression in the primary tumor. Aktas et al. showed that the expression profiles of CTCs and the primary tumor differed with regard to ER/PR/HER2 positivity [47], with concordance rates of 29, 25, and 53 %, respectively [48].
Detection Methods for Breast Circulating Tumor Cells
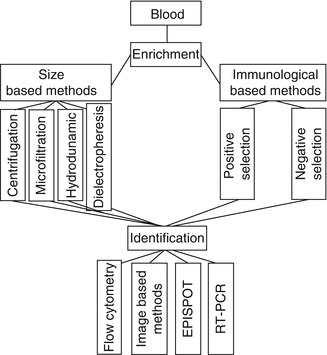
Detection of breast CTCs is an important and essential step in their use for breast cancer diagnosis and prognosis. This step determines not only the existence of CTCs but also the number of CTCs. Like many special kinds of cells, CTCs in a heterogenous population can be detected based on their unique characteristics. However, CTCs are rare cells (one CTC/106–107 mononuclear cells), and they must therefore be enriched before detection. Hence, CTC detection methods are usually composed of two steps. The initial step enriches the CTCs using morphological and immunological techniques that are nonspecific for CTCs, while the second step involves their identification using protein and nucleic acid-based techniques that are specific to CTCs.
Based on the particular proteins or/and nucleic acids (usually RNA), CTCs can be not only detected but also quantified. CTC detection results can help in the diagnosis of breast cancer, as well as tracking cancer status or drug response during treatment. The CTC isolation and detection process therefore needs to be highly specific.
Enrichment Methods
Size-Based Enrichment
As noted above, CTCs are larger than most other blood cells, and some enrichment methods have therefore utilized this size difference. Size-based enrichment strategies for CTCs include centrifugation, microfiltration, and hydrodynamic sorting. Centrifugation is the most popular method used for cell and stem cell enrichment, while microfiltration and hydrodynamic sorting are relatively new technologies.
Centrifugation
Centrifugation uses centrifugal force to separate cells based on their density. Blood cells will separate into distinct zones in the centrifugation tube according to their different densities. CTCs, leukocytes, and thrombocytes exist in the same zone called the buffy coat layer. Density gradient centrifugation using a separating medium can then be used to further separate cells within the distinct zone. Two separating media are commonly used: Ficoll (GE Healthcare) and OncoQuick (Greiner Bio-One). OncoQuick is an improved form of Ficoll that limits cross-contamination between different zones by using a porous membrane. OncoQuick has thus been shown to produce a higher recovery [60, 61].
Microfiltration
Alternatively, CTCs can be enriched using a microfiltration device [62–66]. As noted above, CTCs are mostly epithelial cells that are larger than blood cells [62, 67, 68]. Some studies have shown that a microfiltration device with a pore size of around 8 μm in diameter is optimal for CTC retention [69]. This technique initially used polycarbonate filters fabricated using track etching [70], which generates pores at random locations. However, the low pore density and multiple pore fusion led to low CTC capture efficiency (around 50–60 %) and frequent sample clogging on the filter [67, 71]. To increase the capture efficiency, improved microfabricated filters with high-density uniform circular pores were developed as 2D [21, 68] and 3D microfiltration devices [72].
Hydrodynamic Sorting
Hydrodynamic sorting uses fluid flow in combination with microdevice geometries or parallel fluids at different flow rates to sort or separate tumor cells. The main advantage of this technique is that the cells do not pass through any physical constriction and shear forces are therefore reduced. In addition, these devices typically operate at relatively high flow rates, resulting in high throughout.
Dielectrophoresis
Dielectrophoresis (DEP) is a new technique based on differences in cell polarizability and size. When an electrical field is applied to cells, they become polarized. Cells will interact with an electric field. DEP forces can be used in two ways to separate cells: DEP migration, where different types of particles migrate to different regions based on their relative polarizabilities, and DEP retention, where DEP forces are used in competition with fluid-flow forces. In the case of CTC isolation from blood, electrophoretic mobility distinguishes tumor cells in terms of their attraction toward the electrode, and normal blood cells migrate in the electrical field into an eluant.
Immunological-Based Methods
Immunological-based methods select cells based on their surface markers. Two selection methods are commonly used: positive selection and negative selection.
Positive Selection
Most CTCs originate from epithelial cells and thus express epithelial cell-specific markers such as EpCAM and CKs. These markers can be efficiently used to enrich CTCs. Some tumor-specific markers relating to specific cancers, such as alpha-fetoprotein, HER2/neu, MUC1/MUC2, mammaglobulin, and carcinoembryonic antigen, can also be used to enrich CTCs. Some approaches have combined popular epithelial cell markers and tumor-specific markers to improve the enrichment results. Two immunomagnetic methods can be used: (1) ferrous beads with anti-EpCAM that retain EpCAM-positive cells in magnetic columns (the so-called magnetic-activated cell sorting (MACS)) and (2) anti-EpCAM proteins bound in arrays to which EpCAM-positive cells can then attach.
However, as suggested, CTCs in the blood stream express a gradient of EMT markers, and some CTCs express low or no EpCAM. Immunomagnetic methods that positively select EpCAM-positive cells are therefore unable to detect them [73]. Indeed, a previous study considered that the evaluation of CTCs as prognostic markers should include both EpCAM-positive and EpCAM-negative cells [74].
Negative Selection
Most blood cells are positive for CD45, and anti-CD45 negative selection of leukocytes is thus used to enrich cell populations with CTCs that are negative for CD45. This selection technique uses antibodies labeled with magnetic microbeads and magnets. The most popular system used for negative selection is MACS (Miltenyi Biotec).
Many commercial systems currently exist for the enrichment and isolation of CTCs, such as MACS, CellSearch, RARE, AdnaTest, CTC chip, ELISPOT, MAINTRAC, Ikoniscope, and Ariol. The characteristics of these methods are summarized in Table 21.1. To increase the enrichment efficacy, some systems have combined selection by anti-CK and anti-EpCAM antibodies with CD45 depletion or with other markers.
Table 21.1
Summary of different CTC enrichment systems
Enrichment method | Principle of enrichment | Commercial systems | |
|---|---|---|---|
Size-based methods | Centrifugation | Difference in cell density | Ficoll, OncoQuick |
Filtration | Difference in cell shape | Nuclepore assay, IkoniscopeTM, Clearbridge Biomedics | |
Hydrodynamic sorting | Difference in cell density | ||
Dielectrophoresis | Difference in cell hydrodynamics | ApoCell | |
Immunological-based methods | Positive selection with tumor-specific markers | Selection of combined MUC1- and EpCAM-expressing CTCs | AdnaTest |
Depletion of CD45+ cells | Leukocytes express CD45, while CTCs do not | EPISPOT, RARE | |
Depletion of CD45+ cells and positive selection | Leukocytes express CD45, while CTCs do not, but CTCs do express CK-8,18, and 19 | CellSearchTM, CTC chip | |
Red blood cell lysis | Eliminate red blood cells to enrich nucleated cells including CTCs and leukocytes | MAINTRACTM | |
Red blood cell lysis and positive selection | Red blood cell lysis, CK- and EpCAM-antibody coupled microbeads | AriolTM | |
Positive selection with epithelial specific marker | CTCs strongly express EpCAM, while leukocytes do not | CytoScale Diagnostics, Biofluidica, On-Q-ity Inc. | |
Identification Methods
Identification is essential to confirm the cells as CTCs. CTC confirmation is usually based on specific markers expressed at the transcriptional or translational level. Nucleic acid-based methods are used at the transcriptional level, while antibody-based assays are used at the translational level. Recently, four methods have been used to identify and confirm the identity of breast CTCs, including (1) flow cytometry, (2) image-based approaches such as classic immunocytochemistry (CellSearch, Ariol system, laser scanning system), (3) protein-based assays such as ELISPOT that detect secreted proteins from CTCs, and (4) reverse transcription–polymerase chain reaction (RT-PCR) (qRT-PCR, multiplex RT-PCR).
Nucleic Acid-Based Methods
In most cases, RT-PCR or real-time RT-PCR is used to identify specific gene expression. However, there is currently no specific gene profile that can be used to confirm breast cancer CTCs. RT-PCR is commonly used to amplify and identify genes relating to EMT as well as breast cancer. Such genes may include CK19, mammaglobin-A (MGB1), HER2, and MUC1 [75–80].
Some commercial systems combine several markers to improve the results of RT-PCR. For example, AdnaTest BreastCancerSelect uses multiplex RT-PCR for HER2, MUC1, and EpCAM genes to confirm breast cancer CTCs [81]. Xi et al. showed that MGB2 was a marker of breast cancer CTCs [82]. The limited availability of CTCs means that single-cell PCR can be an ideal platform.
In addition to RT-PCR, fluorescence in situ hybridization (FISH) is also a valid method for CTC confirmation. Expression of HER2 on breast cancer CTCs evaluated by FISH showed 93 % concordance with the expression in primary breast cancer cells [83]. Using FISH, Hayashi et al. detected polysomy 17 in a small population CTCs in patients with metastatic breast cancer [84].
Cytometric-based Methods
At the translational level, CTCs can be confirmed using cytometric-based methods. In all cytometric-based methods, CTCs are stained with monoclonal antibodies specific for CTCs. There are three popular cytometric-based methods currently used for CTC confirmation: flow cytometry, image-based approaches (immunocytochemistry, fiber-optic array scanning technology (FAST), laser scanning cytometer (LSC)), and EPISPOT (epithelial immunospot).
Most cytometric-based methods use CKs and EpCAM as common markers to identify CTCs. Moreover, CD45 can also be used to detect leukocytes to increase the specificity. However, not all CTCs express CKs and EpCAM, and during EMT, CTCs may change from an epithelial phenotype expressing CKs or EpCAM to a mesenchymal phenotype with lower expression of these markers.
Flow Cytometry
Flow cytometry is a conventional method for identifying and counting CTCs. This technique has certain advantages compared with PCR, including high specificity, high statistical significance based on counting large numbers of cells in the blood, and analysis of multiple parameters including DNA content, cell size, and cell viability, as well as intracellular markers. However, it also has some limitations, particularly low sensitivity (one tumor cell/104–105 blood cells) compared with RT-PCR approaches (one tumor cell/106 blood cells) [10, 85].
Image-Based Approaches
CTCs are usually enriched and then stained with specific markers by immunocytochemical techniques to confirm their identity. This technique has been used by pathologists for decades to identify certain types of tumor cells. However, it has some limitations, including being time-consuming, and automated systems have therefore been developed to capture the stained CTCs, such as the LSC (Compucyte Corporation, Cambridge, MA), automated cellular imaging system (ACIS, Dako, Denmark), and Ariol (Applied Imaging Corp. San Jose, CA). The LSC makes it possible to scan and relocate epithelial-positive cells immunolabeled for multiple markers such as EpCAM combined with the lymphocyte marker CD45 automatically. ACIS and Ariol allow the rapid and automatic identification of CTCs based on their morphological evaluation.
Fiber-optic array scanning technology (FAST) is another, more sensitive technique for confirming CTCs. This system is equipped with an exceptionally large (50,341 mm) field of view without sacrifice of collection efficiency, which makes it possible to locate immunofluorescently labeled CTCs on glass substrates at a scan rate 500 times faster than conventional automated digital microscopy, allowing FAST to detect CTCs without the need for an enrichment procedure [86, 87]. Moreover, the process is very rapid, with up to 300,000 cells scanned per second. However, there are currently no reports of validation studies in clinical settings.
EPISPOT
EPISPOT (epithelial immunospot) is another antibody-based approach and is an immunological assay based on enzyme-linked immunosorbent assay (ELISA) technology. EPISPOT identifies CTCs by detecting specific proteins (CKs, MUC, prostate-specific antigen) secreted by them. However, one of the features of EPISPOT is that it can only detect viable CTCs, because dying CTCs do not secrete adequate amounts of proteins [88]. The sensitivity of EPISPOT is superior to that of ELISA by two orders of magnitude in terms of detecting released CK19 from cancer cells [89]. However, validation studies in clinical settings are still awaited.
Commercial Circulating Tumor Cell Detection Systems for Breast Cancer
Significant effort has recently been devoted to the development of automated techniques for detecting CTCs, and several commercial systems now exist for detecting breast cancer CTCs, including CellSearch, CTC chip, The CTChip, MagSweeper, MAINTRAC, Ariol, and AdnaTest, which combine enrichment and confirmation steps, as shown in Table 21.2. However, only CellSearch has currently been approved by the FDA for detecting breast cancer CTCs [90–92].
Table 21.2
Commercial CTC detection systems
System | Enrichment methods | Detection methods | ||
|---|---|---|---|---|
Methods | Parameters | Methods | Markers | |
CellSearch | Immunological method, magnetic cell sorting | Positive selection of EpCAM+ cells | Cytometric-based method and immunostaining, detection by automated fluorescent microscopy | CK8, 18, 19+/DAPI+/CD45- |
MagSweeper | Immunological method, magnetic cell sorting | Positive selection of EpCAM+ cells | Nucleic acid-based method: qRT-PCR | Gene expression profiling for FOXC1, KRT18, PTEN, NPTN, TGFß1, KRT8, ZEB2, and CXCR4 |
CTC chip | Immunological method, microfluids | EpCAM-coated microspots | Cytometric-based method: immunostaining | CK+/CD45-/DAPI+ |
The CTChip | Immunological method, microfluids | Microfluids, enrichment based on physical properties | Cytometric-based method: immunostaining | CK+ |
EPISPOT assay | Immunological method, magnetic cell sorting | Depletion of CD45+ cells, enrichment of CXCR4-positive cells | ELISPOT for secreted proteins | CK19, MUC1 |
MAINTRAC | Red blood cell lysis | Cytometric-based method: immunostaining; laser scanning cytometry | EpCAM+/CD45- | |
Ariol | Red blood cell lysis, magnetic cell sorting | CK+, EpCAM+ | CK8, 18, 19+/DAPI+/CD45- | |
AdnaTest | Immunological method, magnetic cell sorting | MUC1+, EpCAM+ | Nucleic acid-based methods: RT-PCR | HER2, MUC1, and EpCAM |
TelomeScan | Red blood cell lysis | Automated scan fluorescence microscopy | Detecting telomerase-specific replication-selective adenovirus expressing green fluorescent protein, the virus is able to replicate and incorporate the green fluorescent protein | |
CellSearch is used worldwide to detect breast CTCs and has been approved in more than 17 countries. This system comprises two steps: an initial step to enrich epithelial cells by selecting EpCAM-positive cells and a second step to identify epithelial carcinoma cells by double staining with CD45 and CK antibodies, using DAPI to visualize the cell nucleus. Analysis of cells using CellSearch is thus performed as follows: first, peripheral blood is mixed with iron particles coated with EpCAM to confer magnetic properties on all the epithelial cells, and then, anti-CK antibodies are used to identify these epithelial cells, while anti-CD45 antibodies are used to rule out lymphocytes; the nuclear dye DAPI is applied to fluorescently label cell nuclei for microscopic visualization of the enriched cell population. After incubation, washing, magnetic separation, and fixation, the immunomagnetically separated cell population can be viewed and counted by automated digital fluorescent microscopy [90]. CellSearch requires about 7.5 ml of blood for each analysis. Figure 21.2 shows some approaches in breast CTC enrichment and identification.
 Gynecologic Considerations for Women with Breast Cancer
In Silico Disease Models of Breast Cancer
Molecular Diagnosis of Metastasizing Breast Cancer Based Upon Liquid Biopsy
Gynecologic Considerations for Women with Breast Cancer
In Silico Disease Models of Breast Cancer
Molecular Diagnosis of Metastasizing Breast Cancer Based Upon Liquid Biopsy
 Long Noncoding RNAs in Breast Cancer: Implications for Pathogenesis, Diagnosis, and Therapy
 Breast Cancer Gene Therapy
 Exhaled Volatile Organic Compounds as Noninvasive Markers in Breast Cancer


Related posts:
Gynecologic Considerations for Women with Breast Cancer
In Silico Disease Models of Breast Cancer
Molecular Diagnosis of Metastasizing Breast Cancer Based Upon Liquid Biopsy
Long Noncoding RNAs in Breast Cancer: Implications for Pathogenesis, Diagnosis, and Therapy
Breast Cancer Gene Therapy
Exhaled Volatile Organic Compounds as Noninvasive Markers in Breast Cancer
Stay updated, free articles. Join our Telegram channel
Full access? Get Clinical Tree
