Grading
Entity
WHO I°
Pilocytic astrocytoma
Subependymal giant cell astrocytoma
WHO II°
Diffuse astrocytoma
Pleomorphic xanthoastrocytoma
Oligodendroglioma
Oligoastrocytoma
Gemistocytic astrocytoma
WHO III°
Anaplastic astrocytoma
Anaplastic oligodendroglioma
Anaplastic oligoastrocytoma
Gliomatosis cerebri
WHO IV°
Glioblastoma multiforme
Gliosarcoma
Interesting data on the biology of gliomas have been obtained by immunostaining of autopsy-derived human whole-brain sections of four patients with diffuse gliomas using a specific antibody detecting the R132H mutation of the gene encoding for isocitrate dehydrogenase 1 (IDH1) (Capper et al. 2009), illustrating that gliomas are not only diffusely infiltrating into central nervous tissue but are in fact diseases of the whole brain bearing tumour cells in macroscopically inconspicuous areas (Sahm et al. 2012).
The WHO classification of gliomas according to histological subtype and grade as predictor of malignant potential, response to treatment and survival is currently challenged by molecular findings that show a better prediction of the outcome than the histological grading alone (Tabatabai et al. 2010; Weller and Wick 2014).
Most prominently, epigenetic silencing of the DNA repair enzyme O6-methylguanine-DNA methyltransferase (MGMT) by promoter methylation in GBM cells predicts responsiveness to temozolomide chemotherapy (Esteller et al. 2000) and is an independent favourable prognostic factor irrespective of treatment (Hegi et al. 2005).
An integrated genomic analysis of GBM led to the discovery of recurrent mutations in the IDH1 gene associated with a significant increase in overall survival (Parsons et al. 2008). In a series of 382 patients with anaplastic astrocytoma (WHO III°) and GBM (WHO IV°), IDH1 mutation was the most prominent single prognostic factor followed by age, histological diagnosis and MGMT (Hartmann et al. 2010), whereas the prognostic value of IDH1 mutations in low-grade astrocytomas is rather low compared with that in high-grade gliomas (Ahmadi et al. 2012).
Common genetic alterations in tumours with an oligodendroglial component are codeletions of 1p and 19q. Two large prospective randomised trials, RTOG 9402 and EORTC 26951, independently showed that loss of 1p/19q was associated with significantly longer progression-free and overall survival (Cairncross et al. 2013; van den Bent et al. 2013).
Considering the increased impact of molecular markers on the development of treatment strategies in gliomas, the introduction of molecular markers into the next WHO classification of tumours of the nervous system will be inevitable (Weller and Wick 2014).
Especially in unresectable gliomas with limited histological material available for neuropathologic examination, multimodal-imaging-guided stereotactic biopsy correlates significantly better with cell density and proliferation marker MIB-1 labelling than targets that were chosen for biopsy based on the highest amino acid uptake in [18F]FET-PET or contrast enhancement on MRI (Gempt et al. 2014).
1.1.4 Imaging
1.1.4.1 Computed Tomography (CT)
CT information should be obtained from a contrast-enhanced, 1–2-mm, multi-slice CT, performed from the vertex to foramen magnum. Different CT windows (bones, orbit and soft tissue) should be used for the delineation of tumour and critical structures. CT could be an important additional investigation to MRI and PET for visualisation of blood/hemorrhagic tissue and soft tissue calcification or bone structures. Nowadays, target volume delineation for treatment of gliomas should no longer exclusively depend on CT imaging (Fiorentino et al. 2013). In rare cases where patients have an absolute or relative contraindication for MRI examination, e.g. all kinds of pacemakers, insulin or morphine pumps, recently implanted endoprostheses, neurostimulators, cochlear implants, granite splinters, etc., CT alone can be used for target volume delineation.
1.1.4.2 Magnetic Resonance Imaging (MRI)
Due to its outstanding contrast in soft tissue imaging and the availability of axial, sagittal and coronal 3D reconstructable datasets with a slice thickness in the range of 0.5–1.2 mm, pre- and postoperative MRI is the standard imaging modality in glioma target volume delineation and evaluation of treatment response. A standard set of MRI sequences available for glioma target volume delineation should include native and contrast-enhanced 3D-T1-weighted (e.g. MP-RAGE) sequences and thin-sliced 3D-T2-weighted sequences (e.g. fluid-attenuated inversion recovery, FLAIR, T2 SPACE).
Generally, low-grade gliomas WHO grade II are hyperintense on T2-weighted and FLAIR images and hypointense on native T1-weighted MRI. Characteristic for low-grade gliomas is the intact blood-brain barrier (BBB), and therefore no contrast enhancement is seen after intravenous application of gadolinium. However, both the T1-weighted images and the T2 sequences have considerable limitations in the precise visualisation of the gross tumour volume (GTV), especially in low-grade gliomas with diffuse infiltration. Neither on the T1- nor on the T2-weighted images precise differentiation between tumour infiltration, oedema, reactive gliosis and other treatment-related changes is possible.
High-grade gliomas WHO III and IV are characterised by contrast enhancement on T1-weighted MRI. Especially GBM shows areas of necrosis, compression of the surrounding normal tissue and sometimes midline deviation. Tumour-surrounding oedema cannot be differentiated from non-contrast enhancement tumour areas.
In summary, in low- and high-grade gliomas, conventional MRI shows a high sensitivity for the diagnosis of a brain tumour but a low specificity concerning the histology of the tumour tissue. Moreover, traditional MRI is unable to differentiate between tumour and oedema or treatment-related changes. Therefore, the traditional MRI alone does not offer the information necessary for accurate delineation of tumour margins in brain gliomas.
Advances in MRI can provide significant information about the biology of low- and high-grade gliomas and will be used in the future as bio-imaging/biomarkers for the development of improved treatment strategies. There are recent data showing that new MRI techniques are able to detect subtle changes in white matter organisation (diffusion tensor imaging), cellular proliferation (diffusion MRI and MR spectroscopy) or angiogenesis (perfusion MRI) (Price and Gillard 2011). Stadlbauer et al. (2011) used MR spectroscopy for the visualisation of the infiltration zone of gliomas. In 20 patients, they compared the proton-MRI spectroscopy data with the results of stereotactic biopsies and postulated that the method for automated segmentation of the lesion-related metabolic changes significantly improved tumour delineation in brain gliomas compared to traditional methods.
1.1.4.3 Positron Emission Tomography (PET)
Although MRI accurately depicts the anatomy of the brain, neither contrast enhancement in T1-weighted images nor hyperintensity in T2-weighted images is a specific surrogate for neoplastic lesions. Moreover, after intensive multimodality treatment of glioma, it has been realised that effects like pseudo-progression or pseudo-remission may occur, challenging the predominant role of MRI for visualisation of tumour tissue during follow-up (Brandsma et al. 2008).
Mitotically active glioma cells are characterised by increased metabolism (glycolysis, protein synthesis, DNA synthesis; Demetriades et al. 2014), and therefore, imaging of biological and molecular tumour characteristics by PET is an emerging approach to improve the visualisation of actual tumour extent and for radiotherapy treatment planning (Chen 2007; Weber et al. 2008; Grosu and Weber 2010; Götz et al. 2012).
The most widely used PET tracer in oncology is [18F]fluorodeoxyglucose (FDG). In the context of malignant glioma, [18F]FDG-PET was found to be of limited value for GTV delineation, due to the low contrast between healthy brain tissue and tumour (Gross et al. 1998). Amino acid PET has been shown to have a higher sensitivity and specificity, even in comparison to MRI (Grosu and Weber 2010).
Indeed, target volume delineation of malignant glioma can differ significantly between MRI and [11C]methionine (MET)-PET (Grosu et al. 2005a). On the PET/MRI co-registered images, MET uptake on PET and gadolinium enhancement on T1-MRI were detected in all 39 patients (100 %). In 5 patients (13 %), MET uptake matched exactly with the gadolinium enhancement on T1-MRI. However, in 29 patients (74 %), MET uptake was also located outside the gadolinium enhancement on MRI, showing additional areas of tumour infiltration. Moreover, in 27 patients (69 %), gadolinium enhancement was also located outside the MET enhancement on PET, showing that gadolinium actually correlates with post-surgery BBB disturbances and not with tumour tissue. Evaluating the hyperintensity area on T2-MRI in comparison to MET uptake on PET, it was observed that the extension of MET uptake was different from the hyperintensity areas. MET uptake was located also outside of the hyperintensity area in 9 of 18 patients (50 %), suggesting tumour tissue, and in 100 %, the hyperintensity region on T2-weighted MRI extended beyond the MET enhancement area, suggesting post-surgery or tumour-related oedema. These findings could have a significant impact in the development of new recommendations for target volume delineation in gliomas, based on PET.
Lee et al. (2009) evaluated the association between MET uptake on PET and the site of failure after radiochemotherapy of GBM. They found that 19/26 patients had a significant (>1 cm3) volume delineated by PET (GTV-PET). Five of 19 patients had PET-GTV that was not completely included within the high-dose area, and all the 5 showed noncentral failures (not located in high-dose area). In the group of patients with adequately covered PET-GTV (14/19), only 2 developed a noncentral treatment failure. The authors concluded that inadequate PET-GTV coverage was associated with increased risk of noncentral failure (p < 0.01).
The short half-life of [11C]MET, however, requires the presence of an on-site cyclotron. A tracer with a much longer half-life is [18F]fluoroethyl-l-tyrosine (FET), which has later been shown to equally detect biologically active tumour compared to [11C]MET-PET acquired on the same day (Grosu et al. 2011). The impact of PET-based radiation treatment planning on the outcome of patients with recurrent high-grade gliomas treated with fractionated stereotactic radiotherapy was evaluated in a prospective single-institution trial (Grosu et al. 2005b). The median overall survival was 5 months when treatment planning was based on MRI/CT compared with 9 months when target volume was delineated on amino acid PET and MRI/CT (p = 0.03). These data suggest that amino acid PET could have a significant impact on patient outcome. The potential clinical benefit of [18F]FET-PET-based target volume delineation compared to MRI for re-irradiation of recurrent GBM is currently under investigation in a prospective multicentric phase II randomised trial (GLIAA NOA10/ARO 2013-01).
1.1.5 Target Volume Delineation and Radiation Treatment Planning in Gliomas
1.1.5.1 Low-Grade Gliomas (WHO II)
Gross tumour volume (GTV) delineation in low-grade gliomas (oligodendrogliomas, oligoastrocytomas and astrocytomas WHO grade II) is based generally on T2-weighted and FLAIR MRI images (Table 1.2, Shaw et al. 2012; Fairchild et al. 2012; Musat et al. 2010), considering that an important characteristic of these tumours is the absence of contrast enhancement on T1-weighted MRIs. However, it is well known that the sensitivity of T2 and FLAIR MRI for tumour tissue is very high, but the specificity is relatively low. Thus, tumour tissue cannot be differentiated from surrounding oedema or treatment-related changes (e.g. tissue injury after surgery). Therefore, the problem remains that in non-operated low-grade gliomas, the GTV delineated based on T2-weighted and/or FLAIR MRI could encompass not only tumour tissue but also oedematous normal brain tissue. Additionally, in operated patients, the GTV could include close to residual tumour non-tumoural tissue with hyperintense signal on T2 and FLAIR, e.g. post-surgery gliosis and oedema. After complete tumour resection, the concept of GTV encompassing the resection cavity – as used generally in different trials and publications – is not in line with the ICRU Criteria for GTV definition: the resection cavity should be included in the clinical target volume (CTV) and not in the GTV definition.
Table 1.2
EORTC and RTOG randomised phase III multicentric studies evaluating the impact of radiotherapy and chemotherapy in low-grade gliomas (WHO II): GTV, CTV and PTV definition
Trial | Irradiation dose | GTV | CTV | PTV | References |
|---|---|---|---|---|---|
EORTC 22033-26033/CE5 | 50.4/1.8 Gy (28 fx) | Region of high signal intensity on T2 or FLAIR MRI corresponding to the hypodense area on CT, including any areas of CT enhancement, or surgical cavity + any residual tumour | GTV + 1–1.5 cm | CTV + 5–7 mm | Fairchild et al. (2012) Musat et al. (2010) |
RTOG 9802 | 54/1.8 Gy (30 fx) | T2 or FLAIR MRI-defined tumour volume | Not defined s. PTV | GTV + ca. 1 cma | Shaw et al. (2012) |
The CTV encompasses the possible microscopic tumour infiltration, including the resection cavity (in operated patients) and the surrounding normal appearing tissue in an area of 5–15 mm, excluding anatomical borders like the falx, skull, liquor areas, etc. (Fairchild et al. 2012). In our institution, we make the distinction between well-delineated low-grade gliomas, in which the margins from GTV to CTV are ca. 5 mm, and diffuse infiltrative low-grade gliomas, in which the distance from GTV to CTV should be larger (ca. 10–15 mm), considering anatomical borders (Fig. 1.1).
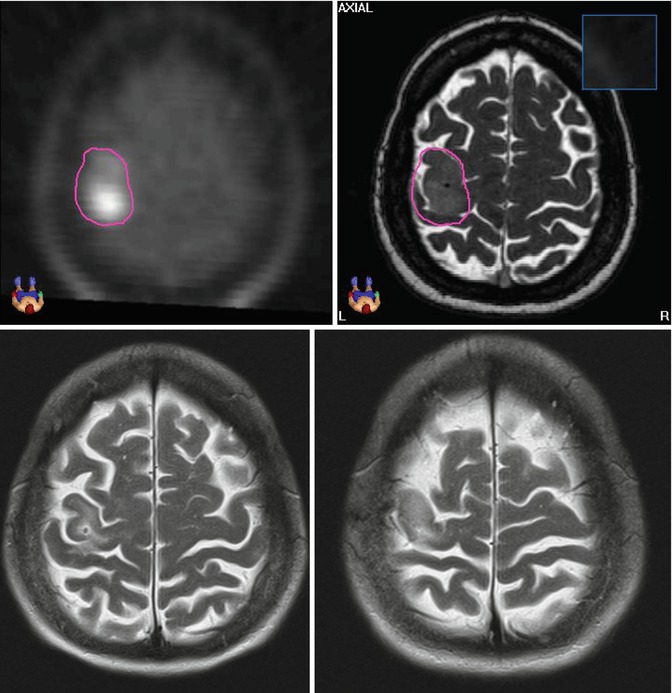
Fig. 1.1
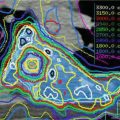
Astrocytoma WHO grade II in a 54-year-old female patient with seizures treated with stereotactic fractionated radiotherapy (2002; total dose 54, 1.8 Gy per fraction). The GTV was delineated based on the MET-PET/T2-MRI image fusion (upper pictures). Due to the non-infiltrative pattern of tumour growth, the CTV was defined as 3-mm margin from GTV. The PTV was CTV plus 2 mm. The pictures below show the T2-MRI 10 years after treatment (2012), showing partial tumour remission. The patient showed also complete remission of the neurological symptoms (Department of Radiation Oncology, Technical University of Munich, Germany)
We generally recommend the co-registration of pre- and post-surgery MRI/CT images. The pre-surgery GTV can contribute significant information about the possible microscopic tumour infiltration (CTV). However, in this case, the possible changes of the brain anatomy after surgery should be taken in consideration.
The planning target volume (PTV) should be defined considering the precision of patient positioning in each institution. In low-grade gliomas, high-precision radiation therapy is mandatory. Stereotactic techniques and/or image-guided radiotherapy is needed to reduce the distance between CTV and PTV to 1–3 mm.
Summarising, the target volume delineation for high-precision radiation therapy in low-grade gliomas is based on T2-weighted and FLAIR MRI. Because of the relatively low specificity of these MRI sequences for tumour tissue, new imaging methods for a higher precision in GTV delineation are needed.
For radiation treatment planning, intensity-modulated radiotherapy combined with stereotactic radiotherapy and/or image-guided radiotherapy should be considered. Multiple fields including vertex fields or combined dynamic arcs should be used to achieve a high conformity index. However, the dose to the thyroid gland, spinal cord and total body should be minimised (Fairchild et al. 2012). The total dose recommended in low-grade gliomas ranges between 50.4 and 54 Gy (Fairchild et al. 2012; Shaw et al. 2012) in 1.8 Gy/day, 5 days/week.
The results of the RTOG (Shaw et al. 2002) and EORTC (Karim et al. 1996; van den Bent et al. 2005) studies, in which the target volume was delineated based on the hypodense area on CT, showed 52–55 % progression-free survival 5 years after radiation therapy. The local recurrence was located in the irradiation field in more than 90 % of patients. The real impact of MRI in comparison to CT for target delineation on the clinical outcome was not evaluated systematically – this could be an interesting question for the more recent RTOG and EORTC trials (Whitfield et al. 2014).
1.1.5.2 High-Grade Gliomas WHO III
Describing target volume delineation for WHO grade III gliomas, Whitfield et al. (2014) mentioned two radiological patterns of such tumours:
1.
WHO grade III gliomas that have the radiological characteristics of GBM. These might best be treated based on T1-MRI with gadolinium (see Sect. 5.3).
2.
WHO grade III gliomas with low or lack of contrast enhancement on T1-MRI. In these tumours, the GTV should encompass the Gd-T1-MRI plus the hyperintensity area on T2/FLAIR. The CTV should include the GTV plus 1.0–1.5 cm.
Even though, as the authors comment, there is no hard evidence for this strategy, it is well supported by clinical experience. In aggressive high-grade gliomas (group 1), like in GBM, recurrences occurred in more than 90 % in the contrast enhancement area. In a significant number of patients, hyperintensity on T2 is due to oedema, and oedema is a consequence of tumour compression and not of macroscopic tumour invasion (s. amino acid PET data, Sect. 4.3). Therefore, T1-MRI and not T2/FLAIR should be used for GTV delineation. On the other side, in WHO grade III gliomas arising from previous low-grade gliomas (group 2), the regional malignant transformation in small islands is a frequent pathological characteristic. Moreover, oedema due to tumour compression is smaller or absent. Therefore, the T2/FLAIR sequences should be included in target volume delineation because changes in T2/FLAIR are related to tumour invasion. This concept was generally followed also by the EORTC and RTOG clinical trials, like what is presented in Table 1.3.
Table 1.3
EORTC and RTOG randomised phase III multicentric studies evaluating the impact of radiotherapy and chemotherapy in high-grade gliomas (WHO III): GTV, CTV and PTV definition
Trial | Histology | Irradiation dose | GTV | CTV | PTV | References |
|---|---|---|---|---|---|---|
RTOG 9402 | WHO III° AOA, AO | After complete resection: 50.4/1.8 Gy + boost 9 Gy/1.8 Gy | Surgical cavity and T2 abnormality | Not defined (considered in PTV) | GTV + 2 cm, boost: GTV +1 cm | Cairncross et al. (2013) |
After biopsy/incomplete resection: 50.4/1.8 Gy + boost 9/1.8 Gy | Contrast enhancement on T1 and T2 abnormality | Not defined (considered in PTV) | GTV +2 cm, boost: T1 abnormality + 1 cm | |||
EORTC 26951 | WHO III° AOA, AO | PTV-1: 45/1.8 Gy PTV-2: 14.4/1.8 Gy | Low-density area on preoperative CT and/or the hyperintensity area on preoperative T2-MRI | Not defined (considered in PTV) | PTV-1: GTV + 2.5 cm PTV-2: GTV + 1.5 cm | van den Bent et al. (2013) |
CATNON EORTC 26053/22054 | WHO III° glioma | 59.4/1.8 Gy | Surgical cavity + contrast-enhancing T1 abnormality + T2/FLAIR abnormality | GTV + 1.5–2 cm | CTV + 5–7 mm | |
NOA 4 | WHO III° AA, AOA, AO | 59.4–60/1.8 Gy | Preoperative MRI/CT | Not defined (considered in PTV) | GTV + 2 cm | Wick et al. (2009) |
In our opinion, we have to keep in mind that, fortunately, the prognosis in a significant number of these patients might be favourable. Therefore, we have to put a lot of effort in sparing normal brain tissue to avoid late side effects after radiotherapy. We recommend using additional information from amino acid PET (if available; Fig. 1.2) and pre-surgery MRI/CT for GTV and CTV delineation. Anatomical borders should also be considered. Stereotactic fixation and image-guided radiotherapy could help to reduce the distance from CTV to PTV to 1–2 mm.
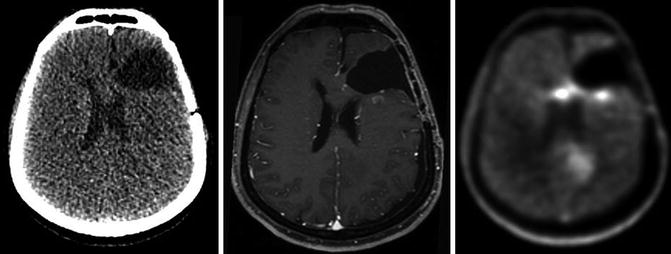
Fig. 1.2
CT, GdT1-MRI and FET-PET in a patient with high-grade astrocytoma (WHO III) after surgery. The FET-PET images offer additional information concerning residual tumour location
The total dose should be 59.4 Gy in 1.8 Gy/day, 5×/week. The delivery of a lower dose (45–50.4 Gy) to a larger PTV (based on T2-MRI/FLAIR) and a higher dose to the boost region (based on GdT1-MRI) is in many cases a good concept, sparing more normal brain tissue (Table 1.3).
1.1.5.3 High-Grade Gliomas WHO IV: Glioblastoma Multiforme
In GBM (WHO IV°), a GTV to CTV margin of even 2 cm is the standard (Hochberg and Pruitt 1980; Wallner et al. 1989). It should be noted that despite the local treatment approach, diffuse glioma represents a systemic brain disease upon diagnosis (Sahm et al. 2012). This fact might explain the limited, if any, role of dose escalation beyond 60 Gy, which was demonstrated in numerous studies. However, the impact of dose escalation might become clinically apparent if clear definition of a biologically relevant subvolume or molecular disease feature allows for targeted dose escalation to the right volume in the right patient (Nieder and Mehta 2011).
In GBM, T2/FLAIR sequences often show oedema surrounding the tumour, suspicious of subclinical tumour cell infiltration. However, for GBM it has been shown that inclusion of this oedema in the GTV leads to significantly larger irradiation volumes and doses to the whole brain compared to a standard GTV to CTV margin of 2 cm without inclusion of oedema, but does not alter the central pattern of failure (Chang et al. 2007). Therefore, GdT1-MRI sequences should be the basis for GTV delineation in GBM (Fig. 1.3). Excluding peritumoural oedema may permit a significant reduction of irradiated brain volume, but safety, efficacy and reduction in treatment-related neurotoxicity have not been demonstrated in prospective, randomised trials yet (Minniti et al. 2010). Different strategies for target volume delineation in GBM are presented in Table 1.4.
Fig. 1.3
A 49-year-old male patient with GBM. From left to right: Preoperative contrast-enhanced T1 and FLAIR MRI and postoperative contrast-enhanced T1 and FLAIR MRI sequences. Corresponding radiotherapy treatment plan: yellow 95 % isodose, green 80 % isodose, light blue 50 % isodose and dark blue 30 % isodose
Table 1.4
EORTC and RTOG randomised phase III multicentric studies evaluating the impact of radiotherapy and chemotherapy in glioblastoma (GBM, WHO IV): GTV, CTV and PTV definition
Trial | Irradiation dose | GTV | CTV | PTV | References |
|---|---|---|---|---|---|
EORTC 22981/26981/ NCIC CE3, BO21990 | 60/2 Gy | Surgical cavity + contrast-enhancing T1 abnormality | GTV + 2–3 cm | Not defined | Stupp et al. (2005) Chinot et al. (2014) |
RTOG 0825 | PTV1: 46/2 Gy PTV2: 14/2 Gy | GTV1: surgical cavity + T1 contrast-enhancing abnormality + T2/FLAIR abnormality GTV2: surgical cavity + T1 contrast-enhancing abnormality | CTV1: GTV1 + 2–2.5 cm CTV2: GTV2 + 2 cm | PTV1: CTV1 + 3–5 mm PTV2: CTV2 + 3–5 mm | Gilbert (2014) |
Like in other gliomas, amino acid PET and pre-surgery MRI/CT should be co-registered with the planning imaging and considered in the GTV and CTV delineation.
1.1.5.4 Recurrent Gliomas
Summarising the data from the literature about re-irradiation in high-grade gliomas, we found a significant number of studies (14 included in a previous review) evaluating 300 patients with GBM. Six months progression-free survival was 28–39 %, 1-year survival was 18–48 % without additional chemotherapy (two studies: topotecan and CCNU), and the median value for 1-year survival rate was 26 % (Nieder et al. 2008). These are encouraging results considering the relatively low rate of serious side effects if the total re-irradiation dose remains lower than 30–40 Gy in 2–5 Gy/fraction (Mayer and Sminia 2008). However, systematic randomised trials are needed to fully elucidate the role of re-irradiation. Ryu et al. (2014) recently reported class III evidence confirming that re-irradiation can be safely given for progressive GBM. Generally, the GTV encompasses the contrast enhancement on GdT1-MRI with a small margin of 3–5 mm to CTV. Re-irradiation should be performed using high-precision radiation therapy (stereotactic radiotherapy, image-guided radiotherapy). Therefore, the typical distance from CTV to PTV is small, e.g. 1–3 mm (see also Sect. 4.3) (Grosu et al. 2005b).
1.1.5.5 Organs at Risk
The organs at risk that should also be delineated include the eyes, lenses, optic nerves, optic chiasm, inner ears, brainstem, pituitary gland and hypothalamus. Additionally, the volume of the whole brain should be contoured to be able to evaluate the mean brain dose. Many centres also delineate the hippocampi to estimate the risk of neurocognitive decline and to be able to spare these structures as much as possible by using IMRT, if applicable (Table 1.5).
Table 1.5
Tolerance doses for intracranial organs
Organ | Volume | Volume max | Max point dose | Clinical endpoint/toxicity ≥grade 3 | References |
|---|---|---|---|---|---|
Brain | 1/3 | TD5/5: 60 Gy TD50/5: 75 Gy | n.a. | Necrosis infarction | Emami et al. (1991) |
2/3 | TD5/5: 50 Gy TD50/5: 65 Gy | n.a. | Necrosis infarction | ||
3/3 | TD5/5: 45 Gy TD50/5: 60 Gy | n.a. | Necrosis infarction | ||
1/3 | TD5/5: 72 Gy | n.a. | Necrosis infarction | Lawrence et al. (2010) | |
Optic nerves and chiasm | 1/3 | TD5/5: 50 Gy TD50/5: 65 Gy | n.a. | Visual impairment | Emami et al. (1991) |
2/3 | TD5/5: 50 Gy TD50/5: 65 Gy | n.a. | Visual impairment | ||
3/3 | TD5/5: 50 Gy TD50/5: 65 Gy | n.a. | Visual impairment | ||
n.a. | n.a. | 55 Gy | Visual impairment | Mayo et al. (2010) | |
Brainstem | n.a. | n.a. | ≤54 Gy | Neuropathy | Daly et al. (2007) |
<1 ml | 55 Gy | n.a. | Neuropathy | Schoenfeld et al. (2008) | |
1/3 | TD5/5: 60 Gy TD50/5: 75 Gy | n.a. | Neuropathy | Emami et al. (1991) | |
2/3 | TD5/5: 53 Gy TD50/5: 70 Gy | n.a. | Neuropathy | ||
3/3 | TD5/5: 50 Gy TD50/5: 65 Gy | n.a. | Neuropathy | ||
Retinae | 1/3 | TD5/5: 45 Gy TD50/5: 65 Gy | n.a. | Blindness | Emami et al. (1991) |
2/3 | TD5/5: 45 Gy TD50/5: 65 Gy | n.a. | Blindness | ||
3/3 | TD5/5: 45 Gy
Related posts:Stay updated, free articles. Join our Telegram channel
Full access? Get Clinical Tree
 Get Clinical Tree app for offline access

|