Highlights
- •
The carcinogenic pathways of heavy metals/ trace elements in bladder cancer are studied.
- •
They include alterations in MD, OS/ROS, and p38-MAPK pathway.
- •
This data provides a promising gateway for selective BC preventive and treatment strategies.
Abstract
Objective
Carcinogenic mechanisms of heavy metals/ trace elements (HMTE) in bladder cancer (BC) are exactly unknown. Mitochondrial dysfunction (MD), oxidative stress (OS), and mitogen-activated protein kinases (MAPK) are probable carcinogenic mechanisms. The purpose is to investigate probable carcinogenic pathways of HMTE in BC using six MD genes, seven OS markers, and p38-MAPK.
Methods
Study included 125 BC/radical cystectomy (RC) patients between October 2020 and October 2022, and 72 controls. Exclusion criteria included previous neoplasm, chemo- or radiotherapy. Two samples (cancer/noncancer) were taken from RC specimens. Tissues/plasma/urine cadmium (Cd), lead (Pb), cobalt (Co), nickel (Ni), strontium (Sr), aluminium (Al), zinc (Zn), boron (B) were measured by ICP-OES. Tissue MD genes (mt-CO3, mt-CYB, mt-ATP 6, mt-ATP8, mt-CO1, mt-ND1), and serum OS markers (8-OHdG, MDA, 3-NT, AGEs, AOPP, ROS, SOD2), p38-MAPK were assessed by RT-PCR, and ELISA, respectively.
Results
BC and adjacent tissue showed higher (Al, Co, Pb, Ni, Zn, Cd,Sr), lower B concentrations, compared to controls. High tissue concentrations (Cd, Co, Pb, Ni, Sr) were associated with higher MD genes, OS, MAPK and lower SOD2 levels. The same differences were greater in 41 patients with concomitant elevation of two or more HMTE. Noninclusion of BC-related oncogenes (e.g. RAS) is a limitation.
Conclusions
Evidence suggests that high BC tissue (Cd, Co, Pb, Ni, Si) concentrations are associated with over-expressed MD genes, OS, p38-MAPK and low SOD2. These findings provide important understanding keys of probable carcinogenic pathways in BC associated with HMTE. So, efforts should be performed to minimize and counteract exposure to toxic HMTE.
1
Introduction
Bladder cancer (BC) is the 10 th commonest neoplasm and the 13 th commonest cause of cancer death, worldwide [ ]. BC risk factors include smoking, carcinogens (occupational) exposure, chronic infection/ inflammation, and others [ , ]. With increasing industrialization, the long-term harms of HMTE on human health, including cancer, have increased, as a result of the cumulative exposure due to various activities [ ]. The latter include car, antiseptics, self-cleaning ovens, plastic, solar panel, mobile phone, glass, dye, textile, paper, metal refining and adhesives, mining, pesticide, ammunition, battery and other industries. Toxic metal contamination may occur in water, air, and food [ ].
According to International agency for Research on Cancer (IARC), arsenic (As), cadmium (Cd), chromium (Cr), strontium (Sr), and nickel (Ni) are grouped as carcinogens, and cobalt (Co) as “possibly” carcinogenic [ ]. In addition, the U.S. Environmental Protection Agency (EPA) has classified lead (Pb) as probable carcinogen [ ].
The role of HMTE in BC has been scarcely investigated [ ]. In a previous study, increased tissue levels of As, Pb, aluminum (Al), Cd, zinc (Zn), Sr, Cr, boron (B), and Ni were reported in BC [ ]. The specific mutagenic and carcinogenic mechanisms of HMTE in cancer, including BC, are exactly unknown. However, toxicogenomic with abnormal genomic alteration, DNA synthesis or gene expression and toxicoepigenetic pathways, such as DNA methylation, and miRNA regulation, have been proposed [ ]. The HMTE-induced cytotoxic molecular pathways include oxidative stress (OS) associated with mitochondrial dysfunction (MD), apoptosis, necrosis, and other interconnected pathways [ ].
OS and MD have been investigated in few researches, as probable factors in cancer formation and progression [ ]. MD, including mitochondrial DNA mutations, altered energy production of the tricarboxylic acid (TCA) cycle and oxidative phosphorylation (OXPHOS), and retrograde signaling pathway, may be involved in tumor formation, progression, invasion, metastasis, angiogenesis, immunity, and resistance to treatment [ , ]. The probable carcinogenic mechanisms of OS and reactive oxygen species (ROS) include stimulated proliferation, decreased apoptosis, migration, altered gene and DNA damage [ , ].
Human mitochondrial DNA (mtDNA) consists of a circular genome with 37 genes, important for the protein synthesis of electron transport chain (ETC) and OXPHOS [ ]. These proteins include mtDNA-encoded NADH dehydrogenase (mt-ND) of complex I, cytochrome b (mt-CYB) of complex III, cytochrome c oxidase with its three subunits (mt-COI, mt-COII, and mt-COIII) of complex IV, and mt-adenosine triphosphatase 6 and 8 (mt-ATPase 6, mt-ATPase 8) of complex V [ ]. MD, resulting from either abnormal enzymes of the TCA cycle, mutations in mtDNA, defects in ETC, OS, or other factors, was noted in some cancers [ ]. Changes in mtDNA and OS/ROS are the most common biomarkers to investigate MD [ ].
Activation of the mitogen-activated protein kinase (MAPK) pathway, due to various environmental pollutants, including HMTE, OS/ROS, stimulates the RAS oncogene with subsequent carcinogenic cascades [ ].
So, MD, OS/ROS, and MAPK can be induced by HMTE and are probable carcinogenic factors in cancer, in general. Is there a role for these pathways in BC? This is the question of the ongoing research.
Therefore, we conducted this study to investigate these pathways in BC associated with elevated HMTE, using 6 genes of MD (mt-CO3, mt-CYB, mt-ATP 6, mt-ATP8, mt-CO1, mt-ND1), seven OS markers, namely human 8 hydroxy deoxyguanosine (8-OHdG), malondialdehyde (MDA), nitrotyrosine (3-NT), advanced glycation end product (AGEs), advanced oxidation protein products (AOPP), reactive oxygen species (ROS), mitochondrial superoxide dismutase (SOD2), and p38-MAPK.
2
Subjects and methods
2.1
Subjects
After Institutional Review Board approval (RP.20.12.88; MS.23.02.2303) and obtaining written consent, this research was conducted between October 2020 and October 2023. It included 125 BC patients who underwent RC (99 males/26 females), and 72 controls (45 males/ 27 females), with a mean age ± standard deviation (SD) 63.8 ± 8.2 and 45.7 ± 8.6 years, respectively. BC patients included 26 farmers, 10 painters, 25 workers in textile, dye, glass, petroleum, batteries, plastics, metal refining, barbershop and 64 others with limited exposure to HMTE. Smoking (ex/current) was noted in 72 patients. Exclusion criteria included history of previous neoplasm, chemo- or radiation therapy.
The controls included 51 age and sex matched normal individuals, from whom plasma and urine samples for HMTE and serum samples for OS and p38-MAPK marker assessment were taken. In addition, control bladder tissue samples were taken from 21 patients without BC, and used for comparison, regarding HMTE and MD gene. The latter patients included those subjected to ureteroneocystostomy or bladder augmentation.
3
Methods
In the 125 patients with BC, 2 fresh samples were taken from cancer and noncancerous tissues of RC specimens that were later histologically proven and each was divided into 2 parts for HMTE and MD gene assessment [ ]. The remaining specimen was histopathologically examined for cell type, stage, grade and lymph node (LN).
3.1
Collection, processing, and digestion of HMTE plasma and urine samples
A 5-mL venous blood sample was taken in a pro-coagulation tube, 1 day before RC from BC patients, and the controls, kept at room temperature for 15 minutes, centrifuged at 4000 rpm for 10 minutes, and the plasma part was separated. A 20-mL of the patient urine in the early morning on the day of RC, and similar samples from the controls were collected in aliquot tubes. A mixture of 1-mL plasma or 2-mL urine and 3-mL of nitric acid (HNO3) and 1 ml of hydrogen peroxide (H2O2) is made and kept at room temperature for 15 minutes. The digestion was conducted by a microwave (Speed wave four, Berghof Products, Germany). After cooling, de-iodinised water was added to the digested sample up to 10-mL level.
3.2
Digestion of HMTE tissue samples
In BC patients and controls, the tissue samples were washed with distilled water, dried for 24 hours in a vacuum oven at 108°C, and then weighed and digested using a special microwave. Thereafter, an amount of hydrochloric and nitric acid (8 and 2 ml, respectively) was added to about a quarter of a gram of each sample, followed by heating up the mixture to 180°C with pressure for 30 min. In a 50-ml volumetric flask, the resulting solution was put and filled up to the mark using de-ionized water [ ].
3.3
HMTE measurement
The HMTE studied include Cd, Pb, Co, Ni, Sr, Al, Zn and B. HMTE were measured by the inductively coupled plasma optic emission spectrometry (iCAP™ 7400 ICP-OES Analyzer, ThermoFisher Scientific, Bremen, Germany). The tissue and plasma/urine concentrations of HMTE were usually reported in mg per kg and in microgram per liter (Ug/L), respectively and their limit of detection (LOD) were reported before [ , ]. Levels below LOD were stated as zero.
3.4
MD genes evaluation
The investigated MD genes included (mt-CO3, mt-CYB, mt-ATP 6, mt-ATP8, mt-CO1, mt-ND1). The genes were assessed by real-time quantitative polymerase chain reaction (RT-PCR). They were measured 3 times and an average was taken.
3.5
Total RNA extraction (mRNA)
RNA extraction from bladder tissue (cancerous, adjacent noncancerous and controls) was performed using miRNeasy Mini Kit (Cat. No. 217004, Qiagen, Hilden, Germany).
3.6
Convertion of RNA to cDNA
Thermal cycler PCR System (GeneAmp®PCR System 9700, Applied Biosystem, USA) was used for conversion of total RNA into complementary DNA (cDNA) with miRCURY LNA miRNA PCR Starter Kit (Cat. No. 339320, Qiagen) and QuantiNova Reverse Transcription Kit (Cat. No. 205411, Qiagen), according to manufacturer guidelines.
3.7
Quantitative RT-PCR for mRNA
The mRNAs of the investigated genes and the housekeeping gene GADPH (internal control) were evaluated by QuantiNova® SYBR® Green PCR KIT (Cat. No. 208052, Qiagen), QuantiNova LNA Primer Assays and Step one plus RT-PCR (Applied Biosystems). The equation ( RQ = 2 -ΔΔCT ) of the Leviak {the 2(-Delta Delta C(T)} method was used to analyze the relative gene quantification (RQ) [ ].
3.8
Evaluation of OS and MAPK markers
Enzyme-linked immunosorbent assay (ELISA) was used to measure these markers in the serum of patients and controls, where 3 measurements were conducted and an average was made. The markers included 8-OHdG, a marker of oxidative DNA damage, MDA, a marker of peroxidation (OS) of polyunsaturated fatty acids, 3-NT, a marker of protein oxidative/nitrative damage, AGEs, a marker of damage cell lipids and proteins, AOPP, a marker of protein oxidation, ROS, a major OS biomarker, SOD2, a mitochondrial antioxidant marker and p38-MAPK.
3.9
Statistical analysis
The software SPSS statistical package, version 21 (IBM SPSS Statistics) was used. Kolmogorov-Smirnov test was used to check the numerical data for normal versus non-normal distribution. Non-normally distributed variables were shown as median (interquartile range-IQR). Mann-Whitney and Kruskall-Wallis tests were used for comparison between groups with noncontinuous numerical data. Multiple tests, including Pearson’s, Kendall’s and Spearman’s test, were used for correlation among tissue, plasma and urine HMTE, in order to avoid type I error. ROC curve was plotted when indicated.
4
Results
Of the 125 BC patients, the histology was UC in 113, squamous cell carcinoma in seven and adenocarcinoma in 5; stage was pT1, pT2, pT3, pT4 in 16, 29, 62 and 18 cases, respectively; grade was G1 in 5, G2 in 35, G3 in 85 and LNs were positive in 27 cases.
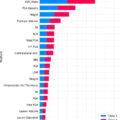
In the control, the concentrations of Al, Co, Pb and Ni were lower and that of B was higher than in BC tissue, while those of Zn, Cd and Sr were lower than in adjacent noncancerous tissue ( Table 1 ). The plasma and urine concentrations of (Al, Cd, Co,Ni) and (Cd, Pb, Ni, Sr) were higher in BC patients than the controls, respectively ( Table 1 ). Contrariwise, the urine B concentration was lower in BC patients ( Table 1 ).
| Parameter: Mean; Mdn (range) | Cancerous tissue# | Adjacent noncancerous tissue | controls | P value |
|---|---|---|---|---|
| Al: | ||||
| -Tissue (mg/kg) | 11.2;12.1 (0–24.3) | 18.4;1.9 (0–208.5) | 9.7;9.3 (5–17) | 0.001 ⁎ ;0.06 ⁎⁎ |
| -Plasma (ug/L) | 41.8;18.7 (2–218) | – | 5.4;4.9 (2–14.7) | < 0.001 |
| -Urine (ug/L) | 23.2;14.8 (0–94) | 14.9;13.1 (4.9–29.9) | 0.34 | |
| B: | ||||
| -Tissue (mg/kg) | 0.19;0 (0–1.98) | 0.14;0 (0–1.1) | 0.26;0.26 (0.12–0.4) | < 0.001 ⁎⁎ ; ^ |
| -Plasma (ug/L) | 31.7;0 (0–543) | – | 19.8;26 (0–44) | 0.27 |
| -Urine (ug/L) | 256;167 (0–904) | 447;481 (0–1149) | 0.001 | |
| Zn: | ||||
| -Tissue (mg/kg) | 25.5;21.1 (5.3–92.4) | 32.5;31.7 (12.6–87) | 22;19.4 (9.6–52) | 0.004 ⁎ ; 0.006 ^ |
| -Plasma (ug/L) | 891;932 (139–1394) | – | 822;825 (230–1241) | 0.16 |
| -Urine (ug/L) | 591;597 (110–1150) | 520;468 (201–1154) | 0.057 | |
| Cd: | ||||
| -Tissue (mg/kg) | 0.11;0.05 (0–2.2) | 0.12;0.09 (0–0.7) | 0.05;0.03 (0–0.26) | 0.004; 0.006 ^ |
| -Plasma (ug/L) | 2;1.9 (0–8.2) | – | 0.51;0.35 (0–1.8) | < 0.001 |
| -Urine (ug/L) | 6.9;5 (0–31) | 0.42;0.15 (0.08–1.1) | < 0.001 | |
| Co: | ||||
| -Tissue (mg/kg) | 0.04;0.02 (0–0.28) | 0.02;0 (0–0.14) | 0.01;0.01 (0–0.03) | 0.01 ⁎ ;0.046 ⁎⁎ |
| -Plasma (ug/L) | 0.38;0.02(0–6.2) | – | 0.19 ; 0.1 (0.1–0.6) | 0.004 |
| -Urine (ug/L) | 0.63;0 (0–9) | 0.13;0.08 (0–0.9) | 0.25 | |
| Pb: | ||||
| -Tissue (mg/kg) | 0.5;0.28 (0–5.8) | 0.99;0.62 (0–5.5) | 0.23;0.1 (0–1.4) | 0.006 ⁎⁎ ; 0.01 ^ |
| -Plasma (ug/L) | 5.2;0.31 (0–28.6) | – | 2.1;0.9 (0–15.6) | 0.57 |
| -Urine (ug/L) | 0.91;0.80 (0–4) | 0.39;0.09 (0–2.1) | 0.007 | |
| Ni: | ||||
| -Tissue (mg/kg) | 0.33;0.21 (0–1.9) | 0.21;0.16 (0–0.7) | 0.1;0.1 (0–0.34) | 0.003; 0.002 ⁎⁎ |
| -Plasma (ug/L) | 10.3;10 (6.1–13.7) | – | 2.2;1.9 (1–4.3) | < 0.001 |
| -Urine (ug/L) | 31.7;26.5 (0–99) | 1.9;2 (0.05–4) | < 0.001 | |
| Sr: | ||||
| -Tissue (mg/kg) | 0.3;0.16 (0–3.8) | 0.51;0.41 (0–1.2) | 0.15;0.14 (0–0.56) | 0.02 ⁎ ; 0.006 ^ |
| -Plasma (ug/L) | 38.4;39.5 (4–95) | – | 37.2;34.5 (11–99) | 0.39 |
| -Urine (ug/L) | 28.3;24 (0–93) | 13;14.9 (0.71–21.6) | < 0.001 |
⁎ BC versus adjacent noncancerous tissue.
Using Pearson’s, Kendall’s, and Spearman’s tests, the tissue, plasma and urine concentrations of Al, B, Cd, Co, Pb, Ni, Sr and Zn showed variable results, with a weak (r = 0.2–0.399) to moderate (r = 0.40–0.599) correlation in the majority of HMTE studied ( Table 2 ).
| Metal | Pearson’s correlation coefficient (r) { P value} | Kendall’s correlation coefficient (r) { P value} | Spearman’s correlation coefficient (r) { P value} |
|---|---|---|---|
| Al | |||
| -BC tissue vs. plasma | 0.14 {0.18} | 0.15 {0.03} | 0.22 {0.03} |
| -BC tissue vs. urine | 0.43 {< 0.001} | 0.26 {< 0.001} | 0.38 {< 0.001} |
| B | |||
| -BC tissue vs. plasma | −0.14 {0.18} | −0.13 {0.12} | −0.16 {0.11} |
| -BC tissue vs. urine | 0.15 {0.15} | 0.01 {0.88} | 0.02 {0.85} |
| Cd | |||
| -BC tissue vs. plasma | 0.06 {0.54} | 0.20 {0.005} | 0.27 {0.006} |
| -BC tissue vs. urine | 0.31 {0.002} | 0.46 {< 0.001} | 0.63 {< 0.001} |
| Co | |||
| -BC tissue vs. plasma | 0.51 {< 0.001} | 0.30 {< 0.001} | 0.41 {< 0.001} |
| -BC tissue vs. urine | 0.49 {< 0.001} | 0.36 {< 0.001} | 0.47 {< 0.001} |
| Pb | |||
| -BC tissue vs. plasma | 0.53 {< 0.001} | 0.39 {< 0.001} | 0.54 {< 0.001} |
| -BC tissue vs. urine | 0.44 {< 0.001} | 0.28 {< 0.001} | 0.40 {< 0.001} |
| Ni | |||
| -BC tissue vs. plasma | 0.36 {< 0.001} | 0.24 {< 0.001} | 0.35 {< 0.001} |
| -BC tissue vs. urine | 0.51 {< 0.001} | 0.39 {< 0.001} | 0.55 {< 0.001} |
| Sr | |||
| -BC tissue vs. plasma | 0.35 {< 0.001} | 0.19 {0.006} | 0.28 {0.006} |
| -BC tissue vs. urine | 0.53 {< 0.001} | 0.14 {0.045} | 0.22 {0.03} |
| Zn | |||
| -BC tissue vs. plasma | 0.32 {0.001} | 0.22 {0.001} | 0.32 {0.001} |
| -BC tissue vs. urine | 0.37 {< 0.001} | 0.27 {< 0.001} | 0.42 {< 0.001} |
Related posts:
 Optimal imaging techniques across the spectrum of testicular cancer
 Defining the genetic profile of prostate cancer
 Concomitant antihistamine administration is associated with improved survival outcomes in patients with locally advanced or metastatic urothelial carcinoma treated with atezolizumab. Analysis of individual participant data from IMvigor210 and IMvigor211
 Gene expression of prostate-specific membrane antigen ( FOLH1) in clear cell renal cell carcinoma predicts angiogenesis and response to tyrosine kinase inhibitors
 Germline genetic testing for prostate cancer: Ordering trends in the era of expanded hereditary cancer screening recommendations
 Navigating the gray zone: Machine learning can differentiate malignancy in PI-RADS 3 lesions
Stay updated, free articles. Join our Telegram channel

Full access? Get Clinical Tree


