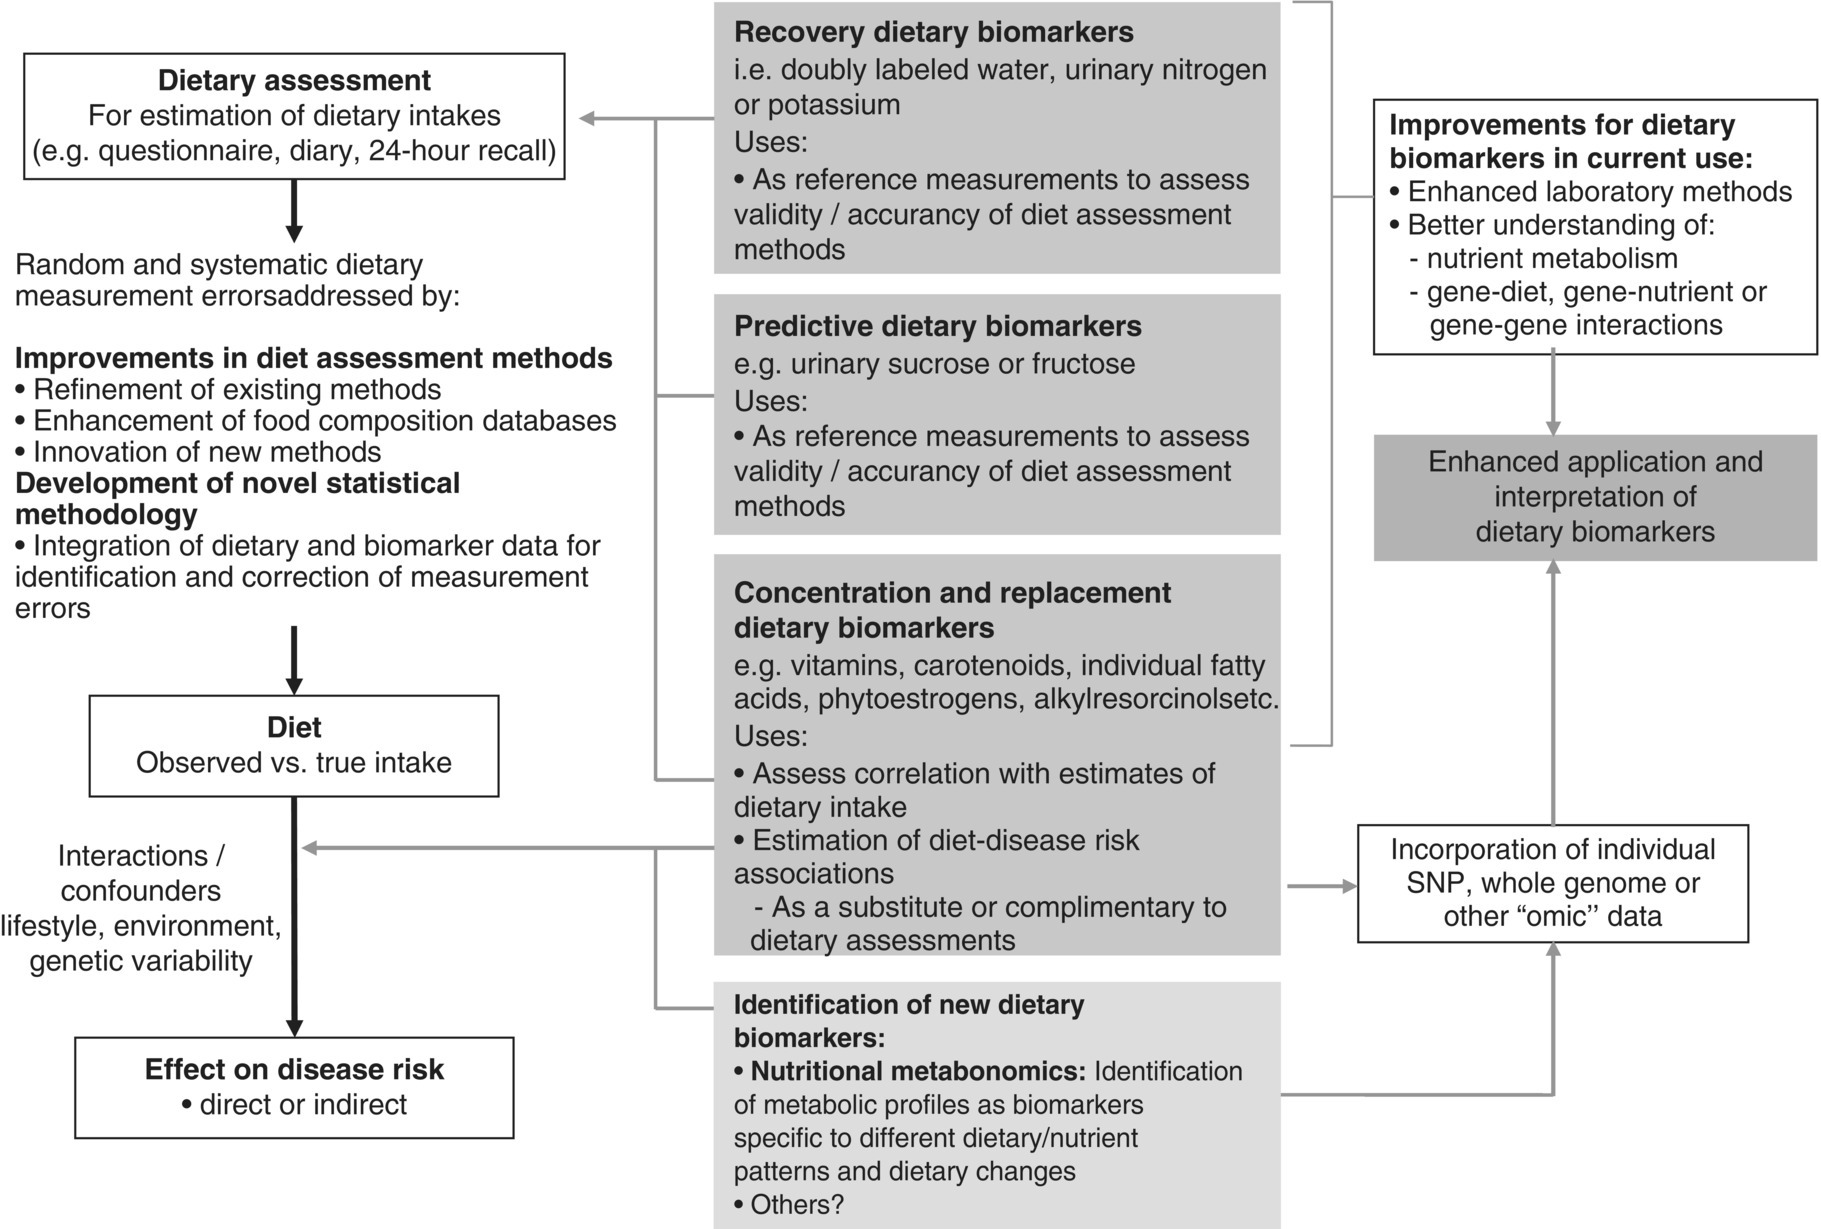
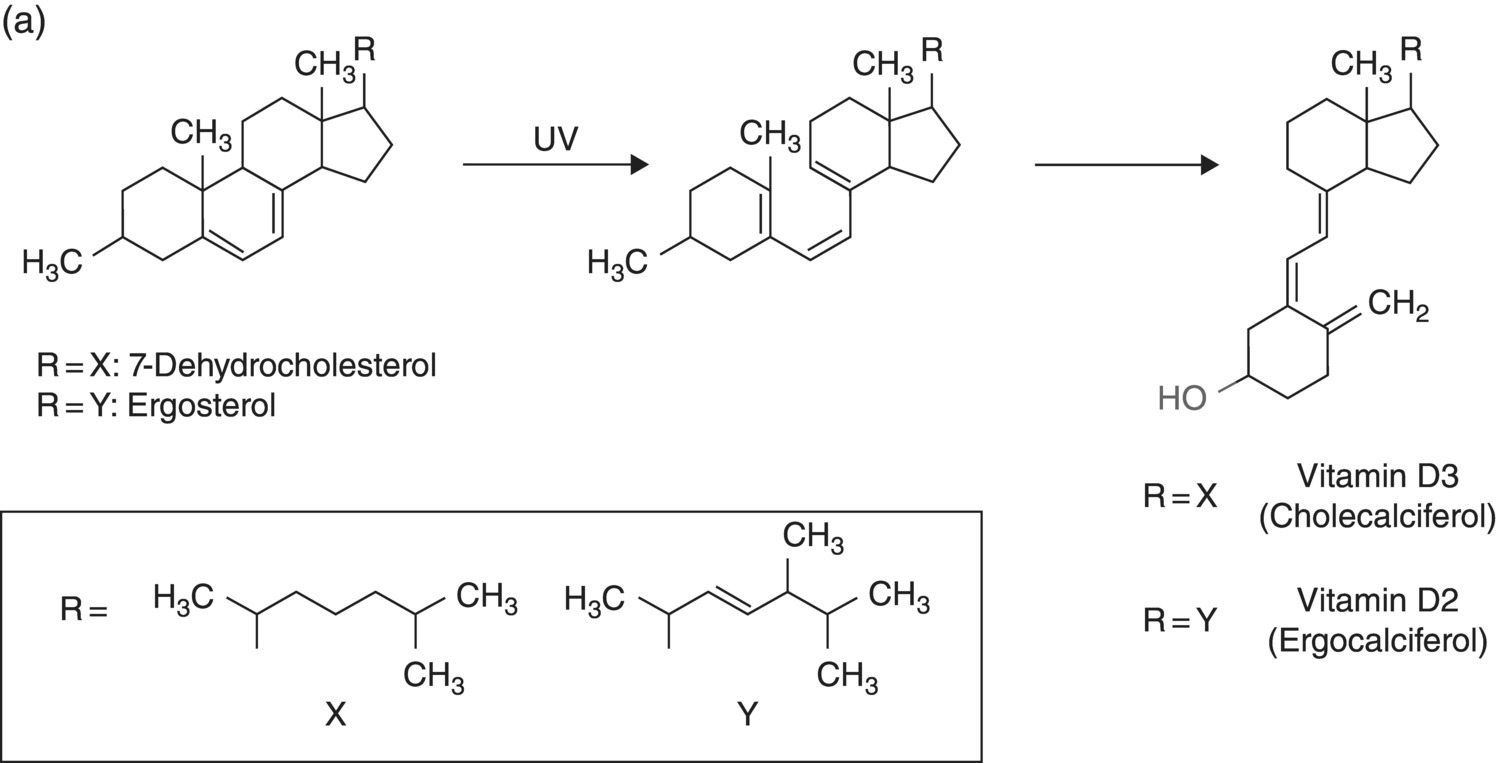
6 Gunter G C Kuhnle University of Reading Biomarkers – short for biochemical markers – are commonly used as surrogate markers for an event that cannot be observed directly. These events are mainly clinical endpoints, for example disease progression or mortality, or exposure, for example diet. A nutritional biomarker, or biochemical marker of intake, is an indicator of nutritional status that can be measured in any biological specimen. It is not restricted to a specific compound or groups of compounds, and can be interpreted broadly as a physiological consequence of dietary intake. These markers can be used to assess different aspects of nutrition, for example intake – or status – of micronutrients, specific foods or dietary patterns. In nutritional epidemiology, these biomarkers are commonly used as reference measurements to assess the validity and accuracy of other dietary assessment instruments (Prentice et al. 2009; Kuhnle 2012). An ideal nutritional biomarker should reflect dietary intake – or status – accurately and should be specific, sensitive and applicable to most populations. The biomarker should allow the objective and unbiased assessment of intake, independent of all biases and errors associated with individuals and other dietary assessment methods. However, such an ideal biomarker does not exist, and all biomarkers available have some limitations. Nevertheless, they provide useful information and are commonly used in nutritional epidemiology and other research areas where dietary assessment is important. The three main applications for biomarkers in nutritional sciences are as a measure of nutritional status; as a surrogate marker of dietary intake; and to validate other dietary assessment instruments. These different applications will be discussed in the next section. Biomarkers are commonly divided into categories depending on their relationship with intake (Jenab et al. 2009). Recovery biomarkers, based on the total excretion of the marker over a defined period of time, have a well-known relationship with intake and this relationship is consistent between individuals, with low inter-individual variability. Predictive biomarkers, a category introduced 2005 (Tasevska et al. 2011), also have a consistent, well-known relationship with intake, but an incomplete and low recovery. In concentration biomarkers, this relationship is less well known and more variable, with very high inter-individual variability. A summary of different types of biomarkers is shown in Figure 6.1. Figure 6.1 Overview of different types of biomarkers of intake, their main properties and application to investigate associations between intake and diseases risk. Jenab et al. (2009) Biomarkers in nutritional epidemiology, Human Genetics, 125 (5–6), 507. With kind permission from Springer Science and Business Media. Recovery biomarkers are the most important category of biomarker available, because they can provide an estimate of absolute intake levels. This type of marker requires a metabolic balance between intake and excretion over a defined period of time and a precise, quantitative knowledge of the physiological relationship. As suggested by the name, recovery markers are based on compounds that can be recovered completely – or almost completely – following consumption, mainly in 24-hour urine samples. For these biomarkers, the inter-individual variability in the excretion of the marker is negligible: for example, the excretion of urinary nitrogen in 24-hour urine is approximately equal to 80% of nitrogen intake in the same time period in any individual in energy and protein balance. A limitation of these biomarkers is that they are only suitable for individuals who are in a steady state; that is, individuals who do not increase or decrease in body mass as do young or old people or pregnant women. These biomarkers are also sensitive to a number of diseases that affect their excretion, in particular kidney diseases. Currently, only a few recovery biomarkers of dietary intake are available, for example urinary nitrogen, potassium and sodium. In contrast to recovery markers, which rely on the total excretion of a specific compound over a defined period of time, concentration biomarkers are only based on the biomarker concentration in the respective specimen. While recovery biomarkers can normally only be measured in 24-hour urine samples, concentration biomarkers can be measured in almost all specimens available. These biomarkers do not have a consistent relationship between intake and excretion, and therefore high inter-individual variability; they also do not have a time dimension. For this reason, concentration biomarkers cannot easily be translated into absolute dietary intake, but are only utilised to compare different levels of intake; additional information is usually required to provide a reference. Concentration biomarkers are often used to investigate associations between diet and disease risk, as these markers can lead to a better ranking of intake than other assessment instruments that rely on self-reporting. In contrast to dietary data, biomarker concentration determined in blood or urine takes into account bioavailability, metabolism, nutrient–nutrient interaction and excretion, and therefore might provide better information on the bioavailable nutrient than dietary data. These biomarkers are the most common type of biochemical marker currently available, as they can be measured in a wide range of specimens and do not require the collection of 24-hour urine samples. Many micronutrients can be used as concentration markers of their own intake (see later in this chapter). Other concentration markers include urinary phytoestrogens (isoflavones and lignans) and alkylresorcinols (for wholegrain). Predictive biomarkers are the latest category of biomarkers that have been developed. They have an incomplete recovery but a stable and time-dependent correlation with intake. While they allow an estimation of absolute intake, they are not as reliable as recovery markers. Currently, urinary sucrose is the only predictive biomarker available. Functional markers are an alternative type of biomarker. In contrast to most biomarkers described here, functional markers measure the physiological effect of specific foods as a surrogate marker of intake. A commonly used functional marker is EGRAC (erythrocyte glutathione reductase assay coefficient; Dror, Stern and Komarnitsky 1994) for Vitamin B2 status (see later in this chapter), but other markers are also available. There is only one recovery biomarker currently available to assess the intake of the primary three macronutrients, urinary nitrogen for protein intake. While the intake of fat can be determined to some extent by the analysis of fatty acids (see later in this chapter), there is currently no biomarker for the intake of total carbohydrates except for sucrose. The assessment of protein intake by total urinary nitrogen is based on the assumption that subjects are in nitrogen balance and that there is neither accumulation nor loss due to growth, starvation, diet or injury. The application of urinary nitrogen was described in 1924 by Denis and Borgstrom in a study to investigate the temperature dependence of protein intake in medical students. Since then, this biomarker has been investigated further and it is now commonly used (Bingham 2003). Several validation studies have been conducted to investigate the association between intake and excretion, and urinary nitrogen is probably one of the best-validated biomarkers available. When taking into account nitrogen losses via faeces and skin, there is an almost complete agreement between long-term intake and urinary nitrogen (as shown by a correlation coefficient of 0.99 for a 28-day diet). The biomarker underestimates intake at higher levels of protein intake and overestimates it at lower levels, but when taking into account the factors described above, urinary nitrogen excretion is on average around 80% of dietary intake, and this ratio can be used for its determination. Daily individual variations require the collection of urine samples on several days, as an individual is unlikely to be in nitrogen balance on any one day. When using only the sample of a single day, a correlation between intake and biomarker of approximately 0.5 can be expected, with a coefficient of variation of 24%. However, this improves to a correlation coefficient of 0.95 and a coefficient of variation of 5% when using 8 days of urine collection and 18 days of dietary observation. A key limitation of 24-hour urinary nitrogen is the collection of 24-hour urine samples, which is often not feasible in studies. Urinary nitrogen in partial 24-hour urine collections, and even spot urine samples, has been used, but the results depend on the timing of diet and meal consumption. The standard method for urinary nitrogen is the Kjeldahl method, developed by the Danish chemist Johan Kjeldahl in 1883. In this method, all nitrogen present in the sample is converted into ammonium sulphate and then analysed; it therefore determines not only protein nitrogen, but all nitrogen present in the sample. The method is very robust and reproducible, and can be automated for the analysis of larger numbers of samples. An important disadvantage of this method is that it can only provide information on total protein intake, not intake of specific amino acids or the source of proteins (such as plant or animal protein). Additional markers, such as stable isotope ratios, are required to obtain more information on protein sources, although there is still a paucity of validated markers. While nitrogen intake can be measured with a single biomarker, urinary nitrogen, there is no such biomarker for total fat intake. Individual fatty acids can be measured in a variety of different specimens, and the fatty acid composition can be used to make inferences regarding dietary fat intake. Fatty acids are mainly present as triacylglycerol, phospholipids and cholesterol esters, and they are found in membranes, adipose tissue and also plasma (as free fatty acids). Their distribution –among both different molecules and tissues – depends largely on the type of fatty acid, and it is mainly the fatty acid profile that is used to make inferences on intake. As fatty acids undergo extensive metabolism, it is important to take this into account when interpreting different biomarkers. While many fatty acids – in particular saturated fatty acids (SFA) – can be synthesised endogenously, this is rare in people consuming more than 25% of their energy as fat and thus storage in adipose tissue tends to reflect dietary consumption. Essential polyunsaturated fatty acids (PUFA), such as members of the ω − 6 (linoleic acid) and ω − 3 (α-linoleic acid) family, cannot be synthesised de novo by humans, and therefore they can also be used as a marker of intake. However, the majority of fatty acids in human tissues are non-essential and can be either endogenously produced or supplied via the diet. The transport of fatty acids into adipose tissue is presumed to be non-selective, and therefore the relative distribution of fatty acids there is often considered to be the strongest biomarker of long-term intake. However, non-selective transport cannot be assumed for all tissues, and this has to be taken into account when interpreting data. Adipose tissue has a half-life of approximately 1–2 years, therefore the fatty acid composition in adipose tissue reflects intake within this period of time (Hodson, Skeaff and Fielding 2008). While this is advantageous when assessing diet, it makes the validation of these biomarkers more complicated, as assessing diet over such a long time frame is difficult. In contrast, the half-life of erythrocytes is approximately 60 days and therefore erythrocyte membrane fatty acids are more suitable to assess medium-term diet. Studies have shown significant correlations between the relative intake of PUFA and PUFA content in adipose tissue, erythrocytes and plasma, in particular n-3 and/or n-6 fatty acids. However, the chain length can affect the association between intake and concentration, for example the plasma concentration of ALNA (alpha-linoleic acid, C18:3 n-3) does not reflect intake, while EPA (C20:5 n-3) and DHA (C22:6 n-3) do. Strong correlations between intake and biomarker in adipose tissue or blood have also been observed for other types of fatty acids, such as trans fatty acids, SFA and monounsaturated fatty acids (MUFA), although the observed correlation coefficients vary widely between less than 0.1 and more than 0.7 (Hodson, Skeaff and Fielding 2008). Concentration of pentadecanoic acid (C15:0) and heptadecanoic acid (C17:0) in adipose tissue correlates well with dairy intake, with correlation coefficients of approximately 0.3. The analytical methods for lipids depend to some extend on the specimen used. Thin layer chromatography (TLC) or silica cartridges are commonly used to separate different lipid fractions; alternatively, samples are extracted using a chloroform:methanol mixture (1:1) and purified by solid-phase extraction (SPE). Fatty acids are then normally converted into their methyl-ester (FAME, fatty acid methyl ester) by transesterification and analysed using gas chromatography (GC) or high-performance liquid chromatography (HPLC). While mass spectrometric detection facilitates the identification of individual fatty acids, flame-ionisation detectors (FID) are most commonly used and fatty acids are identified by their relative retention time. This is sufficient for most applications; however, it is often difficult to separate cis– and trans-isomers of fatty acids and to identify compounds with low abundance. The results of fatty acid analyses are usually given as a fatty acid profile with the relative contribution of each fatty acid, either as mol% (mol fatty acid per mol total fatty acids) or weight%. The former, mol%, are biologically more meaningful, in particular when molecular ratios of fatty acids or long-chain fatty acids are being considered (Hodson, Skeaff and Fielding 2008). Alternatively, the absolute concentration of individual fatty acids can be given, and this data can also be used as a fatty acid profile. However, the absolute concentration cannot be used as a marker of total dietary fat intake. Recent developments in mass spectrometry have resulted in novel methods for the analysis of fatty acids that do not require laborious sample preparation. In lipidomics, samples are usually separated by HPLC and identified by their fragmentation spectrum using tandem mass spectrometry (MS). While this method can provide detailed information about lipids present in the sample, there are several disadvantages, for example differential loss of lipids and lipid–lipid interactions that can affect ionisation efficiency. An alternative method is shotgun lipidomics, where samples are analysed without prior separation and lipids are identified using tandem MS. This approach has several advantages, for example no differential loss of compounds during liquid chromatography (LC) separation and – when using nano-electrospray – virtually unlimited analysis time, even with small amounts of sample. However, lipidomics relies extensively on bioinformatics for the identification of lipids and interpretation of results, as the generated data can be very complex (Griffiths and Wang 2009; Han, Yang and Gross 2012). There is currently no biomarker for total carbohydrate intake, partially due to the complex nature of these nutrients and their extensive metabolism. However, a predictive biomarker exists for total sugar intake – the sum of urinary sucrose and fructose. This biomarker has been validated in several dietary intervention studies as well as the Observing Protein and Energy Nutrition (OPEN) study. The correlation between mean sugar intake and mean sugar excretion is approximately 0.84, even though the recovery is low (~0.05% of total intake). However, this biomarker is more sensitive to extrinsic sugars than to intrinsic sugars. In 24-hour urine samples, the association between total sugar excretion and dietary intake has been estimated to be: where M: biomarker; S = 0 for men; S = 1 for women; A: age; T: true intake; u: person-specific bias; ε: within-person random error This association can be used to estimate dietary intake. While urinary sugars are a predictive biomarker when determined in 24-hour urine, they are concentration biomarkers when determined in spot urine samples. While urinary creatinine can be used to adjust for difference in urine volume in most applications, this is not possible when investigating associations with body mass or body mass index because of the strong correlation between body mass and creatinine excretion. It has therefore been suggested that the ratio of urinary sucrose and fructose should be used as a biomarker of sugar intake. Urinary sugars are traditionally determined using enzymatic assays, as these are readily available in most clinical laboratories. Alternatively, urinary sugars can be analysed by chromatographic methods such as GC or HPLC. Chromatographic methods have the advantage that they can be used to determine sugars for which no enzymatic methods have been established. In the absence of high-throughput clinical robots, chromatographic methods can also provide a faster sample analysis (Tasevska et al. 2005, 2011; Bingham et al. 2007). Fibre is an important constituent of diet, but there is still a paucity of easily accessible biomarkers, in particular because of the varied nature of fibre. Two classes of compounds found in fibre-rich foods have been proposed as potential biomarkers of intake: lignans (Lampe 2003) and alkylresorcinols (Marklund et al. 2013). As lignans are also found in a number of other foods such as tea and coffee, alkylresorcinols are currently the main candidate biomarker. Alkylresorcinols are phenolic lipids found in particular in cereals, and they are therefore mainly biomarkers of cereal or wholegrain. Validation studies with different assessment instruments, as well as human intervention studies, have shown a significant correlation between wholegrain and the alkylresorcinol metabolite 3-(3,5-dihydroxyphenyl)-1-propanoic acid (DHPPA) and 3,5-dihydroxybenzoic acid (DHBA). In 24-hour urine, alkylresorcinol metabolites correlate well with the intake of both wholegrain (r = 0.3–0.5) and total cereal fibre (r = 0.5–0.6). Alternative biomarkers of fibre intake are stool weight, which correlates well with fibre intake (r = 0.8), and faecal hemicellulose, which also shows a good correlation (r = 0.5). However, these biomarkers require the collection of stool samples and this is not always possible in nutrition studies. Many micronutrients can be used as their own biomarker of intake, and micronutrient status is often assessed in a number of different specimens. However, for many micronutrients no proper validation studies have been conducted, and there is insufficient information regarding the association between intake and biomarker concentration. Most micronutrients can only act as concentration biomarkers – with the exception of potassium and to some extent sodium – as their concentration is affected by a number of different factors. Retinol is the bioactive form of vitamin A and can be measured in serum and plasma. Its main dietary sources are retinyl esters, provitamin A carotenoids and vitamin A, the latter mainly from animal sources. Retinol can be measured in blood (serum and plasma), but the concentration has only limited value as it is tightly controlled by the liver. Retinol concentrations are therefore only useful markers of vitamin A status when the liver stores are either saturated or depleted; intervention studies with high intake of retinyl esters in healthy individuals showed only modest changes in plasma concentrations. However, retinol concentrations can be used to detect vitamin A deficiencies and hyporetinolaemia (retinol concentration < 0.7 μmol/L). Vitamin A – and other carotenoids – are usually analysed using HPLC with ultraviolet (UV), fluorescence or mass spectrometric detection. Carotenoids are sensitive to light and heat, so it is important to store the samples at low temperatures (below –70 ºC) and in the dark. Thiamine (vitamin B1) can be measured in 24-hour urine samples and correlates well with long term (r = 0.7) and short term (r = 0.6) intake. However, because of high between-subject variability, urinary thiamine cannot be used as a recovery biomarker. Similar correlations between short-term intake and urinary excretion (r = 0.4 – 0.7) were also found for other B vitamins except for vitamin B12. The excretion of vitamin B12 appears to be dependent on total urine volume. The status of vitamin B2 (riboflavin), an important precursor of FAD (flavin adenine dinucleotide), is often determined using a functional biomarker, the erythrocyte glutathione reductase assay coefficient (EGRAC). In this assay, the activity of erythrocyte glutathione reductase is determined with and without the addition of FAD. In subjects with adequate riboflavin intake, only a slight increase occurs, as sufficient FAD is available. However, the ratio increases with lower intake. Alternative measures for vitamin B2 status are plasma or urinary riboflavin, but while EGRAC reflects long-term intake, these measures are more suitable for short-term intake assessment. Studies using blood samples showed weaker and non-significant associations for many B vitamins. However, there are strong correlations between intake of folic acid and folate in red blood cells (r = 0.5), serum (r = 0.6) and plasma (r = 0.6). Erythrocyte folate is generally preferred, as plasma folate varies greatly depending on metabolism and intake, while erythrocyte folate is a measure of long-term intake. Although vitamin B12 status (measured in plasma) has been used as a surrogate marker of intake, there is a paucity of information on the association with intake. Low total serum vitamin B12 (the sum of B12 bound to transcobalamin II and haptocorrin) can be used as an indicator of deficiency. The standard clinical screening test for the diagnosis of vitamin B12 deficiency, measurement of plasma or serum vitamin B12, has low diagnostic accuracy, while plasma levels of total homocysteine (tHcy) and methylmalonic acid (MMA) are considered more sensitive markers of vitamin B12 status. Holotranscobalamin (holoTC), the portion of vitamin B12 bound to the transport protein transcobalamin (TC) and the related TC saturation (the fraction of total TC present as holoTC), represent the biologically active fraction of total vitamin B12 and have been proposed as potentially useful indicators of vitamin B12 status. Vitamin C concentration in blood and urine can be used as a biomarker of overall vitamin C intake, although there are some limitations of urinary vitamin C concentration and this biomarker is mainly assessed in plasma. Even though plasma vitamin C is a commonly used biomarker and is often considered to be well established, there is only a modest correlation between intake and biomarker (r = ~0.4) with a large variation between populations, although this might also be due to other factors such as genotype and lifestyle factors. As vitamin C is one of the most labile vitamins, sampling, storage and analytical techniques are of great importance. The annual loss of vitamin C in plasma during long storage periods has been estimated to be between 0.3 and 2.4 μmol/L depending on the baseline concentration. The stability of vitamin C can often be improved by the addition of protein-precipitating agents such as metaphosphoric acid, but this might not be always possible. The pharmacokinetic properties of vitamin C are well known, and there are a number of sources of inter-individual variability: vitamin C is absorbed both by diffusion and active transport, the sodium-ascorbate-Co-transporters (SVCT 1 and 2, transporting the reduced form) and hexose transporters (GLUT1 and 3, transporting dehydroascorbic acid), and genetic polymorphisms are a large source of variation. Other factors such as age and smoking status can also affect vitamin C status, as well as the consumption of certain foods and drugs. Furthermore, the relationship between intake and absorption is linear only for intakes below approximately 100 mg/day and reaches a plateau at intakes above 120 mg/day; at lower plasma vitamin C concentrations, renal excretion is minimised, further affecting biomarker concentration (Jenab et al. 2009). Vitamin D can either be absorbed from the diet or synthesised in the skin using UV radiation; the precursor of endogenously formed vitamin D, 7-dehrydrocholesterol, is thereby converted into cholecalciferol (vitamin D3). The main sources of dietary vitamin D are fortified foods, in particular margarines, animal products (vitamin D3) and plant-based foods (vitamin D2, from the irradiation of ergosterol). The activated form of vitamin D, 25-hydroxyvitamin D (25(OH)D), is commonly used as a measure of vitamin D status. Due to the combination of endogenous and exogenous sources of vitamin D, the plasma level of 25(OH)D can only provide information on total status but not dietary intake (Jones 2012; see also Figure 6.2 for details).
Biomarkers of Intake
6.1 Introduction: Biochemical markers of intake
6.2 Types of biomarkers and their application
Recovery biomarkers
Concentration biomarkers
Predictive biomarkers
Functional markers
6.3 Specific biomarkers
Macronutrient and energy intake
Urinary nitrogen as a biomarker of protein intake
Fatty acids as a biomarker of fat intake
Fatty acids in adipose tissue and blood
Fatty acid analysis
Urinary sugars

Fibre and wholegrain
Micronutrient intake
Vitamin A
B vitamins
Vitamin C
Vitamin D


Stay updated, free articles. Join our Telegram channel

Full access? Get Clinical Tree


