Reference
N
Response
C0 (ng/mL)
P value
N
≤1000
N
>1000
Marin et al. [10]
84
CMR
43
23.3 %
41
44.4 %
0.14
MMR
60.1 %
83.2 %
0.02
Takahashi et al. [41]
254
CCyR
146
83.6 %
108
88.9 %
0.276
MMR
58.9 %
74.1 %
0.012
Picard et al. [42]
68
MMR
32
25.0 %
36
72.2 %
0.03
60
MMR
29
48.3 %
31
77.4 %
0.019
The relationship between plasma concentration of second-generation TKIs and clinical efficacy has been reported in only a few studies. Giles et al. evaluated the population pharmacokinetics (PK) and exposure-response relationship of nilotinib in patients with imatinib-resistant or imatinib-intolerant CML [44]. In this large cohort, patients with a lower concentration (<500 ng/mL) had a significantly longer time to CCyR (P = 0.010), a longer time to MMR (P = 0.012), and a shorter time to progression (P = 0.009).
Although the plasma imatinib concentration depends on daily dose, there is an interindividual variability that can be ignored. The distribution of plasma trough imatinib concentration varies widely from 140 to 3910 ng/mL in patients treated with 400 mg of the drug [41]. The interindividual variability is associated with several factors such as age, sex, liver function, renal function, drug-drug interactions [8, 9], adherence [10], and polymorphisms of drug metabolism or drug transport [6, 7].
5.3.2 TKIs and Drug Transporters
TKIs such as imatinib, nilotinib, and dasatinib are substrates of ATP-binding cassette (ABC) transporters such as P-glycoprotein (P-gp) encoded by the ABCB1 gene and breast cancer resistance protein (BCRP) encoded by ABCG2 gene [45–50] (Fig. 5.1). Imatinib is also a substrate of the uptake transporter, organic cation transporter 1 (OCT1), which is encoded by SLC22A1 gene [51–53] (Fig. 5.1). Pharmacogenetic research on imatinib has focused in part on the relation between imatinib exposure and the clinical response to imatinib (pharmacodynamic effect) and the expression levels of these transporters.
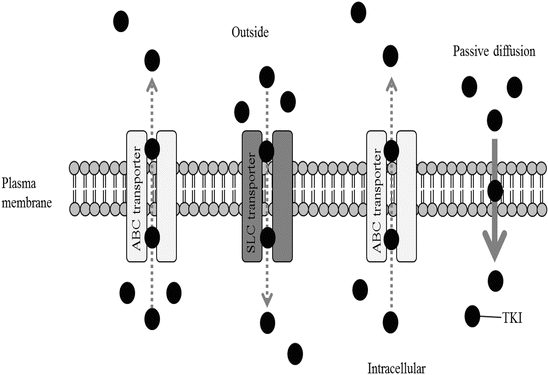

Fig. 5.1
Schematic diagram of the transporters on the membrane of leukemia cells
Three single nucleotide polymorphisms (SNPs) in ABCB1, C1236T, G2677T/A, and C3435T can affect cellular transport of imatinib. The association between these SNPs and imatinib response in CML patients has been widely evaluated, but the results are inconsistent. To derive a conclusive assessment of the associations, we performed a meta-analysis using data from 12 reports including 1826 patients [54]. The presence of the 1236CC genotype, 2677T/A allele, or 3435C allele marks improved response to imatinib in CML patients.
We reported that the dose-adjusted imatinib plasma trough concentration was significantly lower in Japanese patients with the ABCG2 421C/C genotype than in patients with the C/A + A/A genotypes (Table 5.2) [55]. In addition, Petain et al. reported that imatinib clearance in patients carrying the ABCG2 421C/A genotype was significantly lower than in those with the 421C/C genotype [56]. Kim et al. reported that patients with the ABCG2 421A/A genotype achieved MMR and complete molecular response (CMR) much more than patients with ABCG 2 421C/A + C/C [57]. It thus appears that among CML patients, the ABCG2 421A allele is associated with a higher imatinib exposure and a better response to imatinib in CML patients than the 421C allele. Moreover, the percentage of patients with CMR was significantly lower among those with the ABCG2 421C/C genotype than among those with the A allele [58]. This finding suggests that the ABCG2 421A allele is associated with higher intracellular retention and therefore higher imatinib exposure than the wild-type genotype. This finding is in agreement with the in vitro study by Imai et al. that demonstrated that protein expression levels of BCRP, which is encoded by ABCG2, were markedly decreased in patients with the ABCG2 421A allele compared with the 421C/C genotype [59].
Table 5.2
Effect on pharmacokinetics or molecular response and ABCG2 421C > A for imatinib
Reference | N | Genotype (n) | Effect on PK/response |
|---|---|---|---|
Takahashi et al. [55] | 67 | 421 CC vs. 421 CA + AA [25] | C0 increased |
Petain et al. [56] | 46 | 421 CC vs. 421 CA [5] | CL/F decreased |
Kim et al. [57] | 229 | 421 CC vs. 421 CA + AA (NA) | MMR/CMR increased |
Sinohara et al. [58] | 152 | 421 CC vs. 421 CA + AA [59] | CMR increased |
OCT1 is primarily expressed in hepatocytes, suggesting that it plays a role in substrate uptake into the liver. Moreover, the level of OCT1 expression likely correlates with the intracellular imatinib concentration, as primary CML cells expressing high levels of OCT1 show greater drug uptake than those exhibiting more modest OCT1 expression [6, 51, 52] (Fig. 5.1). On the other hand, nilotinib and dasatinib are passively transported into cells without OCT1 activity and so are not affected by OCT1 activity on the surface of leukemia cells.
5.3.3 Immunological Biomarkers
Several studies have reported that patients treated with dasatinib developed large granular lymphocytosis and significantly optimal molecular responses [60, 61]. The large granular lymphocytosis was identified as natural killer (NK) cells or NK/T cells based on immunophenotypic profiles [62]. Mizoguchi et al. reported that the percentage of effector NK cell populations were significantly higher in patients with TFR than in those without TFR and control groups [63]. Moreover, European groups also showed the relationship between successful TFR and NK cells [64, 65].
In a German clinical study that evaluated a maintenance therapy regimen comprising interferon-alpha following combined imatinib and interferon-alpha therapy in CML-CP patients that achieved CMR, interferon-alpha therapy was associated with expansion of proteinase-3-specific cytotoxic T cells, and it may result in improved molecular response [66]. Shinohara et al. evaluated immunological parameters in CML-CP patients treated with imatinib and reported that regulatory T cells were significantly lower in patients with CMR than in those without CMR [58]. Barachandran et al. reported that imatinib therapy activated CD8+ T cells and induced regulatory T-cell apoptosis within gastrointestinal stromal tumors (GISTs). The number and activity of these T-cell populations are crucial to the antitumor effects of imatinib in GIST [67]. These results suggest that the immunological activation status of T cells and NK cells contributes to TFR or clinical outcomes in imatinib treatment. We are currently planning to evaluate immunophenotypic profiling as exploratory research in a prospective JALSG STIM213 study (UMIN000011971) that will elucidate the role of NK/T cells as a component of leukemia immune surveillance.
5.3.4 BIM
BCL2-like 11 (BIM) is a protein associated with apoptosis and is required to induce TKI-mediated apoptosis in tumor cells [68]. The common intron 2 deletion polymorphism of the BIM gene is found in 20 % of the Asian population and results in the expression of a BIM isoform lacking the BH3 domain. It was recently reported that this BIM polymorphism is involved in the poor response to TKIs in CML cell lines, but this resistance could be overcome with BH3-mimetic drugs. Additionally, individuals with CML harboring the polymorphism experienced significantly inferior responses to TKIs than individuals without the polymorphism [11]. A French group recently showed that the T allele of BIM c465C > T (rs724710) is associated with Sokal score and a longer time to MMR achievement [69]. The study suggested that polymorphisms in BIM might influence TKI treatment effects in non-Asians as well as Asians.
5.4 Conclusions
In this review, we discussed plasma concentration of TKIs, drug transporters, T/NK cells, and BIM polymorphisms as biomarkers for predicting the outcome in CML treatment (Table 5.3). As of now, these factors are still candidate biomarkers and will need to be evaluated in large prospective studies in the future.
Table 5.3
Clinical endpoints, surrogate endpoints, and biomarkers for CML treatment
Clinical endpoints | Surrogate endpoints | Candidate for biomarkers | |
|---|---|---|---|
TKI treatment | OS | MMR at 18 months (bcr-ablIS <0.1 %) | TKI concentration |
PFS | EMR at 3 months (bcr-ablIS <1 0 %) | OCT1 activity | |
EMR at 6 months (bcr-ablIS <1 %) | ABCB1 C1236T | ||
ABCB1 G2677T/A | |||
ABCB1 C3435T | |||
ABCG2 C421A | |||
LGL (NK cell/T cell) | |||
BIM common deletion polymorphism | |||
TKI stop | OS | TFR at 6 months (bcr-ablIS <0.0032 %) | ABCG2 C421A |
RFS | Treg | ||
NK cell |
References
1.
2.
3.
4.
Radich JP, Dai H, Mao M, Oehler V, Schelter J, Druker B, et al. Gene expression changes associated with progression and response in chronic myeloid leukemia. Proc Natl Acad Sci U S A. 2006;103(8):2794–9.PubMedCentralCrossRefPubMed
5.
Crossman LC, O’Brien SG. Imatinib therapy in chronic myeloid leukemia. Hematol Oncol Clin North Am. 2004;18(3):605–17. 3.CrossRefPubMed
Stay updated, free articles. Join our Telegram channel

Full access? Get Clinical Tree


