Basic Principles and Clinical Applications of Flow Cytometry
Flow cytometry is a technology used routinely in most hematology laboratories. Its entry into the mainstream of clinical laboratory analysis has been aided by the increasing availability of monoclonal antibodies that define cell surface and intracellular proteins as markers of cell lineage, differentiation, activation, and other biologic properties. Instrument design advances have yielded benchtop cytometers with fixed optics that, when linked with new developments in fluorochrome chemistry, enable a wide range of clinical applications. In addition, proficiency testing is now available in support of these clinical applications through the College of American Pathologists as mandated by the Clinical Laboratory Improvement Amendment of 1988. The major advantage that flow cytometry provides is its capacity to assess multiple measurements on large numbers of individual cells. Flow cytometric studies have extended the understanding of hematopoietic cell development, differentiation, activation, and apoptosis. In addition, they have provided important information regarding hematologic malignancies, insight into reconstitution after stem cell transplantation, and understanding of cell abnormalities that result in immune or hematologic deficiencies. As such, flow cytometry plays an important role in the diagnosis, characterization, and monitoring of a number of hematologic disorders.
The basic design of a flow cytometer involves four major elements: optics, fluidics, electronics, and a computer equipped with specialized software.1,2 The optical system utilizes one or more light sources, typically one or several lasers that produce monochromatic light and serve as the excitation beams. At the opposite side of the optical bench, light generated from the cells that have intersected the excitation beam is filtered, reflected by dichroic mirrors set in fixed locations, and finally collected by linked photodetectors to allow quantitation of the emitted light at specific wavelengths. To ensure that all cells analyzed experience consistent exposure to the excitation beam, the fluidic system must maintain the cells in a consistent location as they move sequentially through the beam. To accomplish this, the cell suspension is injected into a flowing stream of sheath fluid that hydrodynamically focuses the inner stream of cells within the outer sheath fluid stream.1 The intersection of the cells with the excitation light beam(s) produces characteristic light scatter (nonfluorescent) signals; additional fluorescent signals are generated by fluorochromes that typically are linked to specific reagents that bind antigens present on or within the cells of interest. The various light signals (parameters) are collected by the optical bench, while instrument design determines the number of parameters collected per cell. The two reagent-independent (nonfluorescent) parameters are forward-angle light scatter, as a marker of cell size, and side-angle light scatter, as an index of cellular regularity/ granularity. The combination of these two parameters allows for an approximate discrimination among the three major types of leukocytes as well as evaluation of red blood cells and platelets in whole blood samples.3
The fluorescent data collected by a flow cytometer are the result of either cell surface or intracellular binding of antibodies or other specific ligands conjugated directly to fluorochromes or detected with secondary reagents conjugated to fluorochromes, as well as reagents that are inherently fluorescent. Fluorochromes are excited by light of a defined wavelength and emit light of lower energy (longer wavelength). There are currently many different fluorochromes used in clinical flow cytometry, including fluorescein isothiocyanate, phycoerythrin, peridin chlorophyll protein, and allophycocyanin. More recently, combinations of two fluorochromes linked to each other have been developed; they depend on the transfer of energy from the first fluorochrome to excite the second fluorochrome. These tandem fluorochromes extend the range of emission wavelengths available from one excitation beam. The availability of multiple fluorochromes that absorb light of the same wavelength but emit light at different wavelengths means that multiple reagents can be used simultaneously with a single light source to yield a multicolor (polychromatic) study. One or more additional light sources are present in most current clinical instruments to extend the range of multicolor studies. Extended multicolor studies require complex color compensation and data management processes that typically involve sequential data evaluation.
The clinical application of flow cytometry in hematology saw its earliest use as a supplement to the morphologic classification of leukemias and lymphomas, affording not only lineage information but also the state of differentiation and/or maturation,4,5 cell growth and apoptosis.6 In addition, flow cytometry provided the best prognosticator in human immunodeficiency virus (HIV) infection based on absolute CD4 T cell numbers.7 More recently, flow cytometry has proven important in characterizing hematopoietic stem cells, detecting minimal residual neoplastic disease, defining immune deficiencies, identifying certain red blood cell related disorders, measuring the number of contaminating leukocytes in plasma and red blood cell transfusions, evaluating platelets and characterizing other blood cells.8–12 Flow cytometry also can be used to look inside the cell as well as to evaluate cell surface characteristics. Fixation and permeabilization facilitate intracellular entry of reagents to determine the presence of specific proteins and to assess functional characteristics.13 This chapter is directed at basic concepts of flow cytometry including data presentation and interpretation followed by a brief review of applications for hematologists.
![]()
DATA PRESENTATION AND INTERPRETATION
Current flow cytometers generally yield graphic displays of the cell frequency versus the light intensity for one or more parameters by means of specialized computer software. Figure 28.1, shows a single-parameter histogram that reflects the quantitative distribution of cells (y-axis) versus light signal strength (x-axis). Alternatively, the signal intensity of two correlated parameters can be plotted versus cell frequency, the latter displayed as dot density (dot plot, Fig. 28.2A) or a series of concentric lines (contour plot, Fig. 28.2B). When measuring multiple parameters (as colors), the data are typically evaluated by using dual-parameter displays. Typically, 10,000 to 20,000 events are collected to provide sufficient numbers of cells for meaningful data relative to the subpopulations of interest. However, when the cell or cells of interest are infrequent, such as evaluating hematopoietic stem cells (CD34+) in peripheral blood or detecting minimal residual disease (MRD) in leukemia, substantially larger total numbers of cells must be collected.8,14
Distinguishing a positive signal is usually based on defining background signals by evaluating either unstained cells (no monoclonal antibody added) or cells that have been incubated with a fluorochromeconjugated irrelevant antibody. By convention, the negative–positive discriminator is defined by the intensity of a signal that includes 99% (or 98%) of all cells based on one of the background conditions described above; cells that emit a signal above this discriminator are scored as positive for binding by the specific reagent(s) added to the cell suspension. This approach applies to well-defined populations with homogeneous antigen expression, but modifications or alternative interpretations may be necessary when the cell populations analyzed are heterogeneous or express dim fluorescence, which can lead to rather arbitrary calculations of percentages of positive cells.
The data generated by the computer are only as good as the instrument capabilities, settings, reagents, and cell preparation used. To prevent reporting invalid data, certain standards must be met.15 First, optimal instrument performance is integral and depends on a quality control program utilizing specialized software and methods. The use of validated reagents is also part of good laboratory practices, while the quality of the cell preparation can be assessed using the nonfluorescent parameters, forward- and side-angle light scatter, to confirm the presence of the population of interest. Each major blood cell type has distinctive features in this scatter plot. Platelets are obviously smaller than all other blood cells and heterogeneous in size, characteristics that can be confirmed in comparison to red blood cells. Erythrocytes have a characteristic appearance based on forward- and side-angle light scatter (Fig. 28.3A), which partially overlaps with that of lymphocytes. However, because of the large difference in frequency of circulating erythrocytes and leukocytes, there is no practical concern of lymphocytes contaminating erythrocytes (a collection of 10,000 erythrocytes normally would include less than 20 lymphocytes). In contrast, the presence of erythrocytes makes evaluation of lymphocytes virtually impossible. In part because of this reason, the study of lymphocytes in a whole blood sample or other specimens containing a significant amount of blood typically involves a red blood cell lysis step to eliminate erythrocytes (Fig. 28.3B). Following successful red cell lysis, a three-part differential is observed in peripheral blood with normal lymphocytes representing the smallest (forward-angle light scatter) and most regular/ agranular (side-angle scatter) cells, while granulocytes are slightly larger (higher forward-angle scatter) and show substantial granularity (high side-angle scatter), and monocytes fall between these two cell types (Fig. 28.3B). The two less prevalent granulocyte types differ in their location on a scatter plot, with eosinophils typically falling within the granulocyte population while basophils overlap with lymphocytes. Hematopoietic stem cells are normally found in the lymphocyte area of the scatter plot. It is important to recognize that the cell relationships noted above do not necessarily apply in cases of hematopoietic malignancy since neoplastic cells may exhibit altered light scatter properties or appear as a distinct population, separate from normal elements. Current standard practice for identifying the major leukocyte types, and particularly lymphocytes, includes using the pan-leukocyte monoclonal antibody CD45, alone or in combination with the monocyte-specific antibody CD14. CD45 is usually included in each staining combination as a specific lymphocyte identifier (characteristically bright staining) when red cell lysis is inadequate (Fig. 28.4) or substantial numbers of non-lymphocytes or debris contaminate the lymphocyte gate.16 Malignant cells also may differ from their normal counterparts in their staining characteristics with a variety of reagents, including CD45 expression (Figs. 28.5 and 28.6). The correlated analysis of side scatter and CD45 with or without appropriate sequential gating of subpopulations of interest is extremely helpful in recognizing hemopoietic and lymphoid neoplasia.17
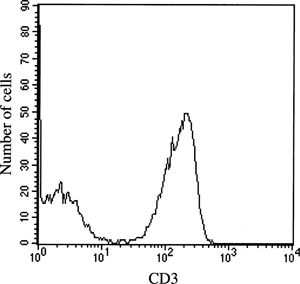
FIGURE 28.1 Single-parameter histogram, a distribution plot of CD3 fluorescence intensity (x-axis) versus number of events/cells (y-axis) evaluating lymphocytes.
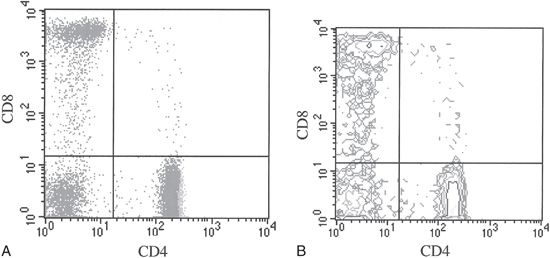
FIGURE 28.2 A. Dot plot of two-color (CD4 and CD8) staining evaluating lymphocytes. Frequency of events is reflected by the number of dots. B. Contour plot of two-color (CD4 and CD8) staining evaluating lymphocytes. Frequency of events is reflected by the contour levels.
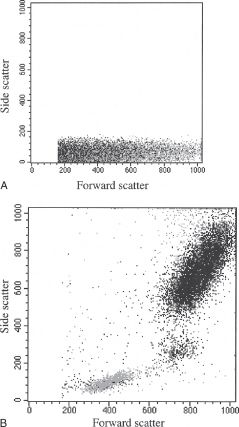
FIGURE 28.3 (A) Dot plot of forward scatter (x-axis) versus side scatter (y-axis) on nonlysed whole blood sample (B) dot plot of forward scatter (x-axis) versus side scatter (y-axis) on lysed whole blood sample demonstrating a three-part leukocyte differential: lymphocytes, monocytes, and granulocytes.
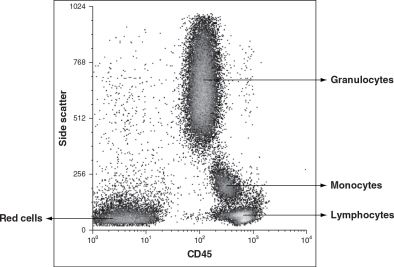
FIGURE 28.4 Side scatter and CD45 analysis of normal peripheral blood demonstrates distinct clusters of granulocytes, monocytes, lymphocytes, and residual red cells.
The interpretation of fluorescent data based on antibody binding reflects the biology of the particular cognate cell surface protein. When the monoclonal reagent identifies exclusively one cell population, data interpretation is unambiguous, as for the pan-T-cell marker CD3 shown in Figure 28.1. In this example, when the evaluation is confined to lymphocytes using a lymphocyte gate, there clearly are two populations, CD3 negative cells, including B and natural killer (NK) lymphocytes, and CD3 positive T cells. In other situations, biologic variability in surface protein expression impacts data interpretation; examples are shown in Figures 28.7 and 28.8. In both histograms, there are at least three cell populations: cells negative for the marker, cells showing intermediate fluorescence, and cells that have bright fluorescence. In Figure 28.7, the CD8 intermediate cells are predominantly NK cells, while the bright staining cells are primarily CD8 positive T cells. In Figure 28.8A, the CD4 intermediate staining cells are monocytes, while the bright staining cells are T cells, with the former being present only in very small numbers with proper gating on lymphocytes (Fig. 28.8B). The finding of low-density CD4 expression on monocytes helps to explain HIV infection of this cell lineage.
Many monoclonal antibodies, individually or in combination, can serve to distinguish cells of a specific lineage (Table 28.1
Related posts:

Stay updated, free articles. Join our Telegram channel

Full access? Get Clinical Tree


