At the conclusion of this chapter, the reader should be able to: • Identify and give examples of the three phases in automated testing. • Describe the principle, advantages, and disadvantages of nephelometry. • Discuss the analysis and clinical implications of cryoglobulins. • Explain the principle of flow cell cytometry and cite clinical applications. • Discuss current trends in immunoassay. • List at least three potential benefits of automated immunoassay. • Analyze a case study related to immunoassay. • Correctly answer case study related multiple choice questions. • Be prepared to participate in a discussion of critical thinking questions. • View and discuss questions related to videos about flow cytometry. The analytic phase involves the following areas: The postanalytic phase includes adding to patient cumulative reports, workload recording, and networks to other systems. Quality assurance (QA) procedures, including the use of quality control (QC) solutions, are part of the analytic functions of the analyzer and its interfaced computer. The Clinical Laboratory Improvement Amendments of 1988 (CLIA ’88) regulations require the documentation of all QC data associated with any test results reported (see Chapter 7). Harmonization of analytes has been gaining momentum as an essential component of the outcomes of analysis. In the future, harmonized or normalized results may be mapped together and presented numerically and graphically to reduce data output. Nephelometry has become increasingly more popular in diagnostic laboratories and depends on the light-scattering properties of antigen-antibody complexes (Fig. 13-1). In immunology, nephelometry is used to measure complement components, immune complexes, and the presence of a variety of antibodies (Box 13-1). The electromagnetic spectrum ranges from long radio waves to short, powerful gamma rays (Fig. 13-2). Within this spectrum is a narrow band of visible or white light, composed of red, orange, yellow, green, blue, and violet light. Laser (light amplification by stimulated emission of radiation) light ranges from the ultraviolet (UV) and infrared (IR) spectrum through all the colors of the rainbow. In contrast to other diffuse forms of radiation, laser light is concentrated. It is almost exclusively of one wavelength or color, and its parallel waves travel in one direction. Through the use of fluorescent dyes, laser light can occur in numerous wavelengths. Types of lasers include glass-filled tubes of helium and neon (most common), yttrium-aluminum-garnet (YAG; an imitation diamond), argon, and krypton. A suspension of stained cells is pressurized using gas and transported through plastic tubing to a flow chamber within the instrument (Fig. 13-3). In the flow chamber, the specimen is injected through a needle into a stream of physiologic saline called the sheath. The sheath and specimen both exit the flow chamber through a 75-µm orifice. This laminar flow design confines the cells to the center of the saline sheath, with the cells moving in single file. Monoclonal antibodies, identified by a cluster designation (CD), are used in most flow cytometry immunophenotyping (Table 13-1). Cell surface molecules recognized by monoclonal antibodies are called antigens because antibodies can be produced against them or are called markers because they identify and discriminate between (mark) different cell populations. Markers can be grouped into several categories. Some are specific for cells of a particular lineage (e.g., CD4+ lymphocytes) or maturational pathway (e.g., CD34+ progenitor stem cells); the expression of others can vary, according to the state of activation or differentiation of the same cells.
Automated Procedures
Characteristics of Automated Testing
Nephelometry
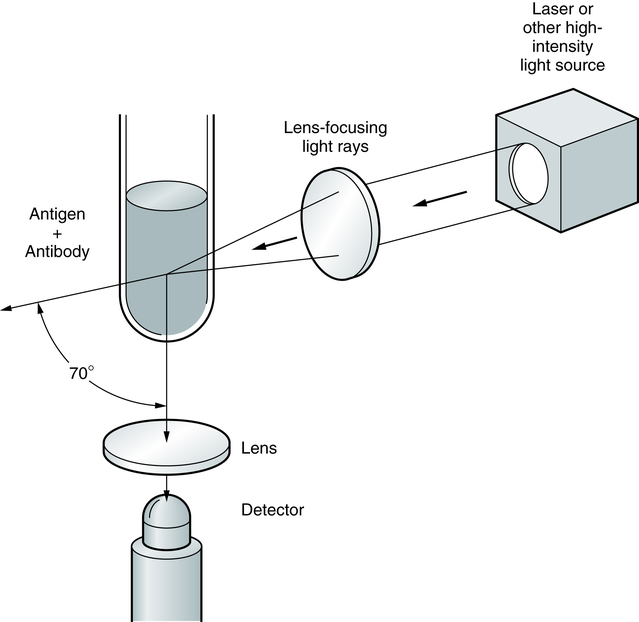
Light rays are collected in a focusing lens and can ultimately be related to the antigen or antibody concentration in a sample.
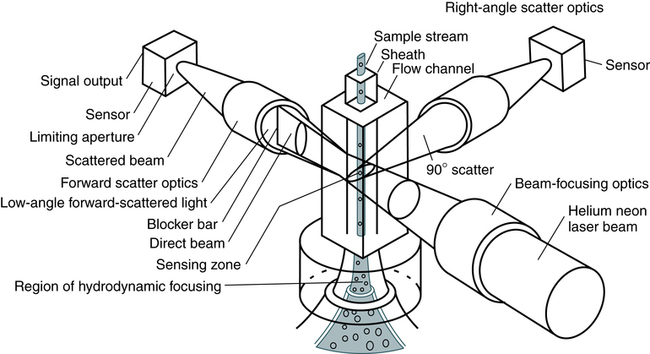
Flow Cell Cytometry
Fundamentals of Laser Technology
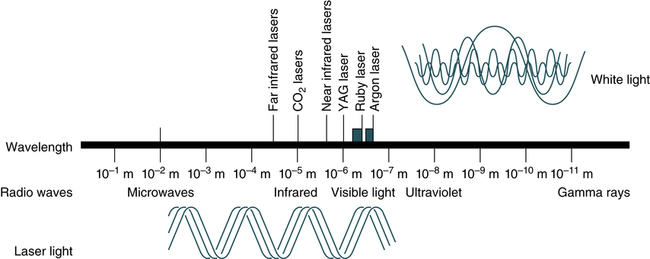
YAG, Yttrium-aluminum-garnet. (From Turgeon ML: Clinical hematology: theory and procedures, ed 5, Philadelphia, 2012, Lippincott, Williams & Wilkins.)
Principles of Cell Cytometry
Immunophenotyping
Automated Procedures