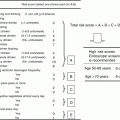
Fig. 13.1
Step-wise workflow for urinary metabolomic analysis to identify biomarkers of alcohol-induced liver disease (ALD). Wild-type and Ppara-null B6 and 129S mice were placed in the 4 % EtOH or control group. After 1 month of alcohol treatment, histological and biochemical analysis was performed to confirm ALD onset in Ppara-null mice. From 2 to 6 months, 24 h urine samples were collected monthly and subjected to UPLC-ESI-QTOFMS analysis, multivariate and pathway analyses, and identification and quantitation of urinary metabolites
13.2.2 Step 1: Preparation of Urine Samples for UPLC-ESI-QTOFMS Analysis
Urine was diluted 1:2 (v/v) with 50 % aqueous acetonitrile containing internal standards (50 μM 4-nitrobenzoic acid and 1 μM debrisoquine) in a Sirroco™ protein precipitation plate (Waters Corp.) and briefly vortexed. The deproteinated extracts were collected into 96-well collection plates under vacuum, and a 5 μL aliquot was injected into a Waters UPLC-ESI-QTOFMS system.
13.2.3 Step 2: UPLC-ESI-QTOFMS Analysis of Urine Samples
An Acquity UPLC BEH C18 column (1.7 μm, 2.1 × 50 mm, Waters Corp.) was used for chromatographic separation of metabolites before introduction into electrospray. The mobile phase comprised of a mixture of 0.1 % aqueous formic acid (A) and acetonitrile containing 0.1 % formic acid (B). A 0.5 mL/min flow rate was maintained over a 10-min run with a gradient elution: 2 % B for 0.5 min, 2–20 % B in 4 min, 20–95 % B in 8 min, 95–99 % B in 8.1 min, holding at 99% B up to 9.0 min, bringing back to 2 % at 9.1 min and holding at 2 % till end. Column temperature was maintained at 40 °C throughout sample runs. The QTOF Premier mass spectrometer was operated in electrospray ionization positive (ESI+) and negative (ESI−) mode. Capillary voltage and cone voltage were maintained at 3 kV and 20 V, respectively. Source and desolvation temperatures were set at 120 °C and 350 °C, respectively. Nitrogen was used as both cone gas (50 L/h) and desolvation gas (600 L/h), and argon was used as collision gas. Sulfadimethoxine was used as the lock mass (m/z 311.0814+) for accurate mass calibration in real time. Collision energy ranging from 10 to 40 eV was applied for MS/MS fragmentation of target ions. All urine samples were analyzed in a randomized fashion to avoid complications due to artifacts related to injection order and changes in instrument efficiency.
13.2.4 Step 3: Data Deconvolution and Feature Extraction
Ion chromatogram and mass spectral data were acquired using MassLynx software (Waters Corp.) in centroid format. Chromatograms were inspected for consistency of sample injection, reproducibility of retention time, and mass accuracy using internal standards and quality control samples. Data was binned, features extracted and area under the peak was calculated through integration using MarkerLynx software (Waters Corp.)
13.2.5 Step 4: Multivariate Data Analysis
Individual ion intensities were normalized with respect to the total ion count (TIC) in order to generate a data matrix consisting of the retention time, m/z value, and the normalized peak area. The data matrix was analyzed by SIMCA-P+12 software (Umetrics, Kennelon, NJ). Unsupervised segregation of control and alcohol-treated metabolomes was checked by principal components analysis (PCA) using Pareto-scaled data [39]. The supervised orthogonal projection to latent structures (OPLS) model was used to identify ions that contributed significantly to group discrimination. OPLS analysis concentrated group discrimination into the first component with remaining unrelated variation contained in subsequent components. The magnitude of the parameter p(corr)[1] obtained from the loadings S-plot generated by OPLS analysis correlates with the group discriminating power of a variable. A list of ions was then generated from the loadings S-plot showing considerable group discriminating power (−0.8 > p(corr)[1] or p(corr)[1] > 0.8) (statistically significant (P < 0.05) difference in relative abundance between control and alcohol-treated animals). The p(corr)[1] values represent the interclass difference and w(1) values indicate the relative abundance of the ions. Ions that contribute highly to the interclass differences were selected for further identification and quantitation as candidate biomarkers.
13.2.6 Step 5: Metabolic Pathway Analysis
MassTRIX (http://metabolomics.helmholtz-muenchen.de/masstrix/) is a web-based tool designed to assign ions of interest from a metabolomics experiment to annotated pathways [40]. It can be used to find metabolic pathways even without any systematic identification [41]. This was used to identify metabolic pathways affected by alcohol treatment. The masses of the ions that are significantly elevated (p(corr)[1] > 0.8) or depleted (p(corr)[1] < −0.8) upon alcohol treatment were used to identify metabolic pathways of interest using the KEGG (http://www.genome.jp/kegg/) database (including HMDB, Lipidmaps, and updated KEGG). A mass error of <5 ppm in the respective ionization modes and the possibility of formation of Na+-adducts in the electrosprayer (ESI+ mode) was also taken into account.
13.2.7 Step 6: Identification of Urinary Biomarkers
Elemental compositions were derived using the Seven Golden Rules [42] considering a mass error <5 ppm. Possible candidates were also searched using metabolomic databases [43, 44]. Finally, authentic standards were used to confirm the identities of these ions by comparison of retention time (UPLC) and fragmentation pattern (ESI-MS/MS). Sulfatase (Sigma-Aldrich) treatment followed by retention time and fragmentation comparison of deconjugated metabolites with authentic standards, were used to confirm sulfate conjugates. Urine samples and standards were incubated with 40 U/mL of the enzyme solution in 200 mM sodium acetate buffer (pH 5.0) overnight at 37 °C. The enzyme and other particulates were precipitated with 50 % aqueous acetonitrile, and the supernatant was analyzed by UPLC-ESI-QTOFMS/MS. 4-Nitrocatechol sulfate was used as a positive control for the sulfatase activity. Deconjugation was also carried out using acid hydrolysis by heating the urine samples with 6 M HCl at 100 °C for 1 h under refluxing conditions.
13.2.8 Step 7: Quantitation of Urinary Metabolites
An Acquity® UPLC system coupled with a XEVO™ triple-quadrupole tandem mass spectrometer (Waters Corp.) was used to quantitate urinary metabolites by multiple reaction monitoring (MRM). Standard compounds were mixed together to optimize the condition for separation and detection of metabolites from a complex mixture such as urine. Standard calibration plots for quantitation were generated using authentic standards. Deproteinated urine samples containing 0.5 μM debrisoquine (internal standard) were analyzed in the same fashion as that of authentic compounds. The mobile phase was comprised of 0.1 % aqueous formic acid (A) and acetonitrile containing 0.1 % formic acid (B). The gradient elution was performed over 6 min at a flow rate of 0.3 mL using: 1–99 % B in 4 min, holding at 99%B up to 5.0 min, bringing back to 1 % at 5.5 min and holding at 1 % till end. The area under the peak for each metabolite was divided by that for the internal standard to calculate response and a serial dilution was performed to generate a standard calibration plot of response vs. concentration. Serially diluted urine samples containing 0.5 μM debrisoquine were analyzed in the same way as the authentic standards. The quantitative abundances were calculated from the response using the linear range of detection of the calibration plot. All analyses were performed using TargetLynx software (Waters Corp.). One-way ANOVA with Bonferroni’s correction for multiple comparisons was performed using GraphPad Prism 4 software (San Diego, CA) with a two-sided P < 0.05 considered statistically significant.
According to their fragmentation pattern, the following MRM transitions were monitored for the respective compounds: indole-3-lactic acid (206→118; ESI+), indole-3-pyruvic acid (204→130; ESI+), tryptophan (205→118; ESI+), 2-hydroxyphenylacetic acid (151→107; ESI−), 4-hydroxyphenylacetic acid (151→107; ESI−), adipic acid (147→101; ESI+), pimelic acid (159→97; ESI−), debrisoquine (176→134; ESI+), phenylalanine (166→120; ESI+), phenyllactic acid (165→103; ESI−), suberic acid (173→111; ESI−), N-hexanoylglycine (174→76; ESI+), xanthurenic acid (206→160, ESI−), N-acetylglycine (116→74, ESI−), taurine (124→80, ESI−), and creatinine (114→86; ESI+). All concentrations were normalized with respect to creatinine to account for any change in glomerular filtration rates.
13.2.9 Effect of Genetic Background on Metabolomic Signatures
Genetic background is well-known to influence outcome of alcoholism including alcohol-induced liver disease [4, 5, 13, 14]. Since, metabolome reflects the phenotype; robustness of metabolomic biomarkers against genetic background needs to be investigated. C57BL/6 (B6) and 129/Sv has earlier shown to differ considerabl with respect to physiological functions [45] as well as the biochemical response and outcome of xenobiotic insults [46, 47]. Thus these two strains of mice were used to characterize the influence of genetic background on overall metabolome and ALD biomarkers.
13.3 Animal Study Design
Study 1: Identification of ALD-associated metabolic signatures in Ppara-null Mice.
Male (6- to-8-week-old, N = 4/group) wild-type and Ppara-null on 129/Sv background were fed a 4 % ethanol-containing liquid diet ad libitum (Lieber-DeCarli Diet, Dyets, Inc.). Control animals (N = 4/group) were fed an isocaloric diet supplemented with maltose dextran ad libitum (Dyets, Inc.).
Study 2: Identification of genetic background-independent ALD biomarkers.
The design in Study 1 was replicated but with the addition of two genetic backgrounds: wild-type and Ppara-null mice (6- to 8-week-old male, N = 4/group) on B6 (C57BL/6 N-Ppara<tm1Gonz>/N) as well as their counterparts on a 129/Sv (129S4/SvJae-Ppara<tm1Gonz>/N) background.
In both studies, a subset of mice were euthanized after 1 month on the alcohol diet, serum was collected, and portions of the liver were harvested for histology to confirm that Ppara-null mice were developing steatosis. Livers were formalin-fixed, paraffin-embedded, sectioned, and stained with hematoxylin and eosin. Serum AST and ALT activities were measured using VetSpec™ kits (Catachem, Inc.). Liver and serum triglycerides were estimated using a colorimetric assay kit from Wako. At 2 months, after mice were accustomed well to the liquid diets, they were transferred to a urinary metabolomics protocol where urine samples were collected monthly using Nalgene metabolic cages (Tecniplast USA, Inc.). Urines were collected over 24 h and stored at −80 °C in glass vials until analyzed. All mice were acclimated to the metabolic cages by placing them in the metabolic cages before the actual sample collection.
13.4 Results and Discussion
13.4.1 PCA Analysis of Metabolomic Data
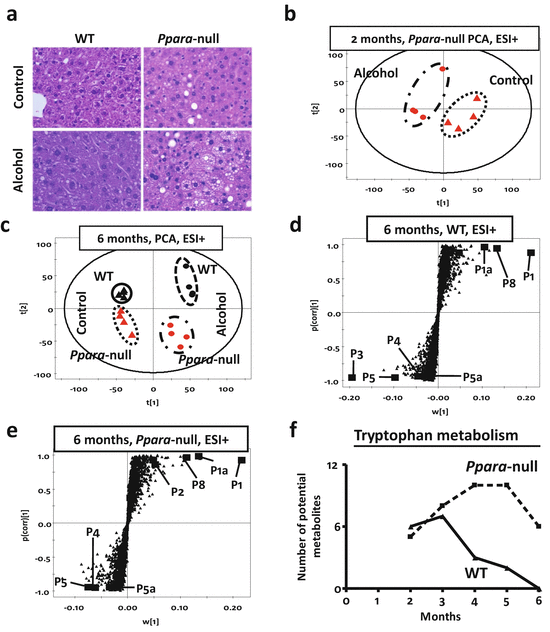
In agreement with an earlier report [26], only Ppara-null mice on alcohol treatment showed lipid accumulation after 1 month (Fig. 13.2a) indicating ALD onset [48, 49]. Mass spectrometry-based metabolomic analysis revealed that alcohol exposed Ppara-null mice had a distinct urinary metabolic profile compared to those on control diet even at the earliest time point, i.e., after 2 months of alcohol treatment (Fig. 13.2b). After 6 months of alcohol treatment, when Ppara-null mice exclusively developed alcoholic steatosis, the urinary metabolomic data showed distinct segregation of control and alcohol-treated mice as well as wild-type and Ppara-null animals on the scores-scatter plot for unsupervised principal components analysis (Fig. 13.2c). These data indicated that each of these four groups represents a distinct metabolic signature. The separation of these mice along first principal component was according to their alcohol exposure. Interestingly, the separation along second principal component, which was influenced by the genotype, was more prominent in Ppara-null mice compared to wild-type. This indicated that in agreement with the liver pathology, the Ppara-null metabolome is also more susceptible to chronic alcohol consumption. Subsequently, supervised orthogonal projection to latent structures (OPLS) analysis was performed. As the loadings S-plots showed (Fig. 13.2d, e) there were a number of ions that showed similar trends of elevation (such as P1, P1a, and P8) or depletion (such as P4, P5, and P5a) on alcohol treatment in both wild-type and Ppara-null mice. However, few ions were found to be exclusively elevated (such as P2) in the urine of alcohol-treated Ppara-null mice (Fig. 13.2e) that developed ALD. These ions might represent ALD-specific metabolic derangements.


Fig. 13.2
(a) Liver histology (HE stain) of wild-type (WT, left panel) and peroxisome proliferator-activated receptor alpha knockout (Ppara-null, right panel) mice after a duration of 1 month on control (upper panel) or 4 % alcohol-containing liquid diet (lower panel). Histology shows increased fat deposition in Ppara-null animals on the 4 % alcohol containing liquid diet. (b) Scores scatter plot from principal components analysis (PCA) showing unsupervised segregation of the urinary metabolome (ESI+ mode) from control and alcohol-treated Ppara-null mice at 2 months. (c) PCA scores scatter plot showing a larger difference between wild-type and Ppara-null metabolomic data as a result of chronic alcohol treatment (over 6 months). The triangles and dots indicate mice on control and alcoholic diet, respectively, with black and red color representing wild-type and Ppara-null mice, respectively. (d) Loading S-plots from the supervised orthogonal projection to latent structures (OPLS) analysis of ESI+ mode metabolic signatures (at 6 months) for candidate markers of chronic alcohol exposure in wild-type and (e) Ppara-null mice. Each triangle represents an ion characterized by unique mass and retention time. Representative candidates have been highlighted (solid box) in the plots. A differential response was characterized by biomarkers that were exclusive to wild-type (P3) or Ppara-null (P2) mice. (f) MassTRIX analysis of putative metabolites related to tryptophan metabolism detected in ESI+ mode show variation over time during alcohol treatment. The solid and dotted lines represent wild-type and Ppara-null animals, respectively
13.4.2 Metabolic Pathway Analysis
To further identify possible metabolic pathways affected by alcohol treatment and ALD pathogenesis, ions that significantly contributed to the separation of alcohol-treated and control animals were analyzed using MassTRIX. Following alcohol exposure, metabolites potentially originating from tryptophan metabolism were found to be significantly significantly elevated (Fig. 13.2f). However, in wild-type animals, the number of such metabolites gradually decreased over time, while in Ppara-null animals, the corresponding number of metabolites increased. Thus, the MassTRIX analysis indicated that alcohol consumption impacted tryptophan metabolism more in the Ppara-null mice as compared to wild-type mice.
13.4.3 Identification and Quantitation of Metabolites
Identities of a number of these ions were subsequently confirmed using authentic standard and their concentrations were measured. Tables 13.1 and 13.2 show metabolites deranged in the urine of wild-type and Ppara-null mice on alcohol treatment. Both wild-type and Ppara-null animals showed an elevation of ethanol metabolites such as ethyl sulfate and ethyl-β-d-glucuronide, albeit to a different extent. In addition, metabolites such as 2-hydroxyphenylacetic acid, 4-hydroxyphenylacetic acid, 4-hydroxyphenylacetic acid sulfate and xanthurenic acid were elevated, whereas adipic acid and pimelic acid were depleted in the urine of alcohol-treated mice. Similar to alcohol metabolites, many of these endogenous metabolites also showed significant difference in their excretion in wild-type and Ppara-null animals. However, it was interesting to note that indole-3-lactic acid was exclusively elevated in the urine of alcohol-treated Ppara-null mice (Fig. 13.2a, b).
Table 13.1
Metabolic signature of chronic alcohol exposure in the wild-type mice
Identity | Putative origin | Trend in B6 | Trend in 129S |
|---|---|---|---|
Ethyl sulfate | Alcohol metabolism | − | ↑ |
Ethyl-β-d-glucuronide | Alcohol metabolism | ↑ | ↑ |
N-Acetylglycine | Alcohol metabolism | ↑ | ↑ |
4-Hydroxyphenylacetic acid | Phenylalanine metabolism and gut flora | − | ↑ |
4-Hydroxyphenylacetic acid sulfate | Phenylalanine metabolism and gut flora | − | ↑ |
2-Hydroxyphenylacetic acid | Phenylalanine metabolism and gut flora | − | ↓ |
Xanthurenic acid | Tryptophan metabolism and gut flora | ↑ | − |
Adipic acid | Fatty acid ω-oxidation | − | ↓ |
Pimelic acid | Fatty acid ω-oxidation | − | ↓ |
Taurine | Cysteine metabolism | ↓ | ↑ |
N-hexanoylglycine | Fatty acid β-oxidation and gut flora | ↑ | − |
Table 13.2
Metabolic signature of chronic alcohol exposure in the Ppara-null mice
Identity | Putative origin | Trend in B6 | Trend in 129S |
|---|---|---|---|
Ethyl sulfate | Alcohol metabolism | − | ↑ |
Ethyl-β-d-glucuronide | Alcohol metabolism | ↑ | ↑ |
N-Acetylglycine | Alcohol metabolism | ↑ | ↑ |
4-Hydroxyphenylacetic acid | Phenylalanine metabolism and gut flora | − | ↑ |
4-Hydroxyphenylacetic acid sulfate | Phenylalanine metabolism and gut flora | − | ↑ |
2-Hydroxyphenylacetic acid | Phenylalanine metabolism and gut flora | − | ↓ |
Xanthurenic acid | Tryptophan metabolism and gut flora | ↑ | − |
Adipic acid | Fatty acid ω-oxidation | − | ↓ |
Pimelic acid | Fatty acid ω-oxidation | − | ↓ |
Taurine | Cysteine metabolism | ↓ | ↑ |
Indole-3-lactic acid | Tryptophan metabolism | ↑ | ↑ |
Phenyllactic acid | Phenylalanine metabolism | ↑ | ↑ |
For biomarker discovery, reproducibility of measurements is a very important issue. Nuclear magnetic resonance (NMR)-based metabolic profiling has an advantage of being very reproducible as well as for giving direct structural information about the metabolite. However, it is interesting to note that concentrations of indole-3-lactic acid in these urine samples were in the low micromolar range. The sensitivity of the analytical method used for measuring changes in the metabolic profile becomes crucial to detect changes in the excretion of such metabolites. NMR typically fails to capture changes in abundance of metabolites at these concentration levels whereas mass spectrometry, as evident from these results, is sensitive enough to measure concentrations down to nanomolar and even picomolar ranges. Thus in spite of inferior reproducibility compared to NMR, mass spectrometry has a distinct advantage in increasing sensitivity and capturing miniscule changes in excretion of larger number of metabolites present in such low concentrations. Mass spectrometry can also increase the chance of identification novel metabolites that may be low in abundance but specific to the pathology. On the other hand, NMR typically measures only few hundreds of known and relatively abundant metabolites. Thus, mass spectrometry is often superior as a platform, particularly, for discovery of metabolic biomarkers.
Stay updated, free articles. Join our Telegram channel

Full access? Get Clinical Tree


