Application of Environmental Epidemiology in the Investigation of Infectious Disease Outbreaks – A Case Study*
Outline
Severe acute respiratory syndrome (SARS) is the first new infectious disease of the 21st century that has attracted global attention. In an epidemic that affected many parts of the world in 2003, Hong Kong was the hardest hit area. It had the highest incidence (attack) rate, with 1755 probable cases [World Health Organization (WHO) definition] in a population of around 6.7 million, and a high case-fatality ratio of 17.0% (299 deaths in 1755 probable cases) [1]. In fact, the infection in Hong Kong was believed to be the source of the spread of the disease to many other countries [2].
By late March 2003, people in Hong Kong was already in a panic state, knowing that a new deadly infectious disease had entered into Hong Kong and was already spreading in the territory, but not knowing enough about the nature of the disease to take proper preventive measures. Then, within a few days at the end of March and the beginning of April, more than 200 persons were admitted to a public hospital in eastern Kowloon for SARS. Most of them were residents of a private housing estate near the hospital – the Amoy Gardens (with 19 high-rise residential buildings). The government health authority reacted by first isolating the building with the largest number of cases (Block E) and forbidding residents to leave the building. This erroneous action was later corrected by moving all residents out to a campsite for quarantine.
An investigation in the Amoy Gardens was started with the participation of a number of government departments [3]. According to the report of the investigation, the index patient, who acquired SARS infection after staying in a public hospital, visited Flat 7 on a middle floor of Block E on March 14 and again on March 19 and used the toilet; the patient had diarrhea. By mid-April, 321 cases had been reported and over 80% of cases were residents in four buildings blocks (B, C, D, and E) and those living at or above 10th Floor were more affected. The symptom onset date peaked on March 24 and declined steadily afterwards. Block E cases appeared earlier and showed a point-source distribution. Cases in other blocks appeared 3 days later and were more evenly spread out in time. It was believed that the index patient initially infected a relatively small group of residents in Block E. Subsequent spread to other residents in Block E was through the sewage system, person-to-person contact and the use of shared communal facilities. Further transmission to other blocks was through person-to person contact and environmental contamination.
Unfortunately, only the main findings were summarized, but the full (detailed) report with supporting data was not released. However, the explanations given in the government investigation report could not adequately account for all the features of the outbreak and many questions remained unanswered, especially with regard to the mode of transmission.
1. Background
We must admit that we knew so little about SARS at the time of the epidemic and hence should keep our minds open to all possibilities about the modes of transmission. Epidemiology is about the distribution and determinants of disease frequencies in human populations. Hence, the distribution of the disease should act as the starting point in studying the epidemiology of a disease. The common parameters used to describe the distribution of disease include time, place and person. The authors did not have access to the full set of data of the outbreak in the Amoy Gardens, but managed to obtain information on the location of residence and date of fever onset for the initial 187 cases investigated by the Department of Health.
1.1 Time, place and person distributions
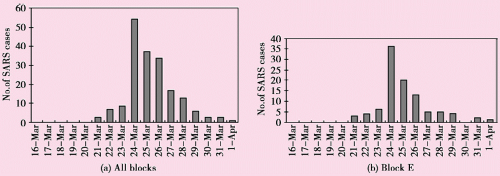
We first described the distribution of cases according to date of symptom onset and location of residence. The time distribution (epidemic curve) of cases in Block E alone indicated a point-source (common source) outbreak. A similar pattern was also observed for all cases in the four blocks (B, C, D, and E) in the Amoy Gardens (Figure 10.1). The epidemic started on March 21, 2003 in Block E, and in the majority of cases among residents in all buildings, the onset of symptoms occurred during three days, March 24 to 26, with the peak (mode) on March 24. The lag time in symptom onset among the cases was simply too short for effective personto-person spread, given the understanding of the incubation period for SARS of 2-10 days. Other modes of transmission have to be examined.
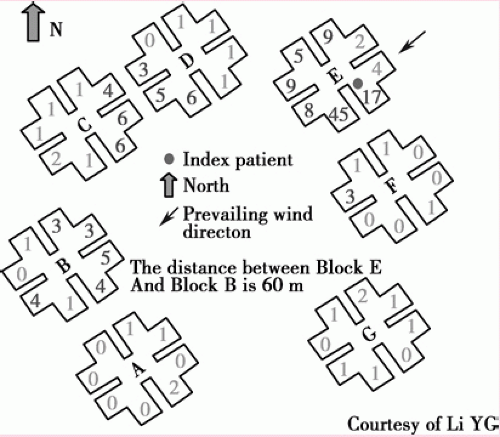
The distribution of the cases was not even or random among the housing blocks. Within each block, more cases occurred in certain units (Flats) and floor levels. Block E had the largest number of cases (99/187) and Units 7 and 8 of Block E were more affected (17 and 45 cases respectively (Figure 10.2). Very few cases of SARS were reported in apartments below the 10th Floor. The spatial distribution of SARS cases was not random and could provide information for the generation of hypothesis on the determinants of the disease spread. If the disease were mainly spread through the sewage system, apartments in the lower floors of Block E should receive a higher dose of the virus and there should be more cases in those apartments. If the disease were mainly spread through person-to-person
contacts and the use of shared communal facilities (elevators/staircases), it would be hard to explain why many more cases occurred in certain units (flats) in each block, and residents in Block F (the block closest to Block E) should be more affected instead of those living in Blocks B, C and, D during the outbreak.
contacts and the use of shared communal facilities (elevators/staircases), it would be hard to explain why many more cases occurred in certain units (flats) in each block, and residents in Block F (the block closest to Block E) should be more affected instead of those living in Blocks B, C and, D during the outbreak.
We were not able to obtain personal data (age, sex, co-morbidity, etc.) of the infected persons to allow us to describe the distribution among persons. The government report mentioned that only 4% of cases had history of contact with known SARS patients and 8% had visited the Mainland between 17 and 23 of March.
1.2 Where should we go from here? Examining possible modes of transmission
Obviously, this was a common or point source outbreak (Figure 1) and the spatial distribution followed a particular pattern (Figure 2). The logical next step would be to examine the known modes of transmission of infectious diseases and see if any of them could explain the spread in this outbreak.
It was unlikely, if not impossible, for the index case to come into contact with hundreds of residents living in several building blocks within a short period of time (about 1-2 days). Hence, person-to-person spreads could at most explain only a very small proportion of the outbreak, but might become more important in the latter phase of the epidemic. It was postulated that the outbreak could have been vector-borne, as the SARS coronavirus was detected in rodent droppings and bodies of cockroaches [3].
Ng put forward the theory that roof rats were both amplifiers and distributors of the SARS-associated coronavirus [4], but this theory was not supported by the epidemiological distribution of cases; the middle-level floors were affected more than the upper floors, and certain units were affected more than others in the same building. Roof rats are by nature territorial, and they therefore could not be responsible for the rapid and efficient spread of the infection from a single building, building E, to other buildings. The main flaw in this hypothesis is that it does not explain the steep decline in the epidemic curve after the peak, because there was no sudden disappearance of roof rats or massive deaths among them. The point-source nature of the outbreak and the spatial distribution of the cases also argued against other vectors being primarily responsible for the transmission.
Stay updated, free articles. Join our Telegram channel

Full access? Get Clinical Tree


