RIC regimens can be associated with increased relapsed rates as noted earlier. Attempts to add TBI to RIC chemotherapy regimens to improve relapse rates have been challenging because of additional toxicities. For example Petropolous et al. (2006) reported that combining 9 Gy (3 Gy/day) TBI with the RIC regimen fludarabine (Flu) and melphalan (Mel) was not possible in adults because of increased mucositis. More targeted forms of TBI combined with RIC may be better tolerated and may potentially improve relapse rates compared to RIC chemotherapy regimens alone.
The primary reason for a more targeted form of TBI is to improve the therapeutic ratio by reducing normal organ dose and toxicities allowing for the potential to increase dose to tumor and improve long term outcomes. The available clinical data indicate that there is a dose response for most cancers including acute leukemia. Chloromas (also known as granulocytic or myeloid sarcomas) are extramedullary tumors of myeloid leukemia cells. Although relatively radiosensitive, Chak et al. (1983) demonstrated local control rates at 2 Gy per day of approximately 20% at doses less than 10 Gy, 40% at doses of 10–20 Gy and over 80% at doses of >20 Gy. They recommended a dose of 30 Gy at 2 Gy per day for optimal local control. More recently, Bakst et al. observed only one local failure at 6 Gy and recommended at least 20–24 Gy at 2 Gy/day (Bakst and Wolden 2012).
A dose response relationship has also been observed with the TBI experience. Two randomized phase II single institution trials have compared Cy combined with 12 Gy at 2 Gy/day or 15.75 Gy at 2.25 Gy/day. In a trial of 116 patients with CML in chronic phase, the higher dose resulted in a significantly lower relapse rate (0% vs. 25% p = 0.008), but higher treatment related mortality rate (24% 12 Gy and 34% 15.75 Gy, p = 0.13), and as a result no significant change in overall survival (Clift et al. 1991). In a separate report of 71 patients with AML in first remission, relapse rate was also decreased with the higher dose (14% vs. 39% p = 0.06), but these gains were offset by an increase in TRM rate (38% vs. 19%, p = 0.05), resulting in no difference in overall survival between the two arms (Clift et al. 1998). The increase in TRM rate was due to an increase in lung, liver and mucous membrane toxicities (Appelbaum et al. 1992). In several retrospective reports from the group in Genoa (Scarpati et al. 1989), relapse rate and survival was significantly decreased if TBI dose was >9.9 Gy (3.3 Gy/day). In an analysis of the CIBMTR and City of Hope Cancer Center databases, Marks et al. (2006) reported that patients with ALL beyond first remission receiving TBI-CY conditioning regimens had a lower relapse rate and increased disease free survival if the TBI dose was >13 Gy. Finally, Kal et al. (2006), compared results of different TBI regimens published in three randomized trials, four studies comparing results of two to three TBI regimens, and nine studies reporting on one TBI regimen. Using linear-quadratic principles, a biologically effective dose (BED) was calculated for each TBI regimen to normalize for differences in dose per fraction, number of fractions and dose-rates of the different regimens. Higher BED values were associated with a lower relapse rate and higher disease-free survival and overall survival rates.
In summary, despite use of fractionated schedules and organ shielding, escalation of TBI dose has been difficult due to dose-limiting normal tissue toxicities. This has limited total doses of most TBI conditioning regimens to approximately 16 Gy or less. Gains in disease control with TBI dose escalation are associated with an increase in regimen related toxicities and non-relapse mortality in some studies, resulting in no improvement in overall survival. New more targeted strategies are clearly needed to allow further dose escalation without associated increase in side effects. With regards to HCT, two targeted systemic radiotherapy strategies have been evaluated in the clinic and are discussed below, biologically targeted radioimmunotherapy (RIT) and image guided-IMRT based total marrow irradiation (TMI).
4 Radioimmunotherapy: Biologically Targeted Systemic Radiotherapy
Radioimmunotherapy (RIT) is a form of targeted systemic radiotherapy that utilizes monoclonal antibodies or related immunoconstructs linked to radionuclides. Radiolabeled antibodies have been evaluated as a form of therapy in solid tumors and hematopoietic malignancies. A number of detailed reviews on this topic have been published (Jurcic et al. 2016; Speer 2013). This section will focus on the use of RIT as a form of targeted TBI for leukemia.
The majority of the experience has been with antibodies targeting CD20 on B cells in patients with non-Hodgkin’s lymphoma. RIT has also been applied to other hematopoietic malignancies including leukemia. Table 1 lists the antigens that radiolabeled antibodies have been developed against to target AML and ALL. Table 2 lists the radionuclides that have been linked to these antibodies and evaluated in clinical trials.
Table 1
Radioimmunotherapy target antigens in acute leukemia
Target | Disease | Expressed by |
|---|---|---|
CD33 | Myeloid leukemia | Promyelocytes to mature myeloid cells AML blasts (not ALL blasts) Not hematopoietic stem cells or ALL blasts |
CD45 | AML, ALL | Virtually all hematopoietic stem cells except plasma cells 90% of AML and ALL |
CD66 | AML, ALL | Mature myeloid and monocytic cells Not on AML blasts (relies on cross-fire effect) |
CD22 | ALL | B-cell acute lymphoblastic leukemia |
Table 2
Radionuclides used in RIT of acute leukemia
Radionuclide | Particles emitted | Half life | Energy (MeV) | Path length | Comments |
|---|---|---|---|---|---|
Iodine-131 (131I) | β, γ | 8.1 days | 0.6 | 0.8 mm | Dehalogenation |
Yttrium-90 (90Y) | β | 2.7 days | 2.3 | 2.7 mm | Goes to bone, liver |
Rhenium-188 (188Re) | β, γ | 17 h | 2.1 | 2.4 mm | Goes to kidney |
Bismuth-213 (213Bi) | α, γ | 46 min | 6.0 | 84 μm | Requires fast targeting |
Actinium-225 (225Ac) | α, γ | 10 days | 8 | 50–80 μm | Difficult to generate |
Selection of the appropriate radionuclide for RIT is based on availability, half-life, energy path length, and ease of labeling to the antibody. 131I is both a β and γ emitter. The γ emission allows for imaging and assessing biodistribution of the RIT. The β energy emission provides the therapeutic RIT effect. The disadvantage is that γ radiation travels far and increases exposures to normal tissues as well as to surrounding medical personnel. 131I will also disassociate from the antibody, a process called dehalogenation, especially if the antibody is internalized into the cell after antigen binding, which reduces radiation dose to the target cell.
90Y is a radiometal commonly used in RIT and is a pure β emitter. The mean β emission range is approximately 2.7 mm compared to 0.8 mm for 131I 90Y β emissions travel only a few mm and thus mainly affect the cells which are targeted or adjacent malignant cells through what is termed a cross-fire effect. To monitor biodistribution of 90Y RIT requires the co-administration of the same antibody radiolabeled with the γ-emitting radiometal 111In which allows for visualization biodistribution by planar and SPECT imaging. Some have hypothesized that the path length of 90Y β emissions are too long for the treatment of microscopic disease although there are no clinical data to date to support this.
α emitters are the most recent radioisotope to be exploited. α emitters have higher linear energy transfer (LET) than either γ or β emitters. In addition, the effective range of α emitter’s effect is shorter (range of 40–80 μM) thus potentially further reducing the normal toxicity and potentially making it more suitable for the treatment of microscopic disease. The utilization of α-emitters has been limited by their availability and short half-life.
RIT directed against CD33 has been evaluated as single modality therapy in pilot and phase I trials in acute myeloid leukemia. The CD33 antigen is a 67-kD glycoprotein expressed on most myeloid leukemias and leukemia progenitors but not on normal stem cells. Anti-CD33 RIT has been developed and evaluated using the murine M195 and the HuM195 (linituzumab) humanized antibodies by the group at Memorial Sloan-Kettering Cancer Center (MSKCC). A phase I trial at MSKCC reported on the feasibility of administering 131I-CD33 antibodies (M195 and HuM195) in 31 patients and demonstrated that dose escalation to 135 mCi/m2 achieved myelosuppression and allowed 8 patients to proceed to bone marrow transplant, with three patients remaining in complete remission at 59, 87, and 90 months (Burke et al. 2003). Rosenblat et al. (2010) evaluated HuM195 anti-CD33 radiolabeled with the α-emitter 213Bi administered after cytarabine in a Phase I/II trial in patients with newly diagnosed, refractory or relapsed AML. The RIT agent was shown to be tolerable at all dose levels. Although 77% of patients had >20% decrease in marrow blasts with the addition of RIT compared to only 40% with cytarabine alone, the response rate was only 19% at the maximum tolerated dose (MTD) of 37 MBq/kg with a median duration of response of 6 months. Due to the short half life of 213Bi, HuM195 has recently been evaluated in a phase I trial labeled with the α-emitter 225Ac by the same group with an overall response rate of 29% reported (Jurcic et al. 2015).
RIT has also been evaluated as part of conditioning regimens in patients with leukemia undergoing allogeneic HCT. RIT has been combined with established myeloablative or reduced intensity regimens. Table 3 lists select trials that have combined RIT with non-TBI conditioning regimens. Marrow doses have ranged from 3 to 47 Gy with mean marrow doses depending on the agent ranging from 11–36 Gy at the MTD. Almost all trials have demonstrated the feasibility of combining RIT with established conditioning regimens and acceptable TRM rates. Results have been are encouraging, although the experience to date has been limited to phase I and II trials, at a limited number of centers, and in a relatively small number of patients.
Table 3
Select hct trials combining RIT with myeloablative or reduced intensity conditioning regimens
First Author year | Antibody (target) | No. | Disease | HCT | Marrow dose (Gy) | Response | Toxicities |
|---|---|---|---|---|---|---|---|
Burke et al. (2003) Phase I | 131I-M195 or Hu195 (CD33) | 31 | AML relapsed AML refractory CML-AP MDS advanced | Bu/Cy | 2.72–14.7 | 3 CR 59 + , 87 + , and 90 + months | TRM 65% |
Pagel et al. (2006) Phase I/II | 131I-BC8 (CD45) | 46 | AML CR1 | Bu/Cy | 5.3–19 Mean 11.3 | 3 yr DFS 61% | 3 yr TRM 21% |
Pagel et al. (2009) Phase I | 131I-BC8 (CD45) | 58 | AML advanced MDS high risk Age >50 | RIC: Flu + TBI (2 Gy) | 6.3–46.9 At MTD 36 | 1 yr OS 41% | 1 yr TRM 22% |
Mawad et al. (2014) Phase I | 131I-BC8 (CD45) | 58 | AML advanced MDS high risk Age <50 | RIC: Flu + TBI (2 Gy) | 12–43.3 Mean 27 | 1 yr OS 73% 1 yr RFS 67% | 1 yr TRM 0% |
Koenecke et al. (2008) Phase I/II | 188Re-BW 250/183 (CD66) | 21 | AML high risk MDS advanced | Bu/Cy or RIC | 4.95–21.3 Mean 10.9 | DFS 43% median follow-up 42 months | 1 yr TRM 28.6% |
Ringhoffer et al. (2005) Phase I/II | 188Re- or 90Y-BW 250/183 (CD66) | 20 | AML, MDS Age 55–65 | Flu + ATG or Mel | 21.9 ± 8.4 | 1 yr OS 70% 2 yr OS 52% | Cumulative TRM 25% |
Lauter et al. (2009) Phase II | 188Re-BW 250/183 (CD66) | 22 | AML advanced Age >54 | RIC: Flu/Bu/campath | 2 yr OS 40% 2 yr DFS 41% | 2 yr TRM 23% |
Combining RIT with TBI containing regimens has also been evaluated and has demonstrated the limits of dose escalation (Table 4). Matthews et al. (1999) combined 131I-BC8 anti-CD45 RIT with the myeloablative conditioning regimen of 12 Gy TBI and Cy is a phase I trial. RIT was escalated based on estimated dose to the bone marrow. One case of non-engraftment occurred with the combination of 12 Gy TBI and 31 Gy RIT. A RIT marrow dose of 24 Gy in combination with 12 Gy TBI was determined to be the MTD. Bunjes et al. (2002) combined 188Re labeled anti-CD66 RIT with myeloablative conditioning regimen which included TBI to 12 Gy. This agent has greater biodistribution and dose to kidney than other agents. Late renal toxicity was seen in 14% and in 4 of 6 patients if the total renal dose exceeded 12 Gy. Renal toxicity was reduced in a subsequent study of the same agent when renal shielding was utilized with TBI (Zenz et al. 2006).
Table 4
Select HCT Trials Combining RIT and TBI (12 Gy)
First Author year | Antibody (target) | No. | Disease | HCT | RIT marrow dose (Gy) | Response | Toxicities |
|---|---|---|---|---|---|---|---|
Appelbaum et al. (1992) Phase I | 131I-p67 (CD33) | 4 | AML Relapse, second CR | Cy/TBI (12 Gy) | 1.7–5.56 | 3 of 4 CR 195–477 days | Low marrow doses |
Matthews et al. (1999) Phase I | 131I-BC8 (CD45) | 44 | AML, ALL beyond first remission | Cy/TBI (12 Gy) | 4–31 24 at MTD | AML: 7/25 (28%) NED 15-89 months ALL: 3/9 NED at 23, 58, 70 months | One engraftment failure at 31 Gy RIT + 12 Gy TBI |
Bunjes (2002) Phase I/II | 188Re-BW 250/183 (CD66) | 57 | High risk AML and MDS <25% marrow blasts | Cy/TBI (12 Gy) TBI/Cy/TT Bu/Cy | 15.5 ± 5.1 | DFS 54% DFS 64% (n = 44) if <15% blasts DFS 8% (n = 13) if >15% blasts | 14% late renal toxicity Radiation nephropathy in 6 patients (4/6 if > 12 Gy) 26 month TRM 30% |
Zenz et al. (2006) Phase I | 188Re-BW 250/183 (CD66) | 20 | Ph + ALL advanced CML | Bu/Cy or Cy/TBI (12 Gy) kidney shielded to 6 Gy | 13.3 ± 1.1 | 4 yr OS 29% relapse rate cumulative 40% | 1 yr TRM 20% |
RIT as a form of targeted systemic radiotherapy and a form of targeted TBI for acute leukemia patients undergoing HCT is theoretically attractive with encouraging results and acceptable toxicities, yet challenges still remain. The availability of these agents, expertise and resources needed to perform myeloablative RIT is limited to only a few centers. The technology is therefore currently not easily exportable for wide use making further clinical evaluation of these agents beyond the phase I and II trial setting difficult. There is inter-patient variability in the biodistribution and pharmacokinetics for these agents. In many trials, a small subset of patients does not receive the therapy infusion after demonstrating suboptimal biodistribution of the pre-therapy infusion. Although the amount of administered radioactivity and agent is determined by the treating physician, the actual radiation doses to the intended target sites and organs is not and can vary from patient to patient adding a degree of uncertainty to the anticipated toxicities and efficacy.
5 Total Marrow Irradiation: Image Guided Systemic Targeted Radiotherapy
5.1 Background and Rationale
Recent technological advances in radiotherapy systems now allow for the delivery of a image guided IMRT to large regions of the body allowing for more targeted forms of TBI and therefore targeted whole body or systemic radiotherapy. These new forms of image guided targeted TBI are often referred to as total marrow irradiation (TMI). The Tomotherapy HiArt System® was the first system used to deliver targeted TMI. Tomotherapy integrates CT image-guided radiotherapy and helical delivery of IMRT in a single device. Specifically, a 6 MV linear accelerator is mounted on a CT ring gantry and rotates around the patient as the patient translates through the ring. The maximum target size possible is approximately 60 cm in width by approximately 160 cm in length (Beavis 2004). More recently, other groups have successfully used linear accelerators with volumetric arc-based image guided IMRT (also referred to as VMAT) capabilities to deliver TMI (Han et al. 2011; Aydogan et al. 2011; Fogliata et al. 2011; Patel et al. 2014).
The first delivery of TMI as part of the conditioning regimen in patients undergoing autologous or allogeneic HCT began in 2005 (Wong et al. 2006, 2009; Schultheiss et al. 2007; Wong et al. 2013; Somlo et al. 2011; Rosenthal et al. 2011; Stein et al. 2012). Figure 2 shows the typical conformal dose distribution pattern that is achieved to the designated target structure, with simultaneous reduction of dose to critical organs. Table 5 compares the median doses for various normal organs at risk (OAR) delivered through standard TBI to 12 Gy with 50% transmission block lung shielding and electron boost to the underlying chest wall versus TMI to 12 Gy to the skeletal bone. Significant reduction in dose and volume of organ receiving full dose is observed compared to standard TBI for all critical organs.
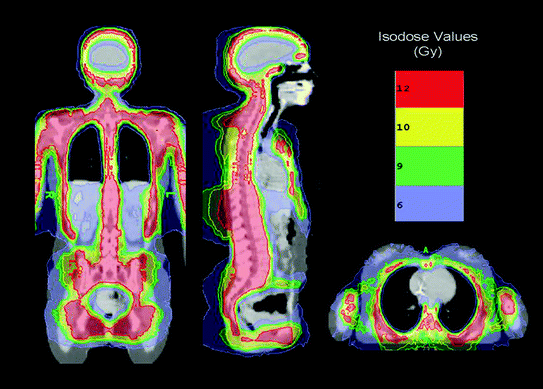

Fig. 2
Radiotherapy dose color wash demonstrating typical dose distribution of a patient treated with TMI. The target structure is skeletal bone
Table 5
Completed TMI Trials at City of Hope
Type of trial (NCT no.) | Type of HCT | Disease type | No. | Targets (dose) | TMI Dose levels (Gy) | Fraction and Schedule | Chemo-therapy |
|---|---|---|---|---|---|---|---|
Phase I (Somlo et al. 2011) (00112827) | Autologous (tandem) | MM stage I-III responding or stable | 25 | bone | 10,12,14,16,18 | 2 Gy QD-BID x 5 days | Mel |
Phase II (Somlo et al.2015) (00112827) | Autologous (tandem) | MM stage I-III responding or stable | 54 | bone | 16 | 2 Gy BID x 5 days | Mel |
Pilot (Rosenthal et al. 2011) (00800150) | Allogeneic | Advanced disease ineligible for myeloablative regimens >50 yrs old, co-morbidities, | 33 | bone, nodes, spleen, testes, brain | 12 | 1.5 Gy BID x 4 days | Flu/ Mel |
Phase I (Wong et al. 2013) (00540995) | Allogeneic | AML, ALL relapsed or refractory with active disease not eligible for standard HCT | 20 | bone, nodes, testes, spleen, liver, brain | 12, 13.5 | 1.5 BID x 4-5 days | BU/ VP16 |
Phase I (Stein et al. 2015) (02446964) | Allogeneic | AML, ALL relapsed or refractory with active disease not eligible for standard HCT | 51 | bone, nodes, testes, spleen, liver, brain | 12, 13.5, 15, 16, 17, 18, 19, 20 | 1.5 BID x 4-5 days | Cy/ VP16 |
This approach offers the treatment team more control of radiation dose delivery to target regions and organs compared to targeted radiopharmaceutical approaches. The physician can simultaneously reduce dose to organs or any other user-defined avoidance structure, while simultaneously increasing dose to particular target regions depending on the tumor burden and clinical situation. Figure 3 shows median organ doses and Fig. 4 lung dose-volume histogram (DVH) plots for standard TBI to 12 Gy versus TMI at 12 and 20 Gy in the same patient. At TMI doses to 20 Gy, median doses to all organs are still below that of TBI to 12 Gy. The lung DVH plots demonstrate that at 20 Gy TMI median lung doses remain below that of TBI 12 Gy with lung shielding but the D80 (minimum dose to at least 80% of the lung volume) is comparable, which predicts for similar pneumonitis risks for TMI 20 Gy and TBI 12 Gy. Table 6 compares median organ doses between TMI plans to 12 Gy (target structure is bone) compared to TBI plans to 12 Gy using 50% transmission blocks to shield lung.
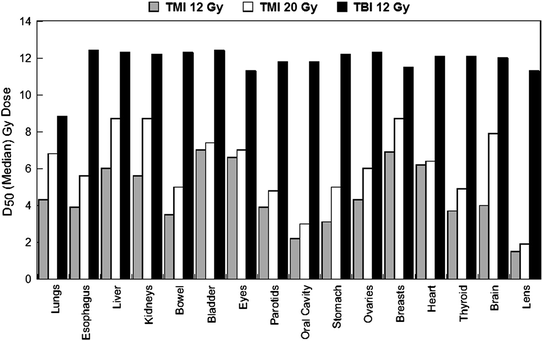
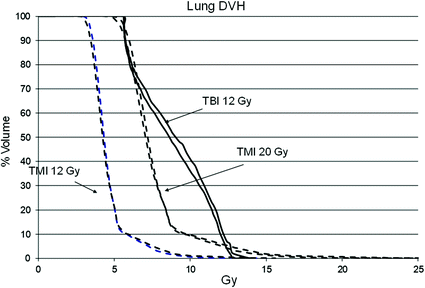

Fig. 3
Median organ doses from treatment plans for TBI 12 Gy, TMI 12 Gy and TMI 20 Gy planned on the same patient. Median organ doses are lower with TMI at 20 Gy compared to TBI 12 Gy, predicting that dose escalation of TMI to 20 Gy in patients should result in lower organ doses and reduced side effects compared to standard TBI 12 Gy

Fig. 4
Comparison of dose-volume histogram (DVH) plots for lung with TMI 12 Gy, TMI 20 Gy versus standard TBI to 12 Gy in the same patient. Standard TBI utilized 10 MV photons to deliver 12 Gy. Fifty percent attenuation blocks were used to shield the lungs. Electrons were used to deliver 6 Gy to the rib cage underlying the lung blocks. The lung DVH plots demonstrate that at 20 Gy TMI median lung doses remain below that of TBI 12 Gy with lung shielding but the D80 (minimum dose to at least 80% of the lung volume) is comparable, suggesting that pneumonitis risks for TMI 20 Gy may be similar to TBI 12 Gy
Table 6
Median dose to normal organs with TMI compared to standard TBI to deliver 12 Gy
Organ at risk | Median dose (Gy) TMI | Median dose (Gy) TBI | TMI/TBI median dose |
|---|---|---|---|
Bladder | 7.5 | 12.3 | 0.61 |
Brain | 7.1 | 12.2 | 0.58 |
Breast | 7.7 | 12.4 | 0.62 |
Esophagus | 4.9 | 11.7 | 0.42 |
Orbits | 6.0 | 12.0 | 0.50 |
Heart | 6.1 | 11.5 | 0.53 |
Lens | 2.3 | 10.5 | 0.22 |
Liver | 6.9 | 11.7 | 0.59 |
Left Kidney | 7.4 | 11.9 | 0.62 |
Right Kidney | 6.9 | 11.9 | 0.58 |
Left Lung | 6.3 | 9.0 | 0.70 |
Right Lung | 6.4 | 9.7 | 0.66 |
Optic Nerve | 6.4 | 12.3 | 0.52 |
Oral Cavity | 2.5 | 12.5 | 0.20 |
Ovary | 7.0 | 12.5 | 0.56 |
Parotids | 4.6 | 13.1 | 0.35 |
Rectum | 4.8 | 12.6 | 0.38 |
Small intestine | 5.0 | 12.5 | 0.40 |
Stomach | 4.6 | 11.5 | 0.40 |
Thyroid | 4.4 | 12.6 | 0.35 |
5.2 Methodology Used at City of Hope
5.2.1 CT Simulation and Immobilization
All patients undergo CT simulation for treatment planning purposes. The patient is scanned supine with arms at side on a CT simulator. Two planning CT scans are performed, one to plan body regions from head to pelvis and the other to plan for lower extremities. The body CT scan is obtained with normal shallow breathing. 4D CT scan data are acquired for chest and abdomen. If 4D CT is not available, shallow inspiration and expiration breath hold CT scans can be acquired instead. The normal shallow breathing CT data set is used for dose calculation and planning. The 4D CT datasets are registered to the planning CT to account for any organ motion during respiration. AccuFormTM (CIVCO Medical Systems, Kalona, IA) cushion is used in combination with Silverman headrest to support and stabilize the head and neck. A body vac-lokTM bag (CIVCO Medical Systems, Kalona, IA) and a thermoplastic head and shoulder mask are used as additional immobilization devices. The patient’s arms, legs and feet are positioned using a vac-lok bag to enhance comfort and repositioning accuracy. Oral contrast is used to help visualize the esophagus. Couch height is approximately 10 cm below the isocenter of the gantry and patient is positioned on the couch so that the top of the head is approximately 5 cm from the end of the couch. Those settings are used to maximize the available length for the CT scanning and treatment delivery.
Target delineation: Target and avoidance structures and normal organs are contoured on an EclipseTM treatment planning system (Varian Medical Systems, Palo Alto, CA) or similar planning system. Avoidance structures contoured are user defined and usually include lungs, heart, kidneys, liver, esophagus, oral cavity, parotid glands, thyroid gland, eyes, lens, optic chiasm and nerves, brain, stomach, small and large intestine, breasts, rectum, testes, ovary and bladder. Depending on the clinical circumstances, clinical trial or center, potential target structures can include skeletal bone, spleen, testes and major lymph node chains. In some clinical trials brain and liver are target structures. The 4D CT datasets are registered to the planning CT so that the contours of ribs, esophagus, kidneys, spleen and liver are enlarged to account for the organ movements during respiration. An additional 3 to 5 cm margin is usually added to the CTV to define the PTV target. Our center has added up to 10 cm margins in areas where larger setup uncertainty is observed, such as in the regions of the shoulder, arms, thighs, and posterior spinous processes. Spinal cord (part of the target) is outlined separately so to avoid hot spots in the spinal canal during planning. At some centers such as City of Hope, the mandible and maxillary bones are excluded from the target in an effort to minimize oral cavity dose and mucositis.
5.2.2 Treatment Planning with a Helical Tomographic Delivery System (Tomotherapy)
DICOM-RT images are transferred to the Hi-ArtTM Tomotherapy treatment planning system (Accuray Inc. Palo Alto, CA). Helical Tomotherapy plan is designed such that a minimum of 85% of the target received the prescribed dose. For the body treatment plan, jaw size of 5 cm, pitch of 0.287 and modulation factor of 2.5 are used for most patients as a balance of treatment time and plan quality. Plan quality index is comprised of target dose uniformity and critical organ doses. Since the first TMI patient treated in 2005, TMI treatment planning efforts at City of Hope have continued to evolve. Median organ doses with current planning methods are now lower than previously published (Wong et al. 2006). Our current approach is to perform plan optimization in two stages. Critical organ sparing is optimized before target dose uniformity optimization is done resulting in being able to escalate target doses without a proportionate increase in normal organ dose (Stein et al. 2015). Legs and feet are planned in Tomo-Direct mode. A 5 cm jaw size is used. Gantry angles of 0 and 180° are selected. Composite dose of body plan and leg plan is generated to double check there is no dose gap or overlap at the junction.
5.2.3 Treatment Planning with a VMAT Conventional Linear Accelerator System
TMI can be planned and treated using a conventional linear accelerators with VMAT capability as well. Multiple dynamic IMRT arcs with usually 3–4 isocenters are used to cover target regions. Collimator angles are varied for each arc to increase the planning degree of freedom and plan quality. After the plan of the body is finalized, the lower extremities are planned with two or three additional AP-PA fields given the lack of sensitive organs in this area. AP-PA fields are opened at 40 cm × 40cm and gapped at 50% isodose line at midplane (Han et al. 2011; Aydogan et al. 2011).
5.2.4 Treatment Delivery
Our current procedure involves initial laser alignment of the patient in the vac-lok bag and thermoplastic mask. Verification CT positioning scans are performed prior to each treatment session using multiple cone beam CT scans (CBCTs) or one megavoltage CT (MVCT) scan from orbit to ischial tuberosities and is fused to the planning CT. Registration and couch shifts are reviewed and approved by attending physician before treatment is delivered. The Tomotherapy has a maximum treatment length of approximately 150 cm. A jaw size of 5 cm and pitch of 0.287 usually result a beam-on of time of approximately 25 min to treat the upper body. On the Tomotherapy system, the patient translates through the unit head first to treat from the head to proximal thighs and is then re-setup and translates through the unit feet first to treat the lower extremities. Treatment of legs has a beam-on of time of approximately 10 min. With a conventional linear accelerator with VMAT capability, it is recommended the verification CBCT to be performed for each isocenter before treatment delivery. The total treatment time is similar to TMI delivery using a helical topographic approach.
Stay updated, free articles. Join our Telegram channel

Full access? Get Clinical Tree


