The regular presence of anti-A and anti-B is made use of in the routine determination of ABO blood groups; in addition to testing red cells for A and B antigens, the group is checked, in serum or ‘reverse’ grouping, by testing the serum against red cells of known ABO groups.
Although H is encoded by a gene on a different chromosome from ABO, the H blood group system is considered in this chapter because H is a precursor of A and B.
Antigens of the ABO System
A brief account of the main phenotypes and genotypes of the ABO system, including the frequency of the common genes in white people, has been given in the preceding chapter.
ABO Phenotypes in Different Populations
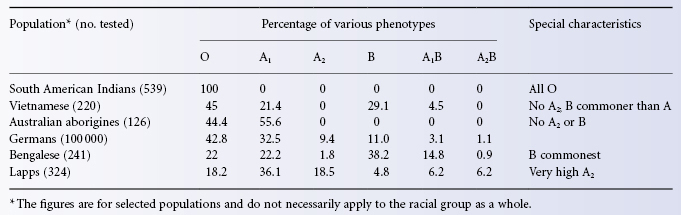
Table 4.2 gives figures for the frequency of ABO phenotypes in selected populations. The figures have been chosen simply to illustrate a few points: for example, South American Indians all belong to group O; in Australian aborigines, only groups O and A are found; in some populations (e.g. Bengalese) the commonest group is B; and, finally, in some populations (e.g. Lapps) there is a relatively high frequency of A2.
Table 4.2 Frequencies of ABO groups in a few selected populations.
Source: Data from Mourant et al. 1976.
In Africans (black people), B is in general a much stronger antigen than in Europeans (white people) (Mourant et al. 1976) and black people have a higher level of B-specified glycosyltransferase in the serum (Badet et al. 1976). Based on quantitative agglutination, about 50% of black people have stronger B than white people (Gibbs et al. 1961). For a discussion of the relative frequency of ABO haemolytic disease of the newborn in group A and B infants, and in different ethnic groups, see Chapter 12.
Structure and Specificity of A and B- Glycosyltransferases
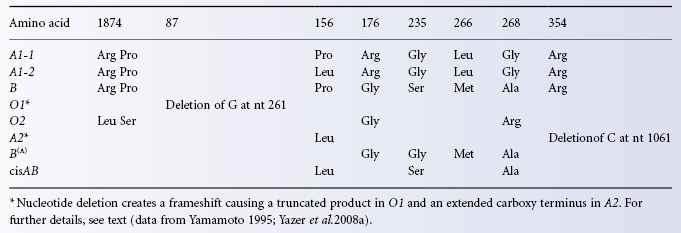
By 1960, chemical analysis of ABH-active glycoproteins isolated from human secretions and animal gastric mucin had established that A antigen is determined by N-acetyl-D-galactosamine alpha-linked to the non-reducing end of oligosaccharide chains and that D-galactose alpha linked to the non-reducing end of oligosaccharide chains defines B antigen (Morgan and Watkins 1959 for review of early work see Morgan and Watkins 2000). It was another 30 years before the A-glycosyltransferase was isolated and the ABO gene characterized (Yamamoto et al. 1990). The ABO gene comprises seven exons and encodes a polypeptide of 354 amino acids with a short amino-terminal transmembrane segment and a large globular cytoplasmic domain containing the catalytic site. The cytoplasmic domain is positioned in the lumen of the Golgi. The A- transferase catalyses the transfer of N-acetyl-D-galactosamine (GalNAc) from UDP-GalNAc to the H antigen acceptor. The B-transferase transfers D-galactose (Gal) from UDP-Gal to the H antigen acceptor. The transferases differ by only four amino acid residues Arg 176Gly, Gly235Ser, Leu266Met and Gly268Ala in the A and B-transferases respectively (Table 4.3). The structure of B-transferase was elucidated by Patenaude et al. 2002; see Colour Plate 4.1). The transferase is organized in two subdomains separated by a cleft containing the active site. One subdomain comprises the amino-terminal region and recognizes the UDP-sugar donor. The other carboxy terminal subdomain provides the acceptor binding site. Residues 266 and 268 are located in the active site of the enzyme and influence donor recognition. The B transferase residues Met266 and Ala 268 are bulkier than the corresponding residues in the A transferase and restrict the size of the active site cleft to exclude UDP-GalNAc (Patenaude et al. 2002). Residues Gly235Ser and Leu266Met influence receptor binding (Letts et al. 2006). In the absence of donor or acceptor the enzymes adopt an open conformation which leaves the donor and acceptor sites exposed to solvent. Binding of UDP-sugar induces a semi-closed conformation in which the loop formed by residues 176–188 moves toward the bound UDP molecule to partially occlude the active site. Mutual repulsion between the positively charged residues Lys179, Arg180 and Arg 188 holding the enzyme in the open conformation are most likely overcome by interaction with the negative phosphate moiety of UDP. Binding of the H antigen acceptor results in a closed conformation in which the final nine carboxy terminal residues form hydrogen bonds with the L-fucose residue of H antigen and UDP. The closed conformation is required for catalysis to occur. Arg176 in the loop region of the A-transferase may result in faster product release and substrate exchange (Alfaro et al. 2008). Two alleles of the A-transferase are found in individuals of phenotype A1. In Europeans codon 156 encodes Leu. In most Japanese a single nucleotide substitution encodes Pro at this position. This amino acid substitution does not appear to affect the phenotype (Fukumori et al. 1996).
Table 4.3 Differences in amino acids (aa) between various alleles of the ABO gene.
Subgroups of A
A1 and A2
In Europeans, about 80% of group A individuals belong to subgroup A1, almost all the rest being A2. The distinction is most conveniently made by testing red cells with the lectin from Dolichos biflorus (Bird 1952). When diluted appropriately, the lectin agglutinates only A1 cells (but see Table 7.3); if too concentrated an extract is used, some adult A2 samples, although not adult A2B or cord A2 samples, may be agglutinated (see Voak and Lodge 1968).
The distinction between A1 and A2 may be difficult to make in newborn infants: the red cells of some infants who can be clearly shown to be A1 when they are older may, at the time of birth, fail to react with anti-A1 reagents. Tests with the anti-H lectin from Laburnum alpinum may be helpful in distinguishing between A1 and A2 red cells in the first months of life, A2 red cells reacting much more strongly than A1 red cells: the anti-H lectin from Ulex europaeus does not discriminate so well (Pawlak and Lopez 1979). The lectin from D. biflorus is better than human anti-A1 at distinguishing A1 from A2 in newborn infants (Race and Sanger 1975), especially if the cells are enzyme treated.
In Europeans the A2 phenotype results from a single nucleotide deletion in the penultimate codon changing the reading frame so that the A transferase produced has an extra 21 amino acids at the carboxy terminus (Table 4.3; Yamamoto et al. 1992). The extended carboxy terminus in the A2 transferase must affect the structure of the enzyme sufficiently to change its specificity and activity, perhaps by disrupting formation of the closed conformation which is dependent upon the last nine amino acids of the carboxy terminus of the A1 transferase (see above). A clearer interpretation is possible for A2 phenotypes found in Japan which result from missense mutations changing Arg352 to Trp or to Gly and Arg337Gly (Ogasawara et al. 1996, 1998). Arg352, the third residue from the carboxy terminus of the A1 enzyme, interacts with the pyrophosphate of the UDP-donor in the active site of the enzyme (Alfaro et al. 2008), so this A2 phenotype provides a direct measure of the significance of Arg352 in defining the specificity and activity of the enzyme.
Some Differences Between A1 and A2 Red Cells
As described below, the number of A sites is substantially higher on A1 than A2 red cells. Both for A1 and A2 cells, the number of A sites per red cell varies considerably within the cell population of an individual but this heterogeneity is much greater for A2 than for A1 red cells (Smalley and Tucker 1983).
The immunodominant sugar is identical on A1 and A2 red cells, namely N-acetylgalactosamine, and in reactivity the difference between A1 and A2 red cells is purely quantitative. It has been estimated that a minimum of 2.5–4 × 10⁵ A sites per red cell are needed for agglutination by anti-A1 reagents (Lopez et al. 1980). Anti-A1 may then be visualized as an antibody that reacts only with a conformation produced by a certain minimum density of A sites. Nevertheless, A1 does have qualitative differences from A2, which is not surprising as the A1– and A2-specified transferases are different (see above).
The difference between A1 and A2, and A1B and A2B, cannot always be made with certainty; there are some individuals who type as A1 or A1B with some anti-A1 reagents and as A2 or A2B with others. In addition, there are subjects whose red cells type as A intermediate (Aint), reacting more weakly than A1 red cells with anti-A1, yet unexpectedly more strongly than A2 red cells with anti-H (see Race and Sanger 1975, p. 17). Aint is much more common in black than white people, for example 4.8% vs. 0.3% in one investigation (Wiener et al. 1945).
Anti-A1 is found in the serum of some A2 and A2B subjects (see Table 4.1) but, except in rare individuals in whom the antibody is active at 37°C, can be ignored in blood transfusion. Hence, there is no need to distinguish A2 from A1 donors in routine practice. Perhaps the main importance of A subgroups in clinical medicine is that A2 infants are protected from haemolytic disease due to anti-A.
A1– and A2-transferases in serum differ quantitatively as well as qualitatively. The level of A-transferase in the serum of A2 donors is only about 10% of the level in A1 donors. The A1– and A2-transferases differ in their pH optima, cation requirements and Michaelis constants (Schachter et al. 1971, 1973). In a donor of the genotype A1A2, the A1– and A2-transferases in serum can be separated using isoelectric focusing (Topping and Watkins 1975).
As the A2-transferase is less efficient than the A1-transferase, there are fewer A sites on A2 red cells than on A1 red cells. In addition to quantitative differences, there are qualitative differences. A1 but not A2 can convert type 3 H and type 4 H chains to type 3 A and type 4 A, which have repetitive A chains and are found on A1 but not on A2 red cells. As A2 cannot convert type 3 H and type 4 H, A2 red cells (compared with A1) not only lack repetitive A chains but have more H and less A. It seems, then, that anti-A1 reagents may recognize repetitive A structures, as may certain monoclonal anti-A which react with A1 but not A2 red cells (Clausen et al. 1985).
A3 and Other Weaker Forms of A
These phenotypes, which result from the inheritance of rare alleles of A, cannot be recognized when the rare allele is paired with A1 or A2.
A3 red cells give a characteristic mixed field pattern when tested with anti-A from group B donors, consisting of small agglutinates in a sea of unagglutinated cells; with group O serum, agglutination is stronger. The frequency of A3 subjects was found to be 1 in 1000 in Denmark (Gammelgaard 1942) but 1 in 20 000 in France (Garretta et al. 1974).
Many other weaker forms of A have been described based on: (1) the presence or absence of reactions of the red cells with anti-A, -A1, -H and -A,B; (2) the presence of anti-A1 in serum; and (3) the presence of A and H substances in the saliva of ABH secretors. The following list is not comprehensive (for further information, see Daniels 2002).
Ax red cells are agglutinated weakly or not at all by serum from group B donors but are agglutinated by serum from most group O donors. Anti-A1 is usually present in the serum of Ax people.
Ael red cells are either not agglutinated at all or agglutinated only very weakly by anti-A in O or B sera, but anti-A can be adsorbed by, and eluted from, the red cells. The saliva of secretors contains a normal amount of A and H. No anti-A1 is present in the serum.
Ael red cells are not agglutinated by group B or group O serum but, following incubation with anti-A, anti-A can be eluted from the cells. The saliva of secretors contains H but not A: the serum may contain anti-A1 (Reed and Moore 1964). Like A3 and Ax, Ael cells have two populations: a minor one, carrying significant amounts of A, and a major one, totally devoid of A (Poskitt and Fortwengler 1974).
Aend cells give a mixed field pattern of agglutination with most group O but with few B sera (Sturgeon et al. 1964). H but not A is found in the saliva of secretors: anti-A1 is present in the serum. The frequency of Ax, Am, Ael and Aend in the French population was in each case less than 1 in 50 000 (Garretta et al. 1974).
Using murine monoclonal anti-A reacting with all type A oligosaccharide chains, then gold-labelled goat antimouse IgG, followed by scanning electron microscopy, A antigen was found on 5% of Am and Ael cells, some of which showed very strong labelling. In two A3 subjects, A was present on 82% and 58% of the red cells, respectively, suggesting that A3 may be heterogeneous. A was present on 75% more cells in Ax (Heier et al. 1994).
Mixtures of A and O red cells, as found in chimeras (or in group A patients transfused with O cells), may at first be mistaken for A3 samples.
Distribution of A Antigen within Populations of A Red Cells
In A1 subjects, most red cells have numerous A sites but in A2 subjects there is a spectrum from heavily coated cells to cells that apparently lack A (Reyes et al. 1976). Similarly, in A3 subjects, about one-third of the cells lack A and in Am and in Ael subjects A can be detected on only about 5% of the cell population. In addition to quantitative differences between A subgroups, there are differences in the types of A chain (Heier et al. 1994).
Subgroups of B
There is no subgroup of B analogous to subgroup A2 but various types of B cells reacting weakly or not at all with anti-B have been described.
Salmon (1976) suggested that terminology should parallel that of A subgroups and he proposed that the terms B3, Bx and Bel should be used as follows: B3 cells show a mixed field agglutination pattern with B in the saliva of secretors; Bx shows a weak agglutination pattern and the saliva inhibits the reaction between anti-B and B cells; weak anti-B is found in the serum. Bel cells are not agglutinated by anti-B but will absorb anti-B, which can subsequently be eluted: H but not B is found in the saliva of secretors.
In detecting weak B antigens, as in detecting weak A antigens, the preparation of an eluate may be helpful in two ways: first, it may be possible to prepare quite a potent eluate from cells that agglutinate only very weakly; in fact, it appears that, on the whole, the weaker the antigen the more potent the eluate; second, an eluate prepared from cells with a very weak antigen (e.g. Bx) may agglutinate the cells, even although they are not agglutinated by the whole serum used in making the eluate (Alter and Rosenfield 1964a).
Molecular Bases of Weak A and B Variants
Many different mutations in the coding sequences of the A1 and B- transferases have been decribed in individuals with weak variants (reviewed by Olsson et al. 2001). A list of the variant alleles described can be found in the Blood Group Antigen Gene Mutation Database (http://www.ncbi.nlm.nih.gov/projects/mhc/xslcgi.fcgi?cmd=bgmut/home).
The functional consequences of three mutations altering the sequence of the B transferase has been investigated in detail (Persson et al. 2007). One mutation (Met214Arg) gives rise to a weak B antigen (Bel) whilst the others (Met214 Val and Met214Thr) give rise to AweakB phenotypes. These mutations change amino acid 214 which is adjacent to the sequence Asp211-Val-Asp (DXD motif, Colour Plate 4.1). The aspartic acid residues in this DXD motif bind Mn++, which in turn binds to phosphate residues of the UDP- sugar donor. When Met214 is substituted by Arg, Mn++ is displaced by a water molecule resulting in a dramatic 1200-fold reduction in kcat compared with wild type B transferase, thereby accounting for the very weak B phenotype. The mutations Met214Val and Met214Thr do not alter Mn++ binding, but cause Met266 to take up an alternative conformation which opens up the active site to allow binding of UDP-GalNac thereby explaining the A weakB phenotype.
Individuals with the B(m) phenotype found in Japan have weakened B antigen expression because of a partial deletion of a regulatory sequence in intron 1 of the transferase gene. The deletion disrupts a GATA-1 binding motif explaining why weak B expression is found on the red cells but not in the tissues (Sano et al. 2012).
Competition Between A- and B-Transferases
A- and B-transferases act upon the same precursor substance and it is therefore not surprising that subjects who have both an A and a B allele show diminished expression of both A and B antigens. Thus, A1B red cells have less A than A1 cells and A2B cells less A than A2 cells. Similarly, B is slightly less strongly expressed in A1B than in B cells. In certain pedigrees, red cells of genotype A1B may behave as A2B, presumably due to an interference with the expression of A1 by a strong B allele (for references, see Alter and Rosenfield 1964b). In 5000 Black Americans only 20% of A samples typed as A2 but almost 50% of AB samples typed as A2B (Morel et al. 1984).
Cis AB
Occasionally, an individual passes on both A and B so that, for example, a group AB father and a group O mother have an AB child. In the cis AB phenotype, the B antigen is usually very weak so that the phenotype cannot be confused with normal AB. The serum from most cis AB individuals contains anti-B, indicating that the B in cis AB is different from normal B. The A antigen is more strongly expressed than in A2B but less strongly than in A1B.
Sequencing of the ABO genes in several unrelated cis AB individuals showed an A1 structure but with two single base differences, the significant one being a substitution at position 268 (Gly → Ala) representing the B-sequence at this residue (Ogasawara et al. 1996). CisAB has also been described with a Met266Leu change on the background of the B-transferase sequence (Mifsud et al. 2000). Leu266Met and Gly268Ala are the most critical residues defining A and B-transferase activity. The larger residues found in the B-transferase (Met/Ala) restrict the size of the active site preventing access to UDP-GalNac (see Colour Plate 4.1; Table 4.3 and Patenaude et al. 2002). In the case of cisAB, it would appear that substituting one or other of these critical residues in the A or B transferase allows access to both UDP-Gal and UDP-GalNAc, but reduces enzyme activity, as the phenotype has weaker A and B antigen expression than normal.
B(A) and A(B)
A- and B-specified transferases are very similar and have overlapping functions. Thus, the A1-transferase can synthesize group B determinants (Yates and Watkins 1982) and the B-transferase has the potential to synthesize blood group A-active structures, using the same donor and acceptor substrates as the A transferase (Yates et al. 1984; Watkins 1990). Red cells are described as B(A) when, despite coming from a B subject who lacks the A gene, they are weakly agglutinated by potent anti-A monoclonals. Most B(A) subjects are black and in the serum have concentrations of B-specified enzyme that are five to six times greater than in most B subjects (Beck et al. 1987). On the other hand, A(B) individuals do not have higher levels of A-transferase but have very potent H-transferases with abundant H precursor substances, which may lead to the formation of some B determinants by the A-transferase (see Watkins 1990). The B(A) phenotype may also result from qualitative changes in B-transferase activity. Individuals with the B(A) phenotype have been described with a Ser235Gly substitution in the B-transferase sequence (Olsson et al. 2001). Gly235 is found in the A-transferase. It does not have direct contact with the UDP-sugar moiety, but influences binding of H-active acceptor substrates (Letts et al. 2006). Two B(A) siblings with a Pro234Ala substitution in the B-transferase sequence have also been described (Yu et al. 1999). It would be expected that this substitution which is adjacent to the critical residue 235 would also alter the acceptor-binding properties of the transferase and so account for the B(A) phenotype (see Table 4.3).
Molecular Bases of Blood Group O
The blood group O phenotype results from absence of an active ABO glycosyltransferase. The commonest cause of the phenotype is inheritance of an A1 transferase gene in which nucleotide 261 (delG) in exon 6 is deleted (allele denoted O1-1). This nucleotide deletion changes the reading frame resulting in translation of an inactive protein with an altered amino acid sequence after amino acid 88 and terminating at amino acid 117 so that the large catalytic domain is absent (Table 4.3; Yamamoto et al. 1990). A small proportion of European group O individuals (2–7%) have an A1 transferase gene (allele denoted O2-1) with six nucleotide substitutions changing four amino acids in the translated protein (Arg18Leu, Pro74Ser, Arg176Gly, Gly268Arg). Structural studies have established that the sequence change Gly268Arg renders the enzyme inactive because the large side chain of arginine prevents binding of UDP-GalNAc to the active site (Lee et al. 2005). There is some evidence the translated O2 allele produces a glycosyltransferase capable of generating very weak A activity however no risk is associated with transfusing red cells from O2 donors to recipients with anti-A (Yazer et al. 2008b).
There are several rare O alleles resulting from different mutations which create a translated protein lacking glycosyltransferase activity (O3–O6; Table 4.3; reviewed in Yazer et al. 2008a). The O3 and O4 alleles have G insertions (G804 and G88 respectively) which change the reading frame and create premature stop codons so the translated proteins are non-functional. O5 and O6 have mutations (C322T and G542A respectively) which introduce a stop codon so the translated proteins (107 and 180 amino acids) are inactive. The O alleles 0301 and 0302 described in Japanese blood donors have a mutation (Ala298Val) and a nonsense mutation creating a stop codon after amino acid 308 respectively. These rare O alleles create no clinical problems when conventional serological methods of ABO typing are employed, but provide considerable challenges for DNA-based methods of ABO typing because the mutations occur in an A1 or A2 transferase gene and so individuals could mistakenly be typed as A if the DNA-based method employed is not configured to detect these variant O alleles (see Chapter 8 for further discussion of DNA-based methods of blood grouping).
Allelic Enhancement
There are occasional reports of children with a weak A phenotype being born to parents who are both group O. In a case described by Olsson et al. (2005) a child with weak A phenotype inherited a weak A allele from her father and an O2 allele from her mother. The father had inherited the weak A allele with an O1 allele and had the phenotype group O. This case suggests that the red cell phenotype is influenced by the nature of the O allele inherited, an effect known as allelic enhancement. In this context it is interesting to note that unlike the O1 allele, the O2 allele encodes a full-length inactive transferase. Lee et al. (2005) show that the amino acid substitution Pro74Ser in the stem region of the putative product of the O2 allele causes a reduction in the catalytic activity of the enzyme and provide evidence that this reduction in activity results from changes in the flexibility of enzyme dimers formed. A heterodimer formed by the protein product of the weak A allele and the inactive O2 protein might therefore provide an explanation for the child’s weak A phenotype in this case. Other cases are reported in which individuals inheriting a weak A allele with a B allele have the red cell phenotype AweakB, while those inheriting the same weak A allele with an O1 allele have the phenotype group O (Cho et al. 2005; Li et al. 2007). Clearly, formation of a heterodimer between the product of the weak A allele and the B transferase could provide an explanation for these blood typing results.
Hybrid ABO Alleles
Numerous examples of hybrid ABO alleles have been described, presumed to result from crossover or gene conversion during meiosis involving intron 6 of the ABO gene. The occurrence of hybrid alleles represents a considerable barrier to the widespread the use of DNA-based methods of ABO typing in routine clinical practice because of the risk that an allele may be typed as A or B when in fact it is inactivated as a result of a crossover or gene conversion event resulting in the insertion of an inactivating O allele sequence (Hosseini-Maaf et al. 2007; see also Chapter 8 for discussion of DNA-based methods of blood typing). Crossover or gene conversion during mitosis (autologous chimerism) has been invoked to explain the occurrence of a weak A phenotype in some individuals inheriting two different O alleles when other members of the same family inheriting the same O alleles have a group O phenotype (Hosseini-Maaf et al. 2005).
H Antigen on Red Cells
The H determinant is found on all human red cells except those of subjects of phenotype Oh. As H is a precursor of A and B, A and B subjects have less accessible H than O subjects. The order of reactivity of anti-H with red cells of various ABO groups tends to be OA2 > A2B > B > A1 > A1B. Exceptions to this order are provided by occasional subjects who are genetically A1 or A1B but group as A2 or A2B, respectively, because normal synthesis of A is hindered by a deficiency of H. In such ‘A2’ or ‘A2B’ subjects, H is more weakly expressed than in cells of normal A1 or AIB subjects. H antigen on red blood cells is formed by the action of an alpha1,2 fucosyltransferase (FUT1) which preferentially catalyses the addition of L-fucose to the non-reducing end of oligosaccharide chains in which the terminal disaccharide has the type 2 structure Galβ1 → 4GlcNAcβ1-R (see also Figure 4.3):
The H gene (FUT1) has been cloned and sequenced (Rajan et al. 1989; Larsen et al. 1990). The cDNA predicted a protein of 365 amino acids with the same overall structure as the A-transferase but lacking significant sequence homology with it.
Numbers of A, B and H Antigen Sites on Red Cells
Estimates of the numbers of sites on the red cells of adults and newborn infants of common ABO phenotypes are shown in Table 4.4. As the table shows, it has been estimated that there are approximately 800 000 A sites on adult A1 cells, and about as many B sites on adult B cells. The only estimate for the number of H sites on the red cells of adults suggests that these are twice as numerous on O cells as are A or B sites on A or B cells. However, this apparent discrepancy is probably due simply to the method of calculation. The numbers of A and B sites are calculated from the numbers of antibody molecules combining with the red cells, on the assumption that one antibody molecule combines with one antigen site. As in fact there is evidence that, under conditions used in estimating antigen sites, the majority of anti-A and anti-B molecules bind to red cells by both their combining sites, the number of A and B sites is presumably approximately twice the number given in the table. On the other hand, the number of H sites was estimated from the number of 14C-labelled GalNAc residues transferred to red cells using A-specified enzyme (Schenkel-Brunner 1980a). From a consideration of estimates of the number of red cell surface molecules known to carry oligosaccharides with ABH activity, it can be inferred that the number of possible ABH sites on a red cell is in excess of 2.5 million (see Chapter 3).
Table 4.4 Various estimates of the number of A, B and H sites on red cells of different phenotypes from adults and newborn infants.
| Sites × 106 per red cell | Reference* | |
| A sites † | ||
| A1 adults | 0.83 | (1) |
| A1 adults | 0.81–1.17 | (2) |
| A1 adults | 0.85 | (3) |
| Newborn | 0.25–0.37 | (2) |
| A2 adults | 0.24–0.29 | (2) |
| A2 adults | 0.24 | (3) |
| Newborn | 0.14 | (2) |
| A1B adults | 0.46–0.85 | (2) |
| Newborn | 0.22 | (2) |
| A2B adults | 0.14 | (2) |
| B sites † | ||
| B adults | 0.75 | (2) |
| Newborn | 0.2–0.32 | (4) |
| A1B adults | 0.43 | (2) |
| H sites | ||
| O adults | 1.7 | (5) |
| Newborn | 0.325 | (5) |
| A, B, AB newborn | 0.07 | (5) |
* (1) Greenbury et al.(1963); (2) Economidou et al.(1967a); (3) Cartron et al.(1974); (4) EL Romano (personal communication); (5) Schenkel-Brunner (1980a,b).
† Assumes antibody molecule binds to one antigen site; even if bivalent binding is usual, at very high concentrations of antibody, as used in estimating the number of antigen sites, binding is probably univalent (NC Hughes-Jones, personal communication).
Compared with the red cells of adults, the red cells of newborn infants have about one-third of the number of A and B sites. The numbers of antigen sites on weak A samples from adults were found to be: A3, 35 000; Ax, 4800; Aend, 3500; and Am, 700 (Cartron 1976, and other papers in vol. 19, no.1, of the Revue Française de Transfusion et Immunohématologie, March 1976).
Oh, Ah and Bh Red Cells
In subjects of the very rare genotype hh (phenotype Oh), no H is made on red cells and therefore no A or B can be made either. The serum contains anti-H as well as anti-A and anti-B. The first example of blood of this kind was found in Mumbai (formerly Bombay; Bhende et al. 1952), hence the name ‘Bombay’ often given to hh bloods. The Bombay phenotype results from inheritance of inactivating mutations in FUT1 which explains the lack of H (and A or B) activity on their red cells. More than 30 different inactivating mutations have been described (Storry et al. 2006). Individuals of the Bombay phenotype also lack A, B or H activity in their secretions. Expression of A, B or H antigens in secretions is regulated by another alpha 1,2 fucosyltransferase gene (FUT2) very similar to FUT1 but preferentially catalysing the transfer of L-fucose to the non-reducing end of oligosaccharide chains in which the terminal disaccharide has the type 1 structure Galβ1 → 3GlcNAcβ1-R (Figure 4.3). Inactivating mutations in FUT2 are quite common (see discussion of secretor status below). The Bombay phenotype results from the coincident inheritance of inactivating mutations in FUT1 and FUT2.
The red cells of almost equally rare ‘para-Bombay’ bloods (phenotype Ah, Bh), react very weakly with anti-A and anti-B, but not at all with the anti-H lectin from Ulex europaeus, although weak reactions have been observed with selected anti-H from Oh subjects (see Race and Sanger 1975, for details and references). The para-Bombay phenotype can result from inheritance of an inactive FUT1 together with an active FUT2 in which case weak ABH activity found on the red cells is assumed to result from absorption of ABH antigen from serum. Alternatively, the phenotype can result from mutations in FUT1 which greatly reduce enzyme activity, and this can occur in the presence of an inactive or an active FUT2. If an active FUT2 is present the secretions will contain A, B and/or H activity according to the ABO genotype of the individual.
Although H in ‘para-Bombay’ subjects cannot be readily detected serologically, its presence has been uncovered by converting Bh cells, using suitable enzymes, into B(−), H(+) cells (Mulet et al. 1979).
Development of the A, B and H Antigens
A and B can be detected on the red cells of 5- or 6-week-old embryos, but even at birth are not fully developed (Kemp 1930), and the number of antigen sites is less (see Table 4.4). The red cells of newborn infants also react less strongly than those of adults with anti-H.
When the reactions of the red cells of group A infants and adults with anti-A sera are compared, only slight differences are found in the agglutination of saline-suspended red cells but larger differences are observed in the indirect antiglobulin test (anti-IgG) and in tests for lysis (Crawford et al. 1953). In the percentage of cells lysed, adult levels are almost reached by the end of the first year of life and are fully reached by the age of 2–4 years (Grundbacher 1967).
The red cells of newborn infants who are genetically A1 react relatively weakly with human anti-A1 (Crawford et al. 1953); for the reactions with lectins, see the previous section ‘Subgroups of A’. Fetal A2 red cells behave like adult Ax red cells, i.e. they react better with O serum than with B serum (Constantoulakis et al. 1963). The section on biosynthesis deals with the biochemical differences between adult and fetal group A red cells.
The relative binding of anti-A to adult and cord blood group A red cells, in relation to the serological findings in ABO haemolytic disease of the newborn, is considered in Chapter 12.
A, B and H Antigens in Relation to Ageing of Red Cells
A, B and to a lesser extent H diminish with red cell age (Fibach and Sharon 1994).
Weakening of A, B and H Antigens in Acute Leukaemia
In acute leukaemia, the A antigen may be weakened (van Loghem et al. 1957). Sometimes the blood appears to contain a mixture of group A and group O cells (Salmon et al. 1958; Gold et al. 1959) or of A1 and weak A (Salmon et al. 1959). In other cases the red cells react weakly with anti-A, even behaving like A3 or Am (Salmon et al. 1959); Salmon and co-workers pointed out that in the course of testing some 300 000 blood samples they had encountered 22 weak A samples (10 Ax, four Am and eight A3). All of the 10 Ax samples came from normal subjects but two of the four Am and two of the eight A3 came from patients with acute leukaemia.
In a patient with erythroleukaemia, of group B, 60% of the cells were not agglutinated by anti-B and appeared to be group O, but were really very weak B: when separated from the normal B cells they would absorb anti-B (Bird et al. 1976).
Loss of ABH antigens was associated with a corresponding loss of ABO allelic expression in patients with a variety of myeloid malignancies (acute myeloid leukaemia, chronic myeloid leukaemia, myelodysplasia) and 8 of 11 patients also exhibited DNA methylation of the ABO promoter compared with 2 of 10 patients without loss of ABO allelic expression (Bianco-Miotto et al. 2009). These data support the view that loss of ABH antigen activity in myeloid malignancies frequently results from silencing of the ABO gene by DNA methylation.
Association of ABO Group and Pancreatic Cancer
Early work from the 1950s suggested that individuals of group O have a lower risk of pancreatic cancer than those of group A or B. This association has been linked to a single nucleotide polymorphism in intron 1 of the ABO gene (Amundadottir et al. 2009). In this context it is interesting to note that antisense RNA transcribed from the ABO gene which encompasses intron 1 has been isolated and a regulatory role suggested (Hata et al. 2007).
ABO Antigens, Cardiac Disease, Venous Thromboembolism and Pre-Eclampsia
Nydegger and co-workers (2003) report the prevalence of the B allele to be 2.5 times higher amongst patients with a history of myocardial infarction. High factor VIII levels and non-O blood groups are risk factors for venous thromboembolism (VTE, Gonzalez Ordonez et al. 1999; Tirrado et al. 2005). The rate of proteolysis of von Willebrand factor (VWF) by the metalloprotease ADAMTS 13 is greater for group O VWF than for VWF from B, A or AB (Bowen 2003). VWF levels in the plasma of individuals with the Bombay phenotype are lower than in group O and more susceptible to cleavage by ADAMTS13 (O’Donnell et al. 2005). A, B and H blood group antigens are expressed on N-glycans of vWWF and influence the half-life of the protein (10 h for group O and 25 h for non-O subjects) providing an explanation for the higher levels on non-O individuals (Gallinaro et al. 2008). The risk of VTE is probably related to the level of vWWF and FVIII because individuals of group A2 have lower levels of these proteins than A1, B and AB and have a lower risk of VTE (Tregouet et al. 2009). Hitunen et al. (2009) analysed 348 cases of pre-eclampsia and 679 controls and concluded blood group AB increases the risk of pre-eclampsia.
Acquired B Antigen in A1 Subjects
In the original report of this condition, seven A1 blood samples were described, which reacted weakly with some anti-B sera, giving the appearance of group AB with a weak expression of B. In each case, the serum contained normal anti-B. Five out of the seven subjects had cancer and six were over 60 years old (Cameron et al. 1959). ‘Acquired B’ results from the action of bacterial deacetylase, which converts N-acetylgalactosamine to α-galactosamine, which is very similar to galactose, the chief determinant of B. Some monoclonal anti-B fail to react with acquired B cells and are thus useful in discriminating between normal and acquired B. Another means of discrimination is to adjust the pH of anti-B sera to 6, as the sera will then no longer react with acquired B. A mouse monoclonal antibody specific for the acquired B group, reacting with a distinct epitope resulting from the deacetylation of the blood group A trisaccharide, was reported by Oriol and co-workers (1990).
In a case in which acquired B was mistaken for AB, and four AB units, compatible on an immediate spin, were transfused over a period of 7 days, a fatal haemolytic transfusion reaction (HTR) developed associated with immune anti-B (Garratty et al. 1993).
Red cells with acquired B may also show T or Tk activation (see Chapter 7), all of these changes being produced by enzymes from Gram-negative bacteria commonly associated with carcinoma of the colon or rectum, or with intestinal obstruction.
It has been suggested that the rarity of acquired B may be due to the fact that all A2 and 95% of A1 subjects have an antibody that can destroy B-modified cells and that most coliform organisms lack deacetylase (Gerbal et al. 1975). The kind of acquired B described above may be called the ‘deacetylase type’ and can be made only on A1 cells. The second type of acquired B that may be called the ‘passenger antigen’ type is caused by adsorption of B-like bacterial products on to O or A cells but occurs only in vitro (Bird 1977).
Conversion of O Red Cells to A or B Cells
In the presence of the appropriate nucleotide sugar and the A- (or B-) transferase, group O red cells are readily converted to A- (or B-) active red cells (Schenkel-Brunner and Tuppy 1969; Race and Watkins 1972); Oh red cells are not converted (Race and Watkins 1972).
Group O red cells have been used to demonstrate the presence of B-transferase in saliva; the transferase was present both in secretors and non-secretors (Kogure and Furukawa 1976).
Enzymatic Conversion of A and B Cells to O
Treatment of B red cells with an α-galactosidase hydrolyses away the terminal α-glycosidically linked galactose, thus removing group B activity (Harpaz et al. 1975). Red cells treated in this way react as group O cells and, after labelling with 51Cr, have been shown to survive normally not only in the group B donor of the cells but also in a group A and a group O subject (Goldstein et al. 1982). In further work, 2 units of converted B cells were given to each of four group O subjects. Despite a three- to fivefold increase in anti-B titre, there was no evidence of an immediate or delayed haemolytic reaction (Lenny et al. 1994). A successful phase II trial using recombinant enzyme was reported by Kruskall and co-workers (2000). Comparable conversion of group A cells has proved more difficult because of the lack of suitable α-N-acetylgalactosaminidases. Candidate enzymes include those from the human fecal bacterium Ruminococcus torques IX-70 (Hoskins et al. 1997; Hoskins and Boulding 2001), the marine bacterium Arenibacter lacterius KMM426T (Bakunina et al. 2002) and Clostridium perfringens (Hsieh and Smith 2003). Liu et al. (2007) report that recombinant bacterial A- and B-degrading enzymes have been obtained with characteristics that may make the process of converting blood group A and B red cell units to group O economically viable (reviewed by Olsson and Clausen, 2008).
Masking of ABH Antigens with Polyethylene Glycol
Treatment of red cells in vitro with various polyethylene glycol compounds (PEG) can be used to mask blood group antigens including A and B. These observations lead to the suggestion that PEG-treated units of donor red cells could be used as ‘universal’ red cells for transfusion purposes. However, complete masking of antigens is difficult to achieve and more significantly there is evidence PEG is immunogenic. Some normal human sera contain anti-PEG and anti-PEG produced in rabbits transfused with PEGylated rabbit red cells is associated with reduced red cell survival (reviewed by Garratty 2008).
Secretors and Non-Secretors of ABH
The fact that A and B substances are present in the saliva of most A and B individuals (‘secretors’) was first discovered in 1930 (for references to early papers, see Wiener 1943, p. 275). Approximately 80% of subjects are secretors of ABH.
The secretion of H, A and B is controlled by alleles, Se and se, of the secretor gene. The term secretor is applied to those persons (genotype SeSe or Sese) who secrete H with or without A and/or B, and does not take into account the presence of Lewis or other blood group substances in the saliva. Thus the saliva of group O secretors contains H and that of group A secretors contains A and H (Morgan and Watkins 1948). In most non-secretors, very small amounts of H and, according to the ABO group, of A or B are present in saliva due apparently to a low level of H– not Se-specified transferase (Betteridge and Watkins 1985); the Se-specified transferase is an alpha 1,2 fucosyltransferase (FUT2). The gene encoding this transferase (FUT2) was cloned and sequenced by Kelly et al. (1995). The secretor transferase has substantial sequence homology with the H-transferase (FUT1) in its carboxy-terminal domain. Several different inactivating mutations in FUT2 result in the secretor negative phenotype. In European, Central Asia and African non-secretors homozygous inheritance of an inactivating nonsense mutation (G428A, allele denoted se428) is commonly found. In the Far East and South Pacific, the commonest mutation is Ile129Phe which results in a secretor transferase with a fivefold lower activity. This allele (se385) results in reduced levels of H antigen in secretions and the red cell phenotype Le(a+ b+) (Henry et al. 1996a,b). Two additional non-secretor alleles se302 and se571 are found in Central and South Asia and Cambodia respectively (Ferrer-Admetlla et al. 2009). Homozygosity for non-secretor alleles confers a survival advantage for some infectious diseases (see below).
The amount of A glycoprotein in the saliva of group A secretors follows a log-normal distribution. The amounts of A and H in the saliva appear to vary independently of one another, although there is a significant correlation between the ratios of A to H amongst siblings (Clarke et al. 1960).
H, A and B glycoproteins in saliva are produced predominantly by the submaxillary and sublingual glands (Wolf and Taylor 1964). The greatest amounts of A glycoprotein were found in saliva from the sublingual and lip mucous glands and there was negligible activity in parotid saliva (Milne and Dawes 1973).
Group-specific glycoproteins have been found in seminal fluid, tears, sweat, urine, digestive juices, bile, milk, pleural, pericardial and peritoneal fluids, amniotic fluid and in the fluids of hydroceles and ovarian cysts (Wiener 1943, p. 274). The amounts in different secretions of the same individual vary widely.
A, B and H Substances in Serum
Moss (1910) showed that group A serum contains a substance that will inhibit the haemolytic properties of an anti-A serum, and Schiff (1924) demonstrated the presence of A substance in group A serum by immunization experiments in rabbits. Using a radioimmunoassay, A activity was detected in all group A sera tested, with higher levels in A1 than in A2, and in secretors than in non-secretors; the highest activity was found in Le(a− b−) secretors (Holburn and Masters 1974a). ABH substances in serum are glycolipids but their cellular origin is unknown. A or B substances are present in the serum of almost all group A or B newborn infants, although the concentration was lower than in adults (Høstrup 1963).
Patients with an increased amount of A or B glycoprotein in their serum have been described: most have had pseudomucinous ovarian cysts, glycoprotein from which is presumed to have entered the bloodstream (for references, see previous editions of this book).
The inhibitory power of A in plasma increases on storage (Michel 1964), due apparently to the shedding of microvesicles from the red cell surface; see Chapter 9.
Serum from group O donors inhibits occasional examples of anti-H; all such examples tested by Daniels (1984) showed a preference for type II chains. There is more H in the plasma of O and A2 subjects than in that of A1 and A1B subjects (Rouger et al. 1979).
Uptake of A and B Substances by Group O Red Cells in Vivo
This was first observed in patients of group A or B transfused with group O blood: after some days the O cells became agglutinable by certain group O sera (Renton and Hancock 1962). Similarly, group O red cells exposed in vitro to group A glycosphingolipid fractions become agglutinable by anti-A (Tilley et al. 1975).
In chimeric twins of groups O and A, it would be expected that in the twin who was genetically A (and a secretor), the ‘donor’ (group O) cells would have small amounts of A substance on their surface and would be agglutinated by selected O sera. Tests in one such chimeric twin showed this to be the case (Race and Sanger 1975).
A, B and H Substances in Amniotic Fluid
Soluble A, B and H substances are found in amniotic fluid from about the ninth week of gestation onwards, and are derived from the fetus; according to several authors they are found only when the fetus is a secretor (e.g. Przestwor 1964; Harper et al. 1971), although small amounts have been found in non-secretors (Høstrup 1964). Blood group substances corresponding to the maternal ABO group may be found if care is not taken to exclude cells from the fluid examined.
A, B and H on Leucocytes, Platelets, Other Cells and Bacteria
Granulocytes
Despite earlier reports to the contrary, it seems that A, B and H cannot be detected on human granulocytes (Dunstan et al. 1985a).
Lymphocytes
A and B are present on lymphocytes and are detectable by lymphocytotoxicity tests. These antigens, like Lewis antigens, are acquired from the plasma, and thus are most readily detected on the lymphocytes of individuals whose plasma contains relatively large amounts of A or B glycolipid (Rachkewich et al. 1978).
Platelets
At least part of the A, B and H antigens detectable on platelets is acquired by adsorption of glycolipids from plasma (Kools et al. 1981; Kelton et al. 1982). However, in addition to type 1 H, representing passively acquired antigen, type 2 H can also be detected on platelets and is presumably synthesized by the cells themselves (Dunstan et al. 1985b). The distribution of ABH antigens on platelets was shown to be heterogeneous by fluorescence flow cytometry (Dunstan and Simpson 1985). Antigen A expression on platelets varies in a predictable fashion according to genotype (Delelys et al. 2012).
Other Cells
The presence of A and B antigens has been demonstrated on epidermal cells, cells of amniotic fluid, sinusoidal cells of the spleen and spermatozoa, as well as in the cell walls of the endothelium of capillaries, veins and arteries. In non-secretors, A and B are demonstrable only in the deeper layers of the gastric mucosa, but in secretors they are also demonstrable in glands, goblet cells and secreting surface epithelia (for references, see eighth edition).
The amount of ABH-active glycolipids in parenchymatous organs (liver, spleen, kidney) is about the same as in red cells, whereas the amount in glandular tissues (pancreas, gastric mucosa) is larger (see Watkins 1980). Some cells, such as vascular endothelial and biliary cells, are rich in ABH as well as in HLA antigens, whereas other cells such as the hepatocytes are totally devoid of them. These differences in antigen distribution may be important in graft rejection (Rouger et al. 1982).
In embryos of 5- to 60-mm crown–rump length, A, B and H have been found on all epithelial cells except those of the central nervous system, and on all endothelial cells (Szulman 1965).
A and B Antigens on Bacteria
Schiff (1934) first showed unequivocally that a bacterium (Shigella shigae) had blood group activity, after growing it in a medium free from blood group substances. Springer and co-workers (1962) tested approximately 300 strains of bacteria and found that about half of them had A, B or H activity.
Antibodies of the ABO System
The common occurrence of naturally occurring antibodies reacting with antigens of the ABO, H, I, Le and P systems is doubtless related to the fact that these antigens are widely distributed in nature, for example in animals other than humans and in bacteria. The antibodies tend to be IgM cold agglutinins; they activate complement and, when active at 37°C, are often lytic.
Anti-A and Anti-B
If A is absent from a person’s red cells, anti-A agglutinins are found in the serum, and if B is absent from a person’s red cells the serum contains anti-B agglutinins (see Table 4.1). The titre of the agglutinins varies considerably in different sera and appears to have a log-normal distribution. The titre recorded is affected by the red cell phenotype (e.g. A1 or A2), by the concentration of red cells in the final mixture, by the time and temperature of incubation and by the technique of reading the endpoint. There is usually a wider range of titres for anti-A (e.g. 8–2048) than for anti-B (e.g. 8–256).
In white people, anti-A titres tend to be higher than anti-B titres, either when comparing group B with group A subjects or when comparing the titres of the two antibodies in group O subjects. The anti-A titre tends to be higher in group O subjects than in group B subjects, and the anti-B titre to be higher in O than in A (Ichikawa 1959). In black people, anti-A and anti-B titres tend to be higher than in white people, and anti-B titres are almost as high as anti-A titres (Grundbacher 1976). In a series of Nigerian donors, although anti-A agglutinin titres were higher than those of anti-B, haemolytic activity was more commonly anti-B than anti-A (Worlledge et al. 1974). It is possible that the differences in strength and haemolytic characteristics of ABO antibodies are more strongly correlated with environmental factors than with race; a recent study of donors living in the UK failed to show any significant differences between black, white and Asian people (Redman et al. 1990).
Except in AB subjects, complete absence of anti-A and anti-B is very rare in healthy subjects. Race and Sanger (1975) refer to only three cases of missing anti-A or anti-B for which no cause could be found. Extremely weak anti-B was presumably present in the three healthy group A subjects described by van Loghem and colleagues (1965), as, although no antibody could be detected serologically, the survival of group B cells was shortened: T50Cr of 10, 20 and 21 days compared with 29 ± 3.5 days in normal subjects.
Anti-A and anti-B are often present in very low concentration in patients with hypogammaglobulinaemia and are absent in the rare X-linked Wiskott–Aldrich syndrome. Boys with this syndrome are unable to mount an immune response to polysaccharide antigens and thus have no ABO antibodies; responses to protein antigens are often unimpaired (see Miescher and Müller-Eberhard 1978). The gene affected in Wiskott–Aldrich syndrome encodes WASP, a protein involved in the regulation of cytoskeletal assembly in blood cells. Defects in WASP affect T-lymphocyte function and may also result in impaired T- and B lymphocyte maturation, thereby accounting for the immune deficiency found in these patients (Park et al. 2004). Anti-A and anti-B may also be present in very low concentration in patients immunosuppressed by therapy or disease and in patients undergoing intensive plasma exchange.
In chimeras, the presence of a population of red cells of different ABO group may lead to the absence of the corresponding alloantibody; for example, in a chimera that is genetically group O but has a population of A cells, anti-A is absent (see Race and Sanger 1975, p. 526).
Development of Anti-A and Anti-B
As described in Chapter 3, the only immunoglobulin synthesized in relatively large amounts by the fetus is IgM, and the level of this protein in cord serum is about one-tenth to one-twentieth of that in adult serum.
Anti-A and anti-B present in cord sera are usually IgG and are of maternal origin but, occasionally, they are IgM, synthesized by the fetus. For example, 8 out of 192 unselected infants had an agglutinin in cord serum, which could not have been of maternal origin, for example anti-B in the cord serum of an infant born to a group B mother (Thomaidis et al. 1967). In another series, in 33 selected cases, in all of which it would have been possible to have detected anti-A or anti-B of non-maternal origin, such antibodies were found in seven cases (Chattoraj et al. 1968). In a third series, agglutinins incompatible with maternal red cells were found in 8 out of 44 neonatal sera (Toivanen and Hirvonen 1969).
The production of ABO agglutinins in fetal life appears to be more common in Nigeria: of 50 cord bloods tested using a ‘sensitive technique’, 40% had IgM anti-A and/or anti-B, which, on the basis of specificity, could not have been of maternal origin (Worlledge et al. 1974).
In most infants, anti-A and anti-B agglutinins (presumably IgM) produced by the infant can first be demonstrated at 3–6 months. In one series of 900 infants, levels at 3 months were 25% as high as those of adults (Godzisz 1979). In another series, 85% of infants had the expected agglutinins at the age of 6 months (Yliruokanen 1948). In a series of 150 group O children, the median anti-A titre was 4 at 3–6 months, 16 at 6–9 months and 64 at 12–18 months. The maximum value (128) was reached in the fifth year. Anti-B titres tended to lag behind, particularly in the first year of life, so that by the age of 12 months, although 30% of O and B children had anti-A titres equal to the adult median value, only 4% of group A children had anti-B titres equal to the median adult level. These findings show that reverse ABO grouping in infants is not worth performing before 6 months of age (Fong et al. 1974).
The titre of anti-A and anti-B agglutinins reaches its maximum at the age of 5–10 years and the level of haemolysins follows a similar pattern, reaching a maximum at 7–8 years. Levels are higher in girls than in boys (Grundbacher 1967).
Several studies have shown a progressive decrease in anti-A and -B agglutinin titres with age, with low levels (titre 4 or less) being common in subjects aged 80 or more (Thomsen and Kettel 1929; Somers and Kuhns 1972; Baumgarten et al. 1976). In more recent studies, on the other hand, agglutinin titres have been found to fall slightly or not at all with age, with median values as high as 64–128 in the tenth decade of life (Petzl and Tanew 1985; Auf der Maur et al. 1993).
The influence of genetic factors on agglutinin titres is unclear. In one series it was found that the difference between dizygotic twins was no greater than that between monozygotic twins (Nijenhuis and Bratlie 1962), although in another, it was concluded that genetic factors played some part (Grundbacher 1976).
Murine Monoclonal Anti-A and Anti-B
Numerous monoclonal anti-A and anti-B have been produced and have proved entirely suitable as blood grouping reagents (see Chapter 8). Anti-H has also been produced (see p. 136). However, some ABO monoclonals cannot be used in absorption/elution tests to classify weak subgroups of A (Zelenski 1986). Also, inhibition tests have shown that monoclonal anti-A varies according to the source of the A immunogen.
IgM, IgG and IgA Anti-A and Anti-B
In a given serum anti-A may be wholly IgM or partly IgM and partly IgG (Fudenberg et al. 1959), partly IgM and partly IgA or may be made of all three immunoglobulins (Kunkel and Rockey 1963), even in subjects who have had no identifiable stimulus. IgG anti-A and anti-B are found far more commonly in group O than in B or A subjects (Rawson and Abelson 1960a).
In mixtures containing IgG and IgM anti-A, the IgM antibody can be inactivated by treatment with 2-mercaptoethanol (2-ME) or dithiothreitol (DTT); see Chapter 3. The serological activity of IgA anti-A is reduced but not destroyed by treatment with 2-ME (for references, see eighth edition).
IgG Subclasses
Of 42 sera containing IgG anti-A and anti-B, obtained from group O mothers of A or B infants, 39 reacted with subclass antisera; of these, one was solely IgG2 and the remaining 38 were all partly IgG2; the other subclasses present were as follows: IgG1 (19); IgG1 + IgG3 (3); IgG1 + IgG3 + IgG4 (12); and IgG1 + IgG4 (4) (Brouwers et al. 1987).
Complem Ent Binding
Both IgM and IgG anti-A may be haemolytic (Rawson and Abelson 1960b). In one investigation all examples of IgG anti-A and about 90% of examples of IgM anti-A were readily haemolytic; the remaining examples of IgG anti-A would haemolyse cells if the test was made sensitive enough (Polley et al. 1963). On the other hand, IgA anti-A is not haemolytic (for references, see eighth edition). Similar results are obtained if complement binding is detected by the use of specific antiglobulin sera (Polley et al. 1963; Adinolfi et al. 1966).
The minimum number of IgM anti-A molecules that, when bound to a group A red cell will activate complement, is not known, but on theoretical grounds might be one (see Chapter 3). The minimum number of IgG anti-A molecules for complement binding is expected to be substantial. Using an anti-C3c reagent to demonstrate complement binding by the antiglobulin test, a minimum of 14 µg of IgG anti-A/ml red cells was required, corresponding to approximately 7000 molecules of anti-A per cell or very approximately 1% of the maximum number that could be bound (Romano and Mollison 1975). An approximate estimate of the minimum number of IgG anti-A molecules that will cause lysis can be calculated from the data of Ishizaka and co-workers (1968). Making various assumptions about the equilibrium constant of the antibody and the number of antigen sites, the number of antibody molecules required for lysis is of the order of 30 000 per cell (NC Hughes-Jones, personal communication).
Factors Affecting Haemolysis
Three factors are known to affect antibody-mediated lysis of red cells in vitro.
Ethnic Differences in Frequencies of Haemolysins
The frequency of strong anti-A lysins (sera giving complete lysis of a 2% red cell suspension) was found to be slightly higher in one series of white people (USA) than in one of black people (Nigeria): 32% vs. 24%. On the other hand, for anti-B the figures were lower in white people: 10% vs. 27% for the Nigerians (Chaplin et al. 1956; Kulkarni et al. 1985). Amongst the Nigerians there were large differences between different ethnic groups. The overall frequency of sera with anti-A or -B lysins or both was 20.4% in Hausas (over 2000), but 60.2% in Yorubas (980) (Kulkarni et al. 1985).
Enhancement by Specific Antiglobulin Serum
If a serum fraction containing only IgG anti-A is titrated, the greatest dilution in which the anti-A can be detected by the indirect antiglobulin technique after adding anti-IgG is found to be about five doubling dilutions greater than the dilution which will agglutinate red cells suspended in saline; for example, a fraction that agglutinates red cells to a titre of 64 will, at a dilution of 2048, sensitize red cells to agglutination by anti-IgG (Polley et al. 1965). The use of anti-IgA increases the titre of IgA anti-A by about two doubling dilutions but anti-IgM scarcely enhances agglutination by IgM anti-A at all (Ishizaka et al. 1965; Adinolfi et al. 1966).
Enhancement of Agglutination by Serum or Plasma
Agglutination produced by IgG anti-A is enhanced in a medium of serum compared with saline, and plasma is considerably more effective than serum. When group A red cells were coated with varying amounts of IgG anti-A, the least amount of anti-A detectable by agglutination in plasma was about 0.5 µg/ml of cells, which was about the same as when they were tested with antiglobulin serum; however, the least amount detectable by agglutination in serum was 2.2–3.0 µg/ml of cells (Romano and Mollison 1975).
Inhibitory Effect of A Substance
As a rule, IgM anti-A is more readily inhibited than IgG anti-A (Witebsky 1948; Kochwa et al. 1961). To obtain an equivalent reduction in agglutinin titre the amount of purified human A substance required to inhibit IgG anti-A was found to be 20 times that required to inhibit IgM anti-A, although occasional exceptions were encountered by Polley and co-workers (1963). The difference between IgM and IgG antibodies seems to be due to the fact that, when reacting with A and B glycoproteins in solution, IgM anti-A and anti-B have higher binding constants than corresponding IgG antibodies, presumably because IgM combines multivalently with a single glycoprotein molecule in solution (Holburn and Masters 1974b). In the ease with which it is inhibited by A glycoprotein IgA is intermediate between IgM and IgG anti-A (Rawson and Abelson 1964; Adinolfi et al. 1966).
Thermal Optimum
Naturally occurring anti-A and anti-B react more strongly at 4°C than at 37°C. By contrast, immune sera react equally well at 37°C and at 4°C (Wiener 1941). IgG anti-A (in 2-ME-treated serum) agglutinates untreated or papain-treated red cells as well at 37°C as at 4°C (Voak et al. 1973).
Effect of Heating
Heating a serum at 56°C for 3 h has no measurable effect on the titre of IgG or IgA anti-A but leads to a distinct fall in IgM anti-A titre (Adinolfi et al. 1966).
Anti-A and Anti-B in Colostrum and Saliva
The titre of anti-A and anti-B tends to be higher in colostrum than in plasma from the same woman; alloagglutinins in colostrum are often wholly IgA but some IgM antibody may be present (for references, see eighth edition).
Anti-A in low concentrations is present in the saliva of most group O and group B subjects (Adinolfi et al. 1966). Anti-B is found a little less commonly than anti-A and is less common in group A than in group O subjects (Denborough and Downing 1969).
Concentration and Equilibrium Constants of IgM and IgG Anti-A and Anti-B
Concentrations Needed to Produce Agglutination
It has been concluded that to bring about 50% agglutination of a suspension of group A red cells, only 25 IgM anti-A molecules per cell are required, but for IgG anti-A the number is 20 000 (Greenbury et al. 1963). The minimal concentration of anti-A required for agglutination (i.e. at the endpoint of a titre) has been estimated to be, for IgG, 0.2 µg/ml, and for IgM, 0.01 µg/ml (Economidou et al. 1967a); taking into account that the molecular weight of IgM is five times that of IgG, the agglutinating effect of IgM is thus approximately 100 times as great as that of IgG.
Equilibrium Constants
Examples of both human and rabbit IgM and IgG anti-A were investigated by Economidou and co-workers (1967a). Equilibrium constants ranged from 0.6 to 13.0 × 10⁸ l/mol, but on average were approximately the same for IgM antibodies as for IgG. Monomers prepared from IgM anti-B were tested by Economidou and co-workers (1967b) and found to have an equilibrium constant 36–170 times lower than that of the whole IgM molecule, providing further support for the idea that native IgM anti-B (and anti-A) is attached to red cells by at least two binding sites. The authors concluded that with both IgM and IgG anti-B more than one antigen–antibody bond must be broken simultaneously to permit dissociation of the antibody.
The question whether IgG anti-A and anti-B normally bind to A and B sites bivalently or univalently does not seem to have been resolved. There is evidence for bivalent binding (Greenbury et al. 1965; Romans et al. 1980) and for univalent binding (Romano et al. 1983). Antibody concentration may determine which mode of binding predominates (see comment in footnote to Table 4.4). In any case, some IgG antibody molecules must bind univalently to each cell or there would be no agglutination.
The association constant of rabbit IgG anti-A was found to have the following values: with A1 cells, 7.4 × 10⁸ l/mol; with A1B cells, 5.1 × 10⁸ l/mol; and with A2 cells, 2.1 × 10⁸ l/mol. Anti-A was found to dissociate three times more rapidly from A2 than from A1 cells (Economidou and Hughes-Jones 1967).
The binding constant of human IgG anti-A for cord A1 red cells was found to be 3.3 × 10⁷ l/mol compared with 5.7–8.7 × 10⁷ l/mol for adult A1 red cells and that for cord A1B red cells to be 2.1 × 10⁷ l/mol compared with 3.2–7.0 × 10⁷ l/mol for adult A1B red cells (Economidou 1966).
Exposure to A and B Antigens in Early Life
The mother’s ABO group was found to have no influence on the serological characteristics (agglutinin titre, haemolytic activity, etc.) of anti-A in her offspring (Kennell and Muschel 1956).
Crossreacting Anti-A,B
Moss (1910) found that absorption with A or B cells could reduce the titre of group O serum against both A and B cells, and Landsteiner and Witt (1926) showed that some of the antibody in group O serum behaved as anti-AB; thus, the eluate made from A cells previously incubated with group O serum agglutinated both B and A cells. Similarly, the reaction of group O serum with B cells is inhibited by the saliva of A or B secretors and the reaction with A cells is inhibited by the saliva of B or A secretors.
Anti-A,B in group O serum is presumably an antibody directed against a structure common to A and B (Owen 1954). This conclusion is supported by the observation that the antibody can be completely inhibited with either D-galactose or N-acetylgalactosamine (Holburn 1976), which are structurally similar.
Crossreacting anti-A,B can be either IgG or IgM and can probably also be IgA: very little anti-A,B can be demonstrated in the serum of an unimmunized group O subject (Yokoyama and Fudenberg 1964). Crossreacting anti-A,B increased in concentration in all six group O subjects who were immunized with blood group substances (Contreras et al. 1983) and it was easier to demonstrate its presence if the cells used for absorption and elution were of a different specificity from that of the glycoprotein used for immunization (Dodd et al. 1967; Contreras et al. 1983). The role of anti-A,B in haemolytic disease of the newborn is discussed in Chapter 12.
Crossreacting anti-A,B may be cytotoxic for the lymphocytes of group A secretors (for references, see seventh edition, p. 281). Many monoclonal antibodies with anti-A,B specificity have been described (Messeter et al. 1984; Moore et al. 1984; Guest et al. 1992).
Anti-A1
If serum from a B or O person is absorbed once or twice with A2 cells it will no longer agglutinate A2 cells but will still agglutinate A1 cells. On the other hand if B or O serum is absorbed with A1 cells it will no longer react with A1 or with A2 cells. Accordingly, B (or O) serum is regarded as containing two separate populations of antibody molecules: anti-A reacting both with A2 and with A1 cells, and anti-A1 reacting only with A1 cells. The anti-A1 has a lower thermal range than the anti-A (Friedenreich 1931). If an excess of A2 cells is used in absorbing group B serum, anti-A1 as well as anti-A may be absorbed (Lattes and Cavazutti 1924).
When tested at room temperature, anti-A1 was found in 1–2% of A2 bloods and in 25% of A2B bloods in one study (Taylor et al. 1942); in 22% of A2B bloods in another (Juel 1959), and in 7.9% in A2 bloods and 35% in A2B bloods in another (Speiser et al. 1951). Anti-A1 in A2 and A2B subjects is usually inactive at 37°C.
Anti-A1 is very rare in infants; only one example was found in examining 10 000 blood samples (Speiser 1956).
As expected, anti-A1 in an A2B serum proved to be wholly IgM but, perhaps surprisingly, anti-A1 separated from group O serum by absorption with A2 cells was found to be wholly IgG (Plischka and Schäfer 1972). An example of anti-A1 that became active at 37°C after a series of transfusions was partly IgG and partly IgM (Lundberg and McGinniss 1975).
Two kinds of anti-A1 can be recognized: the first, which is the commoner, reacts with A1 red cells independently of their Ii group and is inhibited by the saliva of group A secretors; the second is anti-AI, which does not react with A1i cells and is not inhibited by the saliva of group A secretors.
Clinical Significance of Anti-A1
Most examples of anti-A1 found in A2 or A2B subjects agglutinate A1 cells only up to a temperature of 25°C or so and are of no clinical significance. Antibodies which are active in vitro at about 30°C but only dubiously active at 37°C will bring about the destruction of a proportion of A1 cells in vivo when a small dose of cells is injected (see Chapter 10). Those antibodies that are only dubiously active at 37°C would almost certainly fail to produce detectable red cell destruction following the transfusion of therapeutic quantities of blood. On the other hand, in several instances in which anti-A1 has been quite clearly active at 37°C, extensive destruction of A1 cells in vivo has been recorded (see below). Such cases are extremely rare.
It appears that following the transfusion of A1 cells to patients whose serum contains anti-A1, there is usually no increase in the thermal range of the anti-A1 (see Stratton 1955), but a few examples of the development of anti-A1, active at 37°C, have been described (e.g. Jakobowicz et al. 1961; Lundberg and McGinniss 1975). References to haemolytic transfusion reactions due to anti-A1 are given in Chapter 11.
Anti-A1 passively transferred to A2 or A2B recipients by the transfusion of group O blood may cause the destruction of subsequently transfused A1 or A1B red cells; see Chapter 11.
Anti-A1 may develop in the serum of group A2 subjects who have received a tissue graft from a group O donor 1 week or so previously; see Chapter 11.
Anti-A and Anti-B As Autoantibodies
Anti-A and anti-B are sometimes found as autoantibodies (see Chapter 7). Anti-A or anti-B ‘pseudo-autoantibodies’ may be found in A, B or AB subjects who have recently received a group O bone marrow or solid organ transplant (see Chapter 11).
Anti-A1 has been found as an autoantibody, reacting weakly at room temperature, in a patient of group A1 without haemolytic anaemia. The auto-anti-A1 reacted with adult A1i red cells and was inhibited by group A secretor saliva (Wright et al. 1980).
Anomalous Occurrence of Anti-A and Anti-B
Occasionally, anti-A and anti-B are found in A or B subjects, respectively, but not as autoagglutinins, i.e. with a specificity which differs from normal anti-A or anti-B. A few examples of anti-A of this kind have been found in A1 subjects (M Stroup, personal communication). As mentioned above, the serum from most cis AB people contains allo-anti-B.
Anti-H and Anti-HI
Anti-H is a very uncommon antibody; it is found in subjects of the very rare phenotype Oh as a haemolysin, and as an agglutinin which is almost as active at 37°C as at O°C. Although usually IgM, it may be partly IgG (Haddad 1974). In rare cases, anti-H may also be found in A1 subjects (Gouge et al. 1977).
The ‘normal incomplete cold antibody’ has anti-H specificity and is neutralized by secretor saliva; see Chapter 7.
The name ‘anti-H’ used to be applied to an alloagglutinin found not uncommonly in sera from A1 and A1B donors (see Morgan and Watkins 1948), but the name was changed to anti-HI after it had been shown that the antibody reacted only with red cells carrying both H and I specificities (Rosenfield et al. 1964). Anti-HI, like anti-H, reacts most strongly with O red cells and most weakly with A1B cells. Voak and co-workers (1968) mentioned that all examples of anti-HI that they had found were in women, most of whom were pregnant. Their findings were made impressive by their mention of the fact that more than 90 000 samples from males were tested each year.
An example of anti-H (possibly -HI), which in the presence of sodium azide (0.1% w/v) reacted strongly at 37°C, but in the absence of azide reacted only weakly and only in the cold, has been encountered (P Watson, personal communication, 1981). The effect of the azide appeared to be due to some interaction with plasma protein rather than with the red cell membrane. An autoagglutinin enhanced by azide is mentioned in Chapter 7.
Anti-A, -A1, -B and -H Lectins
A highly potent anti-A can be extracted from the albumin gland or the eggs of various species of snail, for example Helix aspersa, Helix hortensis, Helix pomatia, Otala lactea and Cepaea nemoralis (for references, see eighth edition).
Some snail anti-A extracts react equally well with A1 and A2 red cells, although others do not and still others react equally well with A1 and A2 cells but less strongly with A2B. The different specificities of the anti-A from different snails can be indicated by referring to them, for example, as anti-AHP, for H. pomatia. Anti-A purified from the albumin gland of H. pomatia was found to be a fairly homogeneous protein with a molecular weight of 100 kDa; from the point of view of specificity, it was more homogeneous than human anti-A (Hammarström and Kabat 1969). Snail anti-A reactions are enormously enhanced with bromelin-treated red cells.
Useful anti-B can be prepared from the fungus Fomes fomentarius (Mäkelä et al. 1959).
Reagents with the specificity anti-H can be obtained from plants (Ulex europaeus, Cytisus sessilifolius, Laburnum alpinum and Lotus tetragonolobus). Ulex extract is the most commonly used reagent for determining secretor status by testing inhibition by saliva. The extract reacts about equally well with HI as with Hi red cells, whereas extracts from the other three plants mentioned tend to react more strongly with HI cells (Voak and Lodge 1971). The extract from L. tetragonolobus does not react with type I chains and is therefore unsuitable for testing for H in secretions (Pereira and Kabat 1974).
Immune Responses to A and B Antigens
Incompatible Transfusions
If A blood is injected intravenously into a person of group B or group O, or B blood is injected into a person of group A or group O, the titre of anti-A or anti-B increases after an initial fall due to absorption of antibody (Wiener 1941).
An immune response following the transfusion of ABO-incompatible blood can be inferred from a case in which a boy aged 6 years received two transfusions from his father at an interval of 18 days. The first transfusion was without incident but the second produced a severe haemolytic reaction. It was now found that the father was group B and the child group O. Direct matching before the first transfusion had not revealed incompatibility, and it may be presumed that at that time the child had only a low titre of anti-B. Because of the success of the first transfusion, it was considered unnecessary to carry out a direct matching test before the second transfusion, although had the test been repeated the incompatibility would presumably have been obvious (Thalheimer 1921).
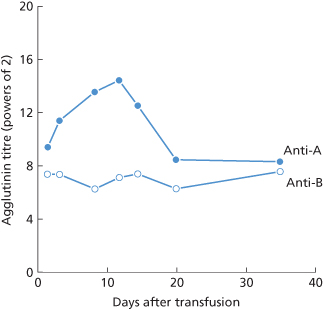
In a case illustrated in Figure 4.1, the patient (group O) received 360 ml of group B blood; 8 h after transfusion, the anti-B titre was only 2 compared with an anti-A titre of 128. After 48 h the anti-B titre started to increase, and between the sixth and tenth days it rose very rapidly to a peak. It then fell slowly and had still not reached a stable level 3 weeks after transfusion. After the transfusion of incompatible blood the peak titre of anti-A or anti-B is usually reached after about 9–12 days (Boorman et al. 1945; Figure 4.2). Although an increase in agglutinin titre is common after the transfusion of ABO-incompatible blood it is by no means invariable; it was noted in only 6 out of 15 group O subjects after the i.v. injection of 25 ml of A1 or A2 blood (Wiener et al. 1953a).
Figure 4.1 Changes in anti-A and anti-B titre (as log2) in a group O patient after the transfusion of 360 ml of group B blood (at ‘B’) and of group A serum (at ‘A’). These titrations and those recorded in Figure 4.2 were performed by the standard technique of making doubling dilutions, using the same unrinsed pipette, and were not checked by making direct dilutions.
(Source: Data of Mollison and Young 1941. Reproduced with permission of Elsevier.)
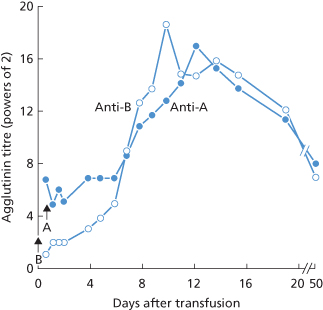
Figure 4.2 Changes in anti-A and anti-B agglutinin titre in a group O patient after the transfusion of 45 ml of group A blood (data from Mollison 1943).
(Source: Data from Mollison 1943. Reproduced with permission of the BMJ Publishing Group.)
An initial decrease in titre, after the transfusion of ABO-incompatible blood was observed in several of the subjects receiving only 25 ml of blood, referred to above, and has even been noted after the injection of as little as 4 ml of incompatible red cells (see Chapter 10).
Intramuscular Injections of Incompatible Blood
In a series in which subjects received four to six injections, each of 10–15 ml of a 50% suspension of twice-washed red cells, some group O or B subjects who had received A red cells developed powerful anti-A haemolysins, although no changes in agglutinin titre were observed (Thomsen 1930). The development of haemolysins has also been noted following i.m. injections of blood (Rapoport and Stokes 1937).
During an epidemic of poliomyelitis, the prophylactic value of i.m. injections of blood was investigated; 60 ml of blood were taken from one or other of a child’s parents and injected into the child’s buttocks. Among 1341 children, 52 showed a reaction that followed a characteristic pattern: some 6 days after the injection the child became acutely ill and febrile; the sites of injection became hot, red and painful. The reaction subsided after 3–4 days. In 17 cases the blood groups of the child and its parents were investigated; in every case the parent’s cells were incompatible with the child’s serum. In 13 out of 17 cases in which the test was made within 4 weeks of injection, the child’s serum haemolysed the parent’s cells. In one case, a child who had had a reaction was given a second injection of blood some months later; in this case, the second reaction developed only 28 h after the injection (Rapoport and Stokes 1937).
Solid Organ Transplants
Except for bone marrow transplantation, where ABO incompatibility can be dealt with by depleting the donor bone marrow of red cells or by lowering the titre of anti-A and anti-B in the recipient by plasma exchange, organ transplantation across the ABO barrier often leads to vascular or humoral hyperacute graft rejection (Cooper 1990; for further discussion, see Chapter 14).
Injections of Human Blood Group Substances
The A and B group-specific substances are present in the plasma and serum. Even when the substances cannot be detected serologically, they may provoke an immune response following the transfusion of serum to a suitable recipient (e.g. A to O). The peak of the immune response is usually reached at about 10–15 days after the transfusion (Aubert et al. 1942; see also Figure 4.1). Immune responses to A have also been produced by injecting saliva (Wiener et al. 1953b) and urine (Freda et al. 1957).
Cryoprecipitates and factor IX concentrates may also stimulate the production of ‘immune’ anti-A and anti-B (McShine and Kunst 1970).
Using a purified preparation of human A substance, substantial increases in titre and avidity of anti-A were found after injecting 1.5-mg doses of the preparation; 0.1 mg appeared to be a suboptimal dose (Polley et al. 1963; Contreras et al. 1983).
Alloimmunization by A and B Antigens During Pregnancy
The term ‘ABO-incompatible’ may conveniently be used to describe a pregnancy in which the infant’s red cells carry A or B, and the mother’s serum contains the corresponding antibody. Dienst (1905) first observed that, following such pregnancies, after delivery there might be a rise in the mother’s anti-A or anti-B agglutinin titre. In an investigation in which tests were made only for anti-A or anti-B haemolysins, the incidence in recently delivered group O women was 14.5%, compared with 3.5% in a control series of group O males. In relation to the group of infants born to the mothers, the incidence of haemolysins was as follows: O infants, 7.1%; B infants, 20.8%; and A infants, 28.1% (Jonsson 1936).
After delivery, most commonly between 10 and 20 days, there is a rise in the titre of anti-A or anti-B agglutinins in most women who have given birth to an infant with ABO-incompatible red cells (Boorman et al. 1945). There is evidence that those infants who fail to stimulate an immune response are non-secretors (Smith 1945).
Injections of Purified Group-Specific Substances of Animal Origin
An experiment made by Forssman (1911) revealed the existence of serologically related substances in animals widely separated in the zoological system: the injection of extracts of guinea pig organs into rabbits provoked the formation of lysins active against sheep red cells. Subsequently, the name ‘Forssman antigen’ was used for any substance that would stimulate the formation of sheep haemolysin. The sheep antibody produced in this way is an example of a ‘heterophil’ antibody; the cardinal feature of such an antibody is that it is produced by an animal in response to contact with an antigen from a different species. It is the antibody that is heterophil, not the antigenic determinant; the antigens are identical or related (Franks and Coombs 1969).
Human A antigen is closely related to the Forssman antigen; in both, the terminal sugar is N-acetylgalactosamine (see ‘The FORS blood group system’).
In the past, hog A substance and equine AB substance were used for stimulating the production of potent anti-A or anti-B in human volunteers and for neutralizing anti-A and anti-B in group O plasma, but animal group-specific substances are no longer considered suitable for use in humans.
Injections of Vaccines Containing Hog Pepsin
Increases in anti-A or anti-B concentration following the injection of diphtheria or tetanus toxoid are due to the presence of hog pepsin in the preparation. Tetanus toxoid prepared in a medium free from peptone of animal origin does not cause rises in anti-A or anti-B titre (Hendry and Sickles 1951).
Injections of Pneumococcal or Influenza Vaccine
Substantial rises in anti-A titre have been found in patients receiving certain batches of pneumococcal vaccine. The effect appeared to be due to A-like substances from culture media tightly bound to bacterial polysaccharide (Noël 1981; Siber et al. 1982). Similarly, injections of influenza virus vaccine may stimulate anti-A, due to the incorporation of A-like substances present in the cytoplasm of the chick embryo on which the virus is grown (Springer and Tritel 1962; Springer and Schuster 1964).
Clinical Significance of Stimulation of Anti-A and Anti-B by Vaccines, Etc.
The practical importance of injections of vaccine containing hog pepsin in rendering group O donors ‘dangerous’ was shown by Dausset and Vidal (1951); they described six haemolytic reactions following the transfusion of O blood to A recipients; in every case the donor had received injections of vaccine known to contain hog pepsin. In most cases the donors had received the injections within the previous 3 months, but in two instances it was shown that the immune characteristics of the donor’s anti-A persisted for at least 7 years after the last injection. In a case described in Chapter 11 of a severe haemolytic transfusion reaction in a group A patient following the transfusion of group O blood, 1 month before giving blood the donor had received an injection of anti-tetanus serum prepared by digestion with hog pepsin. It seems logical to conclude that stimulation of anti-A in group O women following the injection of vaccines, etc. containing A-like substances must also lead to the production of potent IgG anti-A and thus increase the risk that any A infants born subsequently will be affected by haemolytic disease of the newborn. In fact, there is virtually no evidence of the magnitude of the risk. One survey suggested that the offspring of women who had received injections of tetanus toxoid during the last trimester of pregnancy had an increased risk of developing ABO haemolytic disease (Gupte and Bhatia 1980) but the control group was not strictly comparable.
In a study of 11 moderately severe cases of haemolytic disease of the newborn due to ABO incompatibility, not one of the mothers gave a history of having had injections of bacterial vaccines or toxoids (Crawford et al. 1953).
Toxocara Infection
Emulsified toxocara worms inhibit anti-A and anti-B; infected children commonly have high titres of these antibodies (Heiner and Kevy 1956; Shrand 1964).
ABH Antigens Acquired by Viruses
Measles virus cultured in vitro will take on the ABH status of the host cell in which it is grown. These ABH-active virus particles can then be neutralized by natural ABO antibodies in a complement-dependent manner (Preece et al. 2002). These results suggest that virus particles produced in infected group A individuals would be susceptible to neutralization by the natural anti-A of group B and O individuals.
IgM, IgG and IgA Anti-A and Anti-B in Relation to Immune Responses
In group B subjects, before and after stimulation with A substance, IgM anti-A predominates. In group O subjects, even before stimulation, some of the anti-A may be IgG; after stimulation, IgG anti-A as well as IgM anti-A is produced in most subjects (Abelson and Rawson 1961; Kochwa et al. 1961).
In an investigation of the effect of injecting purified human A substance into five normal B subjects, no IgG anti-A could be detected before antigenic stimulation; after two injections, each of 1.5 mg, at an interval of 1 week, low-titre IgG anti-A was produced in three out of the five subjects, but in no case was this antibody readily haemolytic. In four out of the five the titre of IgM anti-A increased. Of five O subjects who were stimulated in the same way, three had IgG anti-A before stimulation and all five had IgG anti-A after stimulation (Polley et al. 1963).
Most sera containing IgA anti-A have come from subjects who have recently received an antigenic stimulus (Kunkel and Rockey 1963; lshizaka et al. 1965), although in a few group O subjects IgA anti-A or anti-B are found before immunization (Contreras et al. 1983).
Persistence of Immune Anti-A
After an injection of hog A substance or horse A and B substances, the peak level of antibody tended to be maintained for many months. There was then a steady fall, but even after 12 months the level was still about 50% of the peak (Allen and Kabat 1958). In blood donors whose serum contained anti-A or anti-B haemolysins, repeated tests during a 2-year period showed that these antibodies persisted in 80% of subjects (Tovey 1958).
The LE System
The LE (Lewis) blood group system differs from most of the other human blood group systems in some important ways. First, it is a system of soluble antigens present in saliva and plasma (Grubb 1951) and red cells acquire their Le phenotype by adsorbing Le substances from the plasma (Sneath and Sneath 1955). Second, the Le phenotype of the red cells is influenced by the ABH secretor status (although the Le genes and secretor genes are inherited independently); subjects who inherit Le will have the red cell phenotype Le(a+ b−) if they are a non-secretor (sese), but the phenotype Le(a− b+) if they are secretors (Sese or SeSe) (Grubb 1951; Ceppellini 1955). Third, as the products of ABH and Le share the same precursor substrate, the Lewis phenotype may be modified by the ABO phenotype; for example, A1 may decrease the expression of Leb (Andresen 1948) and also of Lea (Cutbush et al. 1956). The Le gene is an alpha 1,3/4 fucosyltransferase (FUT3). The Se gene is an alpha 1,2 fucosyltransferase (FUT2) as described previously in this chapter. FUT3 transfers L-fucose in α1 → 4 to the subterminal N-acetyl-D-glucosamine of a type 1 acceptor, making the Lea and Leb epitopes of plasma and secretions in non-secretors and secretors respectively (Table 4.5, Figure 4.3). Although FUT3 uses preferentially type 1 chains, it can also use type 2 chains, giving rise to Lex and Ley epitopes (type 2 isomers of Lea and Leb).
Table 4.5 Products of Le, A and B genes in secretions.
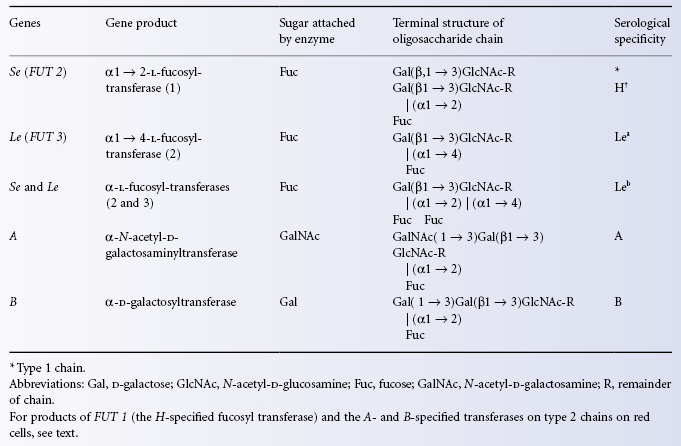
Figure 4.3 Biosynthesis of Lewis, HAB and combined antigens in secretions. R, rest of molecule.
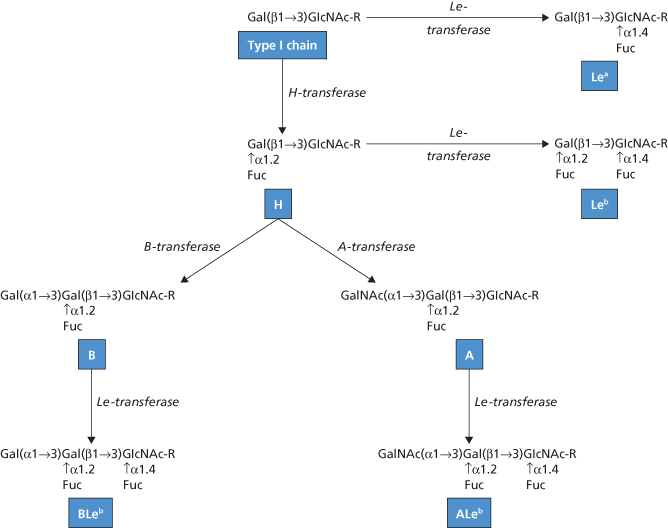
Related posts:
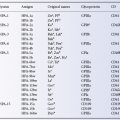 Immunology of leucocytes, platelets and plasma components
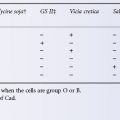 Red cell antibodies against self-antigens, bound antigens and induced antigens
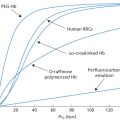 Alternatives to allogeneic transfusion
 The transfusion of platelets, leucocytes, haematopoietic progenitor cells and plasma components
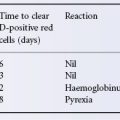 The Rh blood group system (including LW and RHAG)
Stay updated, free articles. Join our Telegram channel

Full access? Get Clinical Tree


