Clinicians spend a great deal of time distinguishing “normal” from “abnormal.” Is the thyroid normal or slightly enlarged? Is the heart murmur “innocent” (of no health importance) or a sign of valvular disease? Is a slightly elevated serum alkaline phosphatase evidence of liver disease, unrecognized Paget disease, or nothing important?
When confronted with something grossly different from the usual, there is little difficulty telling the two apart. We are all familiar with pictures in textbooks of physical diagnoses showing massive hepatosplenomegaly, huge goiters, or hands severely deformed by rheumatoid arthritis. It takes no great skill to recognize this degree of abnormality, but clinicians are rarely faced with this situation. Most often, clinicians must make subtler distinctions between normal and abnormal. That is when skill and a conceptual basis for deciding become important.
Decisions about what is abnormal are most difficult among relatively unselected patients, usually found outside of hospitals. When patients have already been selected for special attention, as is the case in most referral centers, it is usually clear that something is wrong. The tasks are then to refine the diagnosis and to treat the problem. In primary care settings and emergency departments, however, patients with subtle manifestations of disease are mixed with those with the everyday complaints of basically healthy people. It is not possible to pursue all of these complaints aggressively. Which of many patients with abdominal pain have self-limited gastroenteritis and which have early appendicitis? Which patients with sore throat and hoarseness have a viral pharyngitis and which have the rare but potentially lethal Haemophilus epiglottitis? These are examples of how difficult and important distinguishing various kinds of abnormalities can be.
The point of distinguishing normal from abnormal is to separate those clinical observations that should be the basis for action from those that can be simply noted. Observations that are thought to be normal are usually described as “within normal limits,” “unremarkable,” or “non-contributory” and remain buried in the body of a medical record. The abnormal findings are set out in a problem list or under the heading “impressions” or “diagnoses” and are the basis for action.
Simply calling clinical findings normal or abnormal is undoubtedly crude and results in some misclassification. The justification for taking this approach is that it is often impractical or unnecessary to consider
the raw data in all their detail. As Bertrand Russell pointed out, to be perfectly intelligible one must be at least somewhat inaccurate, and to be perfectly accurate, one is too often unintelligible. Physicians usually choose to err on the side of being intelligible—to themselves and others—even at the expense of some accuracy. Another reason for simplifying data is that each aspect of a clinician’s work ends in a decision— to pursue evaluation or to wait, to begin a treatment or to reassure. Under these circumstances, some sort of “present/absent” classification is necessary.
Table 3.1 is an example of how relatively simple expressions of abnormality are derived from more complex clinical data. On the left is a typical problem list, a statement of the patient’s important medical problems. On the right are some of the data on which the decisions to call them problems are based. Conclusions from the data, represented by the problem list, are by no means uncontroversial. For example, the mean of the four diastolic blood pressure measurements is 92 mm Hg. Some might argue that this level of blood pressure does not justify the label “hypertension” because it is not particularly high and there are some disadvantages to telling patients they are sick and recommending drugs. Others might consider the label appropriate, considering that this level of blood pressure is associated with an increased risk of cardiovascular disease and that the risk can be reduced by treatment, and the label is consistent with guidelines. Although crude, the problem list serves as a basis for decisions—about diagnosis, prognosis, and treatment—and clinical decisions must be made, whether actively (by additional diagnostic tests and treatment) or passively (by no intervention).
This chapter describes some of the ways clinicians distinguish normal from abnormal. First, we consider how biologic phenomena are measured, how they vary, and how they are summarized. Then, we discuss how these data are used as a basis for value judgments about what is worth calling abnormal.
TYPES OF DATA
Measurements of clinical phenomena yield three kinds of data: nominal, ordinal, and interval.
Nominal Data
Nominal data occur in categories without any inherent order. Examples of nominal data are characteristics that are determined by a small set of genes (e.g., ABO blood type and sex) or are dramatic, discrete events (e.g., death, dialysis, or surgery). These data can be placed in categories without much concern about misclassification. Nominal data that are divided into two categories (e.g., present/absent, yes/no, alive/dead) are called dichotomous.
Ordinal Data
Ordinal data possess some inherent ordering or rank such as small to large or good to bad, but the size of the intervals between categories is not specified. Some clinical examples include 1+ to 4+ leg edema, heart murmurs grades I (heard only with special effort) to VI (audible with the stethoscope off the chest), and muscle strength grades 0 (no movement) to 5 (normal strength). Some ordinal scales are complex. The risk of birth defects from drugs during pregnancy is graded by the U.S. Food and Drug Administration on a five-category scale ranging from A, “no adverse effects in humans”; through B, an adverse effect in animal studies not confirmed in controlled studies in women or “no effect in animals without human data”; C, “adverse effect in animals without human data or no available data from animals or humans”; and D, “adverse effects in humans, or likely in humans because of adverse effects in animals”; to X, “adverse effects in humans or animals without indication for use during pregnancy” (
1).
Interval Data
For
interval data, there is inherent order and the interval between successive values is equal, no matter where one is on the scale. There are two types of interval data.
Continuous data can take on any value in a continuum, regardless of whether they are reported
that way. Examples include most serum chemistries, weight, blood pressure, and partial pressure of oxygen in arterial blood. The measurement and description of continuous variables may in practice be confined to a limited number of points on the continuum, often integers, because the precision of the measurement, or its use, does not warrant greater detail. For example, a particular blood glucose reading may in fact be 193.2846573 … mg/dL but is simply reported as 193 mg/dL.
Discrete data can take on only specific values and are expressed as counts. Examples of discrete data are the number of a woman’s pregnancies and live births and the number of migraine attacks a patient has in a month.
It is for ordinal and interval data that the question arises, “Where does normal leave off and abnormal begin?” When, for example, does a large normal prostate become too large to be considered normal? Clinicians are free to choose any cutoff point. Some of the reasons for the choices are considered later in this chapter.
PERFORMANCE OF MEASUREMENTS
Whatever the type of measurement, its performance can be described in several ways.
Validity
Validity is the degree to which the data measure what they were intended to measure—that is, the degree to which the results of a measurement correspond to the true state of the phenomenon being measured. Another word for validity is accuracy.
For clinical observations that can be measured by physical means, it is relatively easy to establish validity. The observed measurement is compared with some accepted standard. For example, serum sodium can be measured on an instrument recently calibrated against solutions made up with known concentrations of sodium. Laboratory measurements are commonly subjected to extensive and repeated validity checks. For example, it is common practice for blood glucose measurements to be monitored for accuracy by comparing readings against high and low standards at the beginning of each day, before each technician begins a day, and after any changes in the techniques, such as a new bottle of reagent or a new battery for the instrument. Similarly, accuracy of a lung scan for pulmonary embolus can be measured against pulmonary angiography, in which the pulmonary artery anatomy is directly visualized. The validity of a physical examination finding can be established by comparing it to the results of surgery or radiologic examinations.
Some other clinical measurements such as pain, nausea, dyspnea, depression, and fear cannot be verified physically. In patient care, information about these phenomena is usually obtained informally by “taking a history.” More formal and standardized approaches, used in research, are structured interviews and questionnaires. Individual questions
(items) are designed to measure specific phenomena (e.g., symptoms, feelings, attitudes, knowledge, beliefs) called
constructs, and these items are grouped together to form
scales. Table 3.2 shows one such scale, a brief questionnaire used to detect alcohol abuse and dependence.
Three general strategies are used to establish the validity of measurements that cannot be directly verified physically.
Content Validity
Content validity is the extent to which a particular method of measurement includes all of the dimensions of the construct one intends to measure and nothing more. For example, a scale for measuring pain would have content validity if it included questions about aching, throbbing, pressure, burning, and stinging, but not about itching, nausea, and tingling.
Criterion Validity
Criterion validity is present to the extent that the measurements predict a directly observable phenomenon. For example, one might see whether
responses on a scale measuring pain bear a predictable relationship to pain of known severity: mild pain from minor abrasion, moderate pain from ordinary headache and peptic ulcer, and severe pain from renal colic. One might also show that responses to a scale measuring pain are related to other, observable manifestations of the severity of pain such as sweating, moaning, writhing, and asking for pain medications.
Construct Validity
Construct validity is present to the extent that the measurement is related in a coherent way to other measures, also not physically verifiable, that are believed to be part of the same phenomenon. Thus, one might be more confident in the construct validity of a scale for depression to the extent that it is related to fatigue and headache—constructs thought to be different from but related to depression.
Validity of a scale is not, as is often asserted, either present or absent. Rather, with these strategies, one can build a case for or against its validity under the conditions in which it is used, so as to convince others that the scale is more or less valid.
Because of their selection and training, physicians tend to prefer the kind of precise measurements that the physical and biologic sciences afford and may avoid or discount others, especially for research. Yet relief of symptoms and promoting satisfaction and a feeling of well-being are among the most important outcomes of patient care and are central concerns of patients and doctors alike. To guide clinical decisions, research must include them, lest the picture of medicine painted by the research be distorted.
The term “hard” is usually applied to data that are reliable and preferably dimensional (e.g., laboratory data, demographic data, and financial costs). But clinical performance, convenience, anticipation, and familial data are “soft.” They depend on subjective statements, usually expressed in words rather than numbers, by the people who are the observers and the observed.
To avoid such soft data, the results of treatment are commonly restricted to laboratory information that can be objective, dimensional, and reliable—but it is also dehumanized. If we are told that the serum cholesterol is 230 mg/dL, that the chest x-ray shows cardiac enlargement, and that the electrocardiogram has Q waves, we would not know whether the treated object was a dog or a person. If we were told that capacity at work was restored, that the medicine tasted good and was easy to take, and that the family was happy about the results, we would recognize a human set of responses.
Reliability
Reliability is the extent to which repeated measurements of a stable phenomenon by different people and instruments at different times and places get similar results. Reproducibility and precision are other words for this property.
The reliability of laboratory measurements is established by repeated measures—for example, of the same serum or tissue specimen—sometimes by different people and with different instruments. The reliability of symptoms can be established by showing that they are similarly described to different observers under different conditions.
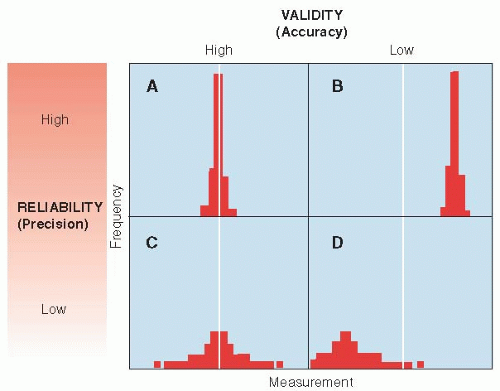
The relationships between reliability and validity are shown in simple form in
Figure 3.1. Measurements can be both accurate (valid) and reliable (precise), as shown in
Figure 3.1A. Measurements can be very reliable but inaccurate if they are systematically off the mark, as in
Figure 3.1B. On the other hand, measurements can be valid on the average but not be reliable, because they are widely scattered about the true value, as shown in
Figure 3.1C. Finally, measurements can be both invalid and imprecise, as shown in
Figure 3.1D. Small numbers of measurements with poor reliability are at risk of low validity because they are likely to be off the mark by chance alone. Therefore, reliability and validity are not altogether independent concepts. In general, an unreliable measurement cannot be valid and a valid measurement must be reliable.
Range
An instrument may not register very low or high values of the phenomenon being measured; that is, it has limited range, which limits the information it conveys. For example, the Basic Activities of Daily Living scale that measures patients’ ability in dressing, eating, walking, toileting, maintaining hygiene, and transferring from bed or chair does not measure ability to read, write, or play the piano (activities that might be very important to individual patients).
Responsiveness
An instrument demonstrates
responsiveness to the extent that its results change as conditions change. For example, the New York Heart Association scale—Classes I to IV (no symptoms of heart failure and no limitations of ordinary physical activity, mild symptoms and slight limitation of ordinary physical activity, marked limitation of ordinary physical activity because of fatigue, palpitation or dyspnea,
and inability to carry out any physical activity, even at rest, because of symptoms)—is not sensitive to subtle changes in congestive heart failure, ones that might matter to patients. However, measurements of ejection fraction by echocardiography can detect changes so subtle that patients do not notice them.
Interpretability
Clinicians learn to interpret the significance of a PCO2 of 50 or a blood sugar of 460 through experience, in which they repeatedly calibrate patients’ current conditions and clinical courses against such test results. However, scales based on questionnaires may have little intuitive meaning to clinicians and patients who do not use them regularly. To overcome this interpretability disadvantage, researchers can “anchor” scale values to familiar states. To help clinicians interpret scale values, the numbers are anchored to descriptions of everyday performance. For example, values of the Karnofsky Performance Status Scale, a measure of functional capacity commonly used in studies of cancer patients receiving chemotherapy, range from 100 (normal) to 0 (dead). Just how bad is it to have a value of 60? At a scale value of 60, patients require occasional assistance but are able to care for most of their personal needs.
VARIATION
Overall variation is the sum of variation related to the act of measurement, biologic differences
within individuals from time to time, and biologic differences
among individuals (
Table 3.3).
Variation Resulting from Measurement
All observations are subject to variation because of the performance of the instruments and observers involved in making the measurements. The conditions
of measurement can lead to a biased result (lack of validity) or simply random error (lack of reliability). It is possible to reduce this source of variation by making measurements with great care and by following standard protocols. However, when measurements involve human judgment, rather than machines, variation can be particularly large and difficult to control.
Variations in measurements also arise because they are made on only a sample of the phenomenon being described, which may misrepresent the whole. Often, the sampling fraction (the fraction of the whole that is included in the sample) is very small. For example, a liver biopsy represents only about 1/100,000 of the liver. Because such a small part of the whole is examined, there is room for considerable variation from one sample to another.
If measurements are made by several different methods, such as different laboratories, technicians, or instruments, some of the measurements may be unreliable or may produce results that are systematically different from the correct value, which could contribute to the spread of values obtained.


