Highlights
- •
Less than 1% of cancer genome-wide association studies include Hispanic Americans.
- •
Hispanic American men present higher rates of advanced-stage PCa and metastases.
- •
TMPRSS2-ERG (36%) and TMB-High (20%) are more frequent in Hispanic Americans.
- •
This emphasizes the need for genomic research in underrepresented Hispanic groups.
Abstract
Introduction
Prostate cancer (PCa) is a major cause of cancer mortality among American men, with significant racial and ethnic disparities. Hispanic Americans (HAs) are underrepresented in PCa genomic studies despite comprising a large portion of cancer diagnoses. By comparing the frequency of common PCa mutations between HA and non-Hispanics (NHs), we aim to continue understanding the drivers of disparities in this underrepresented population.
Methods
We retrospectively analyzed 111 metastatic prostate adenocarcinoma patients with 313 tissue, liquid, and germline genomic sample results from patient blood at the University of Arizona Cancer Center (2015-2023). Patients were categorized by ethnicity into HAs and NHs. We assessed de-identified demographic, pathological, clinical, and genomic data. Continuous and categorical variables determined statistical significance were evaluated using t-tests or Kruskal-Wallis Rank sum tests and Chi-square or Fisher’s exact tests, respectively ( P < 0.05). Time-to-event data was analyzed using Kaplan-Meier Methods.
Results
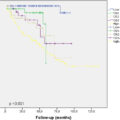
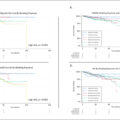
Of the 111 patients included HAs represented 41%. HAs had higher median PSA levels at the time of diagnosis (148.5 ng/ml vs. 52.6 ng/ml, P = 0.024), more advanced pathological disease stages, including T4 (36% vs. 15%), and M1c (37.8% vs. 13.6%), less time to first-line treatment (1 vs 2 months, P ≤ 0.01), and higher median survival time from first-line to second-line treatment (23 vs 13 months, P < 0.01). TMPRSS2-ERG fusion and TMB-High (>10) mutations were more common in HAs (36% vs. 6%, P = 0.0009; 20% vs. 3%, P = 0.003).
Conclusion
Our study shows a more advanced clinical presentation of HAs PCa compared to NHs. Furthermore, significant genomic differences in PCa between HAs and NHWs, particularly in TMPRSS2-ERG fusion and TMB-High mutations, highlight the need for early detection and personalized treatment options. Addressing treatment disparities and expanding genomic research in HAs are crucial for developing effective interventions in this underrepresented population.
1
Introduction
Prostate cancer (PCa) is the second leading cause of cancer-related mortality in American men, with notable disparities in incidence and outcomes across different racial and ethnic groups. While the overall incidence of PCa has declined over the past few decades, the proportion of cases diagnosed at an advanced stage has increased [ , ]. The term ‘Hispanic’ refers to individuals who identify with or are descended from populations with a historical and cultural connection to Spain or Spanish-speaking countries [ ]. This designation is irrespective of race and encompasses a diverse cultural background with variations depending on the country of origin [ ]. Among Hispanic American (HA) men, PCa accounts for approximately 25% of all cancer diagnoses [ ]. Although the historical incidence rates of PCa are similar between non-Hispanic (NH) and HA men, NHs tend to have a lower proportion of advanced-stage PCa and higher 5-year survival rates compared to HAs and non-Hispanic Black (NHB) men [ , ]. Furthermore, PCa cases in HAs might be underestimated due to lower PCa screening rates within this population [ ].
A complex interplay of socioeconomic and genetic factors influences the pathogenesis of PCa. While disparities in healthcare access and socioeconomic status are well-documented contributors to differences in PCa outcomes among racial and ethnic groups, emerging research emphasizes the significant role of genetic factors as major drivers of disparities [ ]. For instance, NHB men exhibit higher rates of DNA hypermethylation, increased androgen receptor activity (AR), and shorter CAG repeats in the AR gene, all of which are associated with the progression of PCa [ ]. In a large GWAS cohort study, Haiman et al. demonstrated that Black men have a higher genetic risk score for PCa compared to NHW men [ ]. Although several studies have analyzed the genetic landscape of PCa among several racial groups [ ], scarce evidence exists providing concrete genomic data on HAs [ ]. By comparing the frequency of common PCa mutations between HAs and NHs, we aim to continue understanding the drivers of disparities in this underrepresented population.
2
Methods
We performed a retrospective analysis of 111 patients with metastatic prostate adenocarcinoma, either de novo or progression after radical prostatectomy, with 313 genomic tests who presented to the University of Arizona Cancer Center (UACC) from 2015 to 2023. Patients who underwent tissue, liquid, and germline genetic testing were included. Patients with no metastasis and incomplete data were excluded. Patients were divided by their medical records documentation and self-reported race and ethnicity into HAs or NHs.
2.1
Demographics
The following demographic variables were analyzed: mean age at presentation, marital status, preferred language, medical insurance, obesity (body mass index [BMI]>30), personal cancer history, family history of cancer in 1st – degree relatives, active smoking status, alcohol or drug use, and prostatitis history.
2.2
Pathology
The following pathologic variables were analyzed at the presentation by biopsy or following prostatectomy in untreated Pca: Karnofsky scale, median prostate-specific antigen (PSA) levels, Gleason score, disease volume (presence of visceral metastases or ≥4 bone lesions with ≥1 beyond the vertebral bodies and pelvis) [ ], disease risk (positive bone scan or metastatic lesions at the time of diagnosis on computed tomography or magnetic resonance imaging) [ ], and stage (T, N, M 8th Edition) [ ].
2.3
Interventions and outcomes
The following clinical variables were analyzed: Neoadjuvant androgen deprivation therapy (ADT), radiation therapy to prostate, surgery radical prostatectomy, postsurgery salvage radiation therapy, palliative radiation therapy to metastatic site, clinical trial participation, median time to first-line (1L) treatment, 1 L combination therapy, median PSA response 3 months after starting treatment (>90% PSA response), median time to second-line (2L) treatment, median survival time (months) from 1 L to 2 L treatment, and median survival time (months) from diagnosis to death or last contact.
2.4
Genomic biomarkers
All patients had somatic tissue (by Caris ®), liquid (by Guardant ®), and/or germline (by Ambry ®) testing. Somatic testing included treatment-naïve, hormone-sensitive tissue, with the somatic source being prostate tissue for those who had undergone radical prostatectomy and lymph nodes for those who had not. Liquid testing included treatment progression castration/hormone-resistant state, and germline testing was performed irrespective of treatment status. Patients were analyzed for pathogenic and nonpathogenic variants. Homologous recombination repair (HRR) included Ataxia Telangiectasia Mutated (ATM), Breast Cancer Gene 1 and 2 (BRCA1/2), BRCA1 Associated RING Domain 1 (BARD1), BRCA1 Interacting Protein C-Terminal Helicase 1 (BRIP1), Cyclin Dependent Kinase 12 (CDK12), Checkpoint Kinase 1 and 2 (CHEK1/2), Fanconi Anemia Complementation Group A and L (FANCA/L), Histone Deacetylase 2 (HDAC2), Partner and Localizer of BRCA2 (PALB2), RAD51 Homolog B/C/D (RAD51B/1C/51D), and RAD54 Like (RAD54 L). Tissue-agnostic therapy approvals analyzed were Deficient Mismatch Repair (dMMR), Microsatellite Instability-High (MSI-H), Tumor Mutational Burden-High >10 (TMB-H), Programmed Cell Death Protein 1 (PD-1), Programmed Death-Ligand 1 (PDL-1), BRAF V600E, Human Epidermal Growth Factor Receptor 2 (HER2), RET Proto-Oncogene (RET), and Neurotrophic Tyrosine Receptor Kinase (NTRK) respective biomarkers. Our institution provides genetic counseling to outside referrals that could not be included in demographic, pathologic, and outcomes analyses.
2.5
Data analysis
Statistical analyses were conducted to compare the characteristics and outcomes between HAs and NHs. For continuous variables, normality was first assessed, and the independent samples t-test was applied when the normality assumption was satisfied. In cases where normality was not met, the nonparametric Wilcoxon rank-sum test was employed. For categorical variables, comparisons were made using the Chi-square test or Fisher’s exact test when the expected frequencies were low. Additionally, survival analysis was performed using the Kaplan-Meier method to estimate survival functions, and the log-rank test was used to compare survival distributions between groups at various time points. Results were considered statistically significant for p-values<0.05. All analyses were conducted using Stata/SE 18.0 for windows (College Station, TX)[ ].
3
Results
A total of 111 patients with enough demographic data were included in the analysis, and 41% were HAs. No significant differences were observed between the groups ( Table 1 ).
| N (%) | Non-Hispanic, N = 66 | Hispanic-Americans, N = 45 | Total, N = 111 | P -value |
|---|---|---|---|---|
| Age at presentation, years | 65.3 (9.8) | 68.3 (10.1) | 66.5 (10.0) | 0.13 |
| Race | 0.3 | |||
| White | 59 (89.4) | 42 (93.3) | 101 (91.0) | |
| Black | 3 (4.5) | 0 (0.0) | 3 (2.7) | |
| Unknown | 2 (3.0) | 3 (6.7) | 5 (4.5) | |
| Other | 2 (3.0) | 0 (0.0) | 2 (1.8) | |
| Marital status | 0.9 | |||
| Single | 14 (21.2) | 8 (17.8) | 22 (19.8) | |
| Married | 41 (62.1) | 27 (60.0) | 68 (61.3) | |
| Divorced | 7 (10.6) | 7 (15.6) | 14 (12.6) | |
| Widowed | 4 (6.1) | 3 (6.7) | 7 (6.3) | |
| Preferred language | <0.001 | |||
| English | 65 (98.5) | 24 (53.3) | 89 (80.2) | |
| Spanish | 0 (0.0) | 21 (46.7) | 21 (18.9) | |
| Other | 1 (1.5) | 0 (0.0) | 1 (0.9) | |
| Marital status | 0.9 | |||
| Single | 14 (21.2) | 8 (17.8) | 22 (19.8) | |
| Married | 41 (62.1) | 27 (60.0) | 68 (61.3) | |
| Divorced | 7 (10.6) | 7 (15.6) | 14 (12.6) | |
| Widowed | 4 (6.1) | 3 (6.7) | 7 (6.3) | |
| Medical insurance | <0.001 | |||
| Government | 32 (48.5) | 15 (33.3) | 47 (42.3) | |
| Private | 19 (28.8) | 28 (62.2) | 47 (42.3) | |
| None | 0 (0.0) | 1 (2.2) | 1 (0.9) | |
| NA | 15 (22.7) | 1 (2.2) | 16 (14.4) | |
| Obese (BMI>30) | 25 (37.9) | 16 (35.6) | 41 (36.9) | 0.9 |
| Personal cancer history | 7 (10.6) | 3 (6.7) | 10 (9.0) | 0.5 |
| Family history of cancer, 1st degree | 31 (47.0) | 28 (62.2) | 59 (53.2) | 0.3 |
| Active smoking status | 32 (48.5) | 28 (62.2) | 60 (54.1) | 0.15 |
| Alcohol or drug use | 28 (42.4) | 23 (51.1) | 51 (45.9) | 0.4 |
| Prostatitis history | 2 (3.0) | 4 (8.9) | 6 (5.4) | 0.13 |
3.1
Pathology
At the time of diagnosis, HAs had median PSA levels of 148.5 ng/ml compared to 52.6 ng/ml in NHs ( P = 0.02). On presentation, 2% of HAs were Karnofsky ≤60 compared to 7.6% of NHs ( P = 0.396). Approximately, 36% of HA presented with T4 disease compared to 15% of NHs, 67% of HAs presented with N1 disease vs 62% of NHs, and 38% of HAs presented with visceral metastasis (M1c) compared to 14% of NHs ( Table 2 ).
| N (%) | Non-Hispanics n = 66 | Hispanic-Americans n = 45 | Total n = 111 | P -value |
|---|---|---|---|---|
| Karnofsky score | 0.4 | |||
| ≤60 | 5 (7.6) | 1 (2.2) | 6 (5.4) | |
| >60 | 46 (69.7) | 32 (71.1) | 78 (70.3) | |
| PSA levels, median (IQR) | 52.6 (9.9 – 119.0) | 148.5 (21.2 – 497.0) | 82.2 (13.4 – 296.2) | 0.024 |
| Gleason score | 0.3 | |||
| 6 | 2 (3.0) | 1 (2.2) | 3 (2.7) | |
| 7 | 9 (13.6) | 8 (17.8) | 17 (15.3) | |
| 8 | 12 (18.2) | 15 (33.3) | 27 (24.3) | |
| 9 | 24 (36.4) | 10 (22.2) | 34 (30.6) | |
| 10 | 7 (10.6) | 7 (15.6) | 14 (12.6) | |
| NA | 11 (16.7) | 4 (8.9) | 15 (13.5) | |
| Disease volume | 0.4 | |||
| Low disease volume | 21 (31.8) | 11 (24.4) | 32 (28.8) | |
| High disease volume | 34 (51.5) | 29 (64.4) | 63 (56.8) | |
| NA | 11 (16.7) | 5 (11.1) | 16 (14.4) | |
| T classification | 0.17 | |||
| 1 | 2 (3.0) | 1 (2.2) | 3 (2.7) | |
| 2 | 13 (19.7) | 7 (15.6) | 20 (18.0) | |
| 3 | 22 (33.3) | 12 (26.7) | 34 (30.6) | |
| 4 | 10 (15.2) | 16 (35.6) | 26 (23.4) | |
| NA | 19 (28.8) | 9 (20.0) | 28 (25.2) | |
| N classification | 0.4 | |||
| N0 | 13 (19.7) | 5 (11.1) | 18 (16.2) | |
| N1 | 41 (62.1) | 30 (66.7) | 71 (64.0) | |
| NA | 12 (18.2) | 10 (22.2) | 22 (19.8) | |
| M classification | 0.01 | |||
| 0 | 5 (7.6) | 1 (2.2) | 6 (5.4) | |
| 1a | 6 (9.1) | 1 (2.2) | 7 (6.3) | |
| 1b | 43 (65.2) | 26 (57.8) | 69 (62.2) | |
| 1c | 9 (13.6) | 17 (37.8) | 26 (23.4) | |
| NA | 3 (4.5) | 0 (0.0) | 3 (2.7) |
Related posts:
 Is primary retroperitoneal lymph node dissection the way forward for patients with testicular seminoma and limited retroperitoneal metastases?
 Critical care therapy and in-hospital mortality after radical nephroureterectomy for nonmetastatic upper urinary tract carcinoma
 The clinical relevance of cut-off percentage for high-grade urothelial carcinoma within low-grade urothelial carcinoma: A determining factor?
 Cumulative smoking exposure impacts oncologic outcomes of upper tract urothelial carcinoma
Multicenter study of active surveillance for small renal masses: Real world practice pattern
Cumulative smoking exposure impacts oncologic outcomes of upper tract urothelial carcinoma
Multicenter study of active surveillance for small renal masses: Real world practice pattern
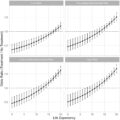 Patient preferences for life expectancy cutoffs for aggressive treatment in clinically localized prostate cancer
Stay updated, free articles. Join our Telegram channel

Full access? Get Clinical Tree


