Highlights
- •
The immune TME in NPC is unsupervisedly dissected into “Immune Inflamed” and “Immune Deficient” subtypes.
- •
Tertiary lymphoid structures (TLS) serve as better prognostic indicators than individual immune cells.
- •
TLS enhance anti-tumor immunity by increasing immune cell diversity and infiltration.
- •
The prognostic value of TLS applies across various cancer types and immunotherapy responses.
Abstract
Nasopharyngeal carcinoma (NPC), historically termed ‘lymphoepithelioma-like carcinoma’ due to its rich lymphocyte infiltration, benefit from PD-1 blockade treatment. However, a comprehensive understanding of its tumor microenvironment (TME) remains elusive, hindering the identification of effective biomarkers for immunotherapy. We leveraged multimodal profiling data, including gene expression, immunohistochemistry, and multiplex immunohistochemistry, from three independent cohorts of NPC patients with a total of 327 patients to dissect the TME in NPC. Unsupervised hierarchical clustering of TME cell populations in the discovery cohort revealed two novel subtypes with distinct prognosis: ‘Immune Inflamed’ and ‘Immune Deficient’. Intriguingly, the most significant differences between the two subtypes were the abundance of B cells and tertiary lymphoid structures (TLS), with a nearly two-fold increase in TLS presence in the Immune Inflamed subtype. The prognostic significance of TLS was confirmed in three independent NPC cohorts, surpassing the prognostic value of individual immune cell subsets. Mechanistically, TLS enhanced anti-tumor immunity by increasing T and B cell receptor repertoire diversity, promoting infiltration of plasma cells, macrophages, and natural killer cells, and consequently increasing antibody-dependent cell-mediated cytotoxicity and antibody-dependent phagocytosis. Finally, TLS status robustly predicted prognosis in a cohort of NPC patients treated with PD-1 blockade, and its prognostic value was consistent across a pan-cancer immunotherapy cohort of 10 tumors and 1158 patients, although with context-specific effects depending on cancer type and immunotherapy modality. In conclusion, this study provides compelling evidence that TLS is a robust indicator of overall immune response within TME and have great potential to guide individualized immunotherapy.
Introduction
The tumor microenvironment (TME) is a complex ecosystem of interacting immune cells that profoundly impacts cancer progression and treatment response . Nasopharyngeal carcinoma (NPC), historically termed ‘lymphoepithelioma-like carcinoma’ due to its rich lymphocyte infiltration, exemplifies this influence. While our previous studies have shown that abundant tumor-infiltrating lymphocytes were associated with favorable outcome in NPC, a comprehensive understanding of the cellular interactions and spatial organizations within the TME remain elusive .
Immune checkpoint inhibitors (ICIs) have revolutionized cancer treatment; however, their response rates in solid tumors are limited (20–30%), and their use is constrained by toxicity and cost, necessitating improved patient selection . While biomarkers like PD-L1 expression, tumor mutation burden (TMB), and microsatellite instability have been proposed, the predictive value of these biomarkers varies widely across cancers . For instance, our previous phase 3 trial demonstrated that PD-1 blockade significantly improved survival in locoregionally-advanced NPC . However, the benefit did not vary significantly according to PD-L1 status, and TMB shows limited predictive power in NPC due to the low number of genetic mutations . This underscores the critical need for novel predictive biomarkers to optimize ICI therapy in NPC as well as other cancer types.
In this study, we identified two NPC TME subtypes (‘Immune Inflamed’ and ‘Immune Deficient’) via unsupervised clustering of gene expression data. The key difference between the subtypes was the presence of tertiary lymphoid structures (TLS), which correlated with improved clinical outcomes across three independent NPC cohorts. TLS enhanced anti-tumor immunity through increased TCR/BCR diversity and infiltration of plasma cells, macrophages, and NK cells, leading to increased antibody-dependent cell-mediated cytotoxicity (ADCC) and antibody-dependent cell-mediated phagocytosis (ADCP). Furthermore, TLS served as a prognosis and responses predictor in an anti-PD-1 treated NPC cohort and across a pan-cancer immunotherapy cohort of 10 tumor types and 1158 patients. Our findings highlight the critical role of TLS in shaping the TME and support its great potential as a trustworthy biomarker for selecting patients likely to benefit from immunotherapy.
Materials and methods
Internal Cohorts
This study included 327 patients from 3 independent cohorts (discovery cohort, validation cohort and ICI cohort) treated at Sun Yat-sen University Cancer Center (SYSUCC; Guangzhou, China). The details are provided in Supplementary Table 1 . All patients had previously. untreated, histologically confirmed, non-distant metastatic NPC with complete clinical and follow-up data. The clinical and pathological characteristics of patients in the three cohorts were presented in Supplementary Table 2 . Staging was classified according to the eighth American Joint Committee on Cancer staging system. All patients received curative intensity-modulated radiation therapy. In total, the majority of patients (95.8%) presented with stage III-IV disease and all except 2 (0.6%) patients received platinum-based chemotherapy. This study was approved by the Institutional Ethical Review Board of SYSUCC, and the requirement for informed consent was waived.
Discovery Cohort
The discovery cohort comprised 150 NPC patients treated between February 2010 and January 2016. Gene expression profiles by microarray analysis (Affymetrix Human Transcriptome Array 2.0) of the primary tumor were available for all patients, and Hematoxylin-Eosin (H&E)-stained slides were available for 95 patients. All raw and processed gene expression data were deposited in the European Genome-Phenome Archive (accession code: EGAS00001004542) .
Validation Cohort
The validation cohort comprised 145 NPC patients treated between July 2010 and December 2016. All patients had formalin fixed paraffin-embedded (FFPE) primary tumors samples underwent H&E staining and immunohistochemistry (IHC) for CD8 and CD20 expression.
ICI Cohort
The ICI cohort comprised 32 NPC patients treated with PD-1 blockade in combination with chemoradiotherapy in a prospective, multicenter study (NCT03025854) between January 2019 and December 2019 . These patients received induction chemotherapy with gemcitabine and cisplatin for three cycles, followed by concurrent cisplatin chemotherapy alongside radiotherapy for two cycles. They also received 12 cycles of anti-PD-1 antibody sintilimab every three weeks, comprising three induction, three concurrent, and six adjuvant cycles to radiotherapy. H&E staining and three 6-color panel multiplex IHC (mIHC) assays were performed on FFPE primary tumor samples ( Supplementary Table 3 ).
External cohorts
External NPC cohort
The external NPC cohort consisted of 113 patients whose treatment-naive tumor samples were profiled by mRNA sequencing, which has previously been reported (GSE102349) .
External immunotherapy Cohort
The external immunotherapy cohort consisted of 10 cancer types and 1158 patients receiving various types of immunotherapies, encompassing 22 immunotherapy cohorts with bulk RNA sequencing data. All datasets were retrieved from TIGER (Tumor Immunotherapy Gene Expression Resource) ( https://tiger.canceromics.org/ ) .
Bulk RNA based immune landscape analysis
Immune cell abundance was quantified using MCPcounter algorithm for lymphoid, myeloid, and fibroblast cell populations in the discovery cohort . Subsequently, unsupervised hierarchical clustering was then performed on the resulting data matrix. Specifically, Ward’s minimum variance method was used for the hierarchical clustering algorithm, with Euclidean distance as the distance metric .
The R software ‘limma’ (v3.52.4) package was used to identify DEGs between groups from normalized mRNA data for the Discovery cohort and the External NPC Cohort. Gene set enrichment analysis (GSEA) was performed with BioCarta gene sets . Single-sample gene set enrichment analysis (ssGSEA) algorithm based on the gene lists of TISIDB immune cells marker was used to estimate the abundances of hematopoietic subsets . Immune-related gene lists were obtained from the ImmPort shared data (updated July 2020) to identify differentially expressed genes (DEGs) . This analysis also included gene sets for pan-immunoglobulin (pan-IG) , plasma B cells, antibody-dependent cell-mediated cytotoxicity (ADCC) , antibody-dependent cell-mediated phagocytosis (ADCP) , and apoptosis . The full gene lists for all gene sets are provided in Supplementary Table 4 .
H&E staining
Hematoxylin and eosin (H&E) staining was performed on tumor specimens to assess tissue morphology and architecture.
IHC staining
Immunohistochemistry (IHC) was performed to identify and quantify CD20 + B cells and CD8 + T cells within the tumor microenvironment. An anti-CD20 antibody (HPA014341, 1:3000; Sigma Aldrich, Merck) was used as the primary antibody to detect the distribution and density of CD8 + T cells and CD20 + B cells. A ZEISS Axio Scan.Z1 microscope at ×200 magnification was used to digitally scan entire IHC slides. Images were analyzed using HALO image software (Indica Labs, USA) with its multiplex IHC features ( Supplementary methods ).
TLS score calculation by bulk RNA sequencing data
TLS hallmark genes ( CCL19 , CCL11 , CXCL13 , CCR7 , CXCR5 , SELL, and LAMP3 ) were also used to evaluate TLS score, which was calculated by using the ‘GSVA’ (v1.38.2) .
TLS assessment and concordance
The presence of TLS, was defined as lymphoid aggregates (≥ 100 lymphocytes) with a germinal center . Staining slides were independently evaluated by two pathologists with 5 and 7 years of experience in NPC, respectively. They were blinded to clinical information and patient outcomes. Their concordance in determining the presence of TLS was 87.6%, 85.1%, and 86.8% in the discovery cohort, validation cohort, and ICI cohort, respectively. Any disagreements were resolved by consensus.
Multiplex immunohistochemistry (mIHC) assay
Briefly, primary antibody staining conditions were optimized by standard uniplex immunohistochemistry and uniplex immunofluorescence staining, followed by assessment using a six-color mIHC assay to determine the staining order. mIHC staining was performed using the PANO 6-plex IHC kit (Panovue, Beijing, China; cat 10234100100). Formalin-fixed paraffin-embedded tissues were cut into 4 μm thick sections and placed on positive charged slides, heated at 60°C for 1h, followed by deparaffinization and rehydration. Heat-induced antigen retrieval was performed in ethylenediaminetetraacetic acid (EDTA) buffer, pH 9.0 (or citrate buffer, pH 6.0, for Ki67 staining) using a microwave oven. The sections were blocked with blocking buffer (Beyotime, Shanghai, China; cat. P0102) for 30 min. The slides were serially incubated with primary antibodies and horseradish peroxidase-conjugated secondary antibodies and subjected to tyramide signal amplification (TSA). The slides were microwave heat-treated for antigen retrieval and antibody stripping after each round of TSA operation. Nuclei were stained using 4′,6-diamidino-2-phenylindole (DAPI) after all sequential staining steps had been completed. Slides were then sealed using the Antifade Mounting Medium (Beyotime; cat. P0126). A detailed list of the antibodies used in this panel can be found in Supplementary Table 3 .
TCR/BCR repertoire analysis
TCR and BCR repertoire analysis was performed on bulk RNA-seq data from the external NPC cohort. The complementarity-determining region 3 (CDR3) repertoire was analyzed using RNA sequencing data. The TRUST4 (v1.0.5.1) software was employed to detect the CDR3 repertoire of both BCR and TCR. Using the immunarch (v0.6.7) R package, BCR and TCR clonotype counts per sample were normalized by sequencing depth. Repertoire diversity was subsequently analyzed using the package ‘repDiversity’ function, employing the Chao1 method (a non-parametric estimator of species richness) and the ‘homeo’ method (to assess clonal space homeostasis, i.e., the proportion of the repertoire occupied by clones of a given size).
Statistical analysis
Continuous variables were compared using t-tests, while categorical variables were compared using χ 2 tests or Fisher’s exact tests as appropriate. Receiver operating characteristic (ROC) curve analysis was used to determine optimal cutoff values for gene expression, stratifying patients into high and low expression groups. Survival analyses were conducted using Kaplan-Meier methods, with differences between groups assessed using the log-rank test. A Cox proportional hazards model, incorporating backward selection for multivariate analysis, was used to identify independent prognostic factors, yielding hazard ratios (HRs) and 95% confidence intervals (CIs) . All statistical tests were two-sided and performed using SPSS version 22.0 (IBM Corp., Armonk, NY, USA) and R software version 4.0.3 (R Foundation for Statistical Computing, Vienna, Austria).
Results
Unsupervised clustering reveals novel immune subtypes in NPC with distinct prognosis
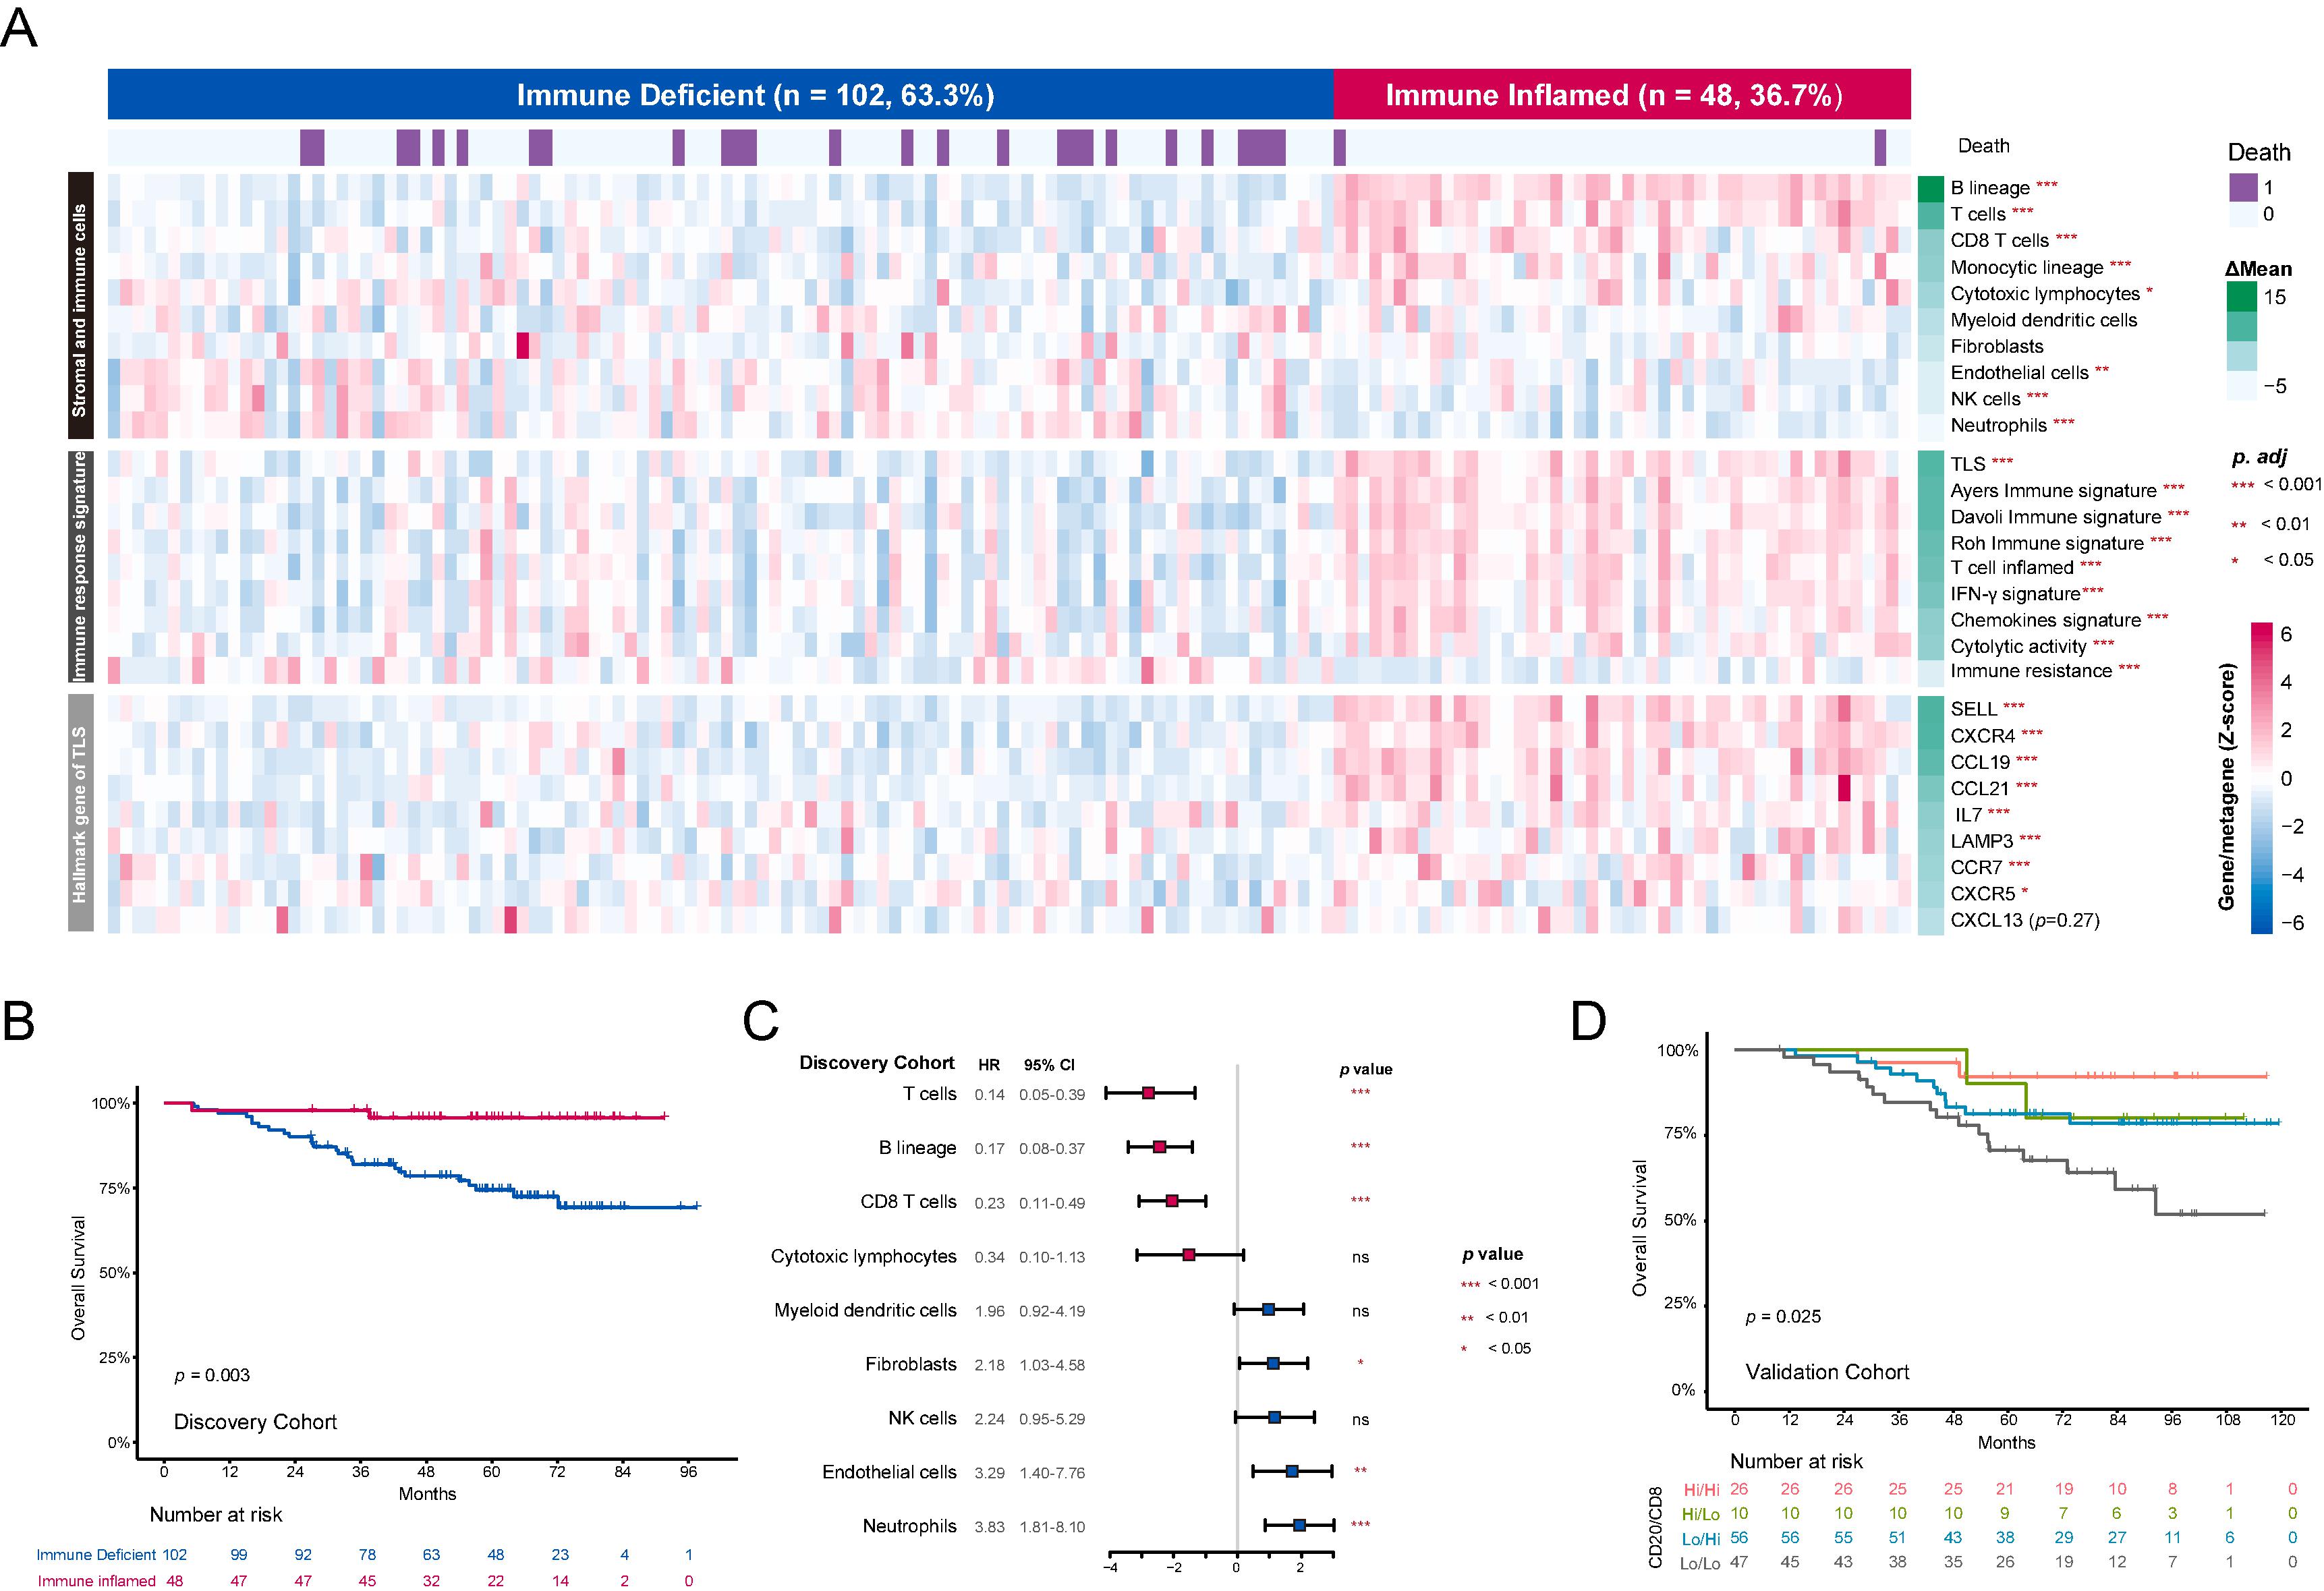
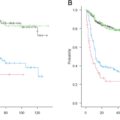
We investigated the TME in NPC using gene expression data from the Discovery Cohort (150 patients). To characterize the immune landscape, we used MCP counter algorithm to quantify the abundance of multiple immune cells, including lymphoid cells, myeloid cells, and fibroblasts. Based on these immune infiltrates, unsupervised clustering revealed two distinct subtypes ( Fig. 1 A and sFig. 1A ) . The ‘Immune Inflamed’ subtype had significantly better overall survival (OS) compared to the ‘Immune Deficient’ subtype ( p = 0.003) ( Fig. 1 B) .
Related posts:
 Surgical complications and functional outcomes of 3191 jejunal free flaps used for reconstruction of circumferential defects following head and neck cancer resections: A systematic review
 Submandibular gland transfer into the temporal fossa in patients with oral squamous cell carcinoma: A viable option to prevent radiation-induced xerostomia
 Induction chemotherapy for locally advanced nasopharyngeal carcinoma: Efficacy and safety of the TPC regimen compared to GP and TPF
 Predictors of recurrence and survival after salivary gland cancer surgery: A multicenter, retrospective study in northern Japan
 The 10 %-rule debate: A fresh perspective on sentinel lymph node biopsy in OSCC
 Deciphering molecular relapse and intra-tumor heterogeneity in non-metastatic resectable head and neck squamous cell carcinoma using circulating tumor DNA
Stay updated, free articles. Join our Telegram channel

Full access? Get Clinical Tree


