Highlights
- •
Blood and urine heavy metals were increased in patients with RCC compared to healthy controls.
- •
Serum oxidation markers revealed reduced antioxidation and increased pro-oxidant enzyme levels in patients with RCC compared to healthy controls.
- •
The tumor tissue had lower levels of heavy metals compared to adjacent normal kidney parenchyma.
- •
Gene expression of VHL and antioxidation enzymes were significantly reduced in the tumor tissue compared to adjacent normal tissue.
Abstract
Introduction
Heavy metals exposure is a known carcinogen in humans. The impact of heavy metals in the pathogenesis of renal cell carcinoma (RCC) is unclear with scant available literature. Though previous studies have evaluated the role of heavy metals in RCC, majority of those studies have evaluated either single or few heavy metals in urine. None of the prior studies have evaluated an extensive panel of heavy metals in blood, urine, and tissue in the same patient along with the serum oxidation status and gene expression to establish a cause-and-effect relationship. This study aims to evaluate the role of extensive panel of heavy metals, oxidative status, and gene expression in RCC.
Methodology
This observational study recruited RCC patients who visited our tertiary care centre from 2019 to 2023. Age matched healthy volunteers were included as controls. Blood, urine, and tissue samples (tumor and adjacent normal tissue) were collected from RCC patients. Levels of arsenic, copper, manganese, selenium, cadmium, lead, and mercury were measured in each of the samples. Serum oxidative stress markers like glutathione peroxidase (GPX), lipid peroxidase (LPO), and superoxide dismutase (SOD) were measured. Genetic expression of Von Hippel-Lindau ( VHL ), catalase ( CAT ), superoxide dismutase ( SOD1 ), and glutathione peroxidase ( GPX1 ) genes were measured in the tumor tissue and adjacent normal parenchyma.
Results
150 cases and 150 age matched controls were enrolled. RCC cases had elevated blood levels of arsenic ( P = 0.02), copper ( P = 0.01), manganese ( P < 0.001), cadmium ( P < 0.001), lead ( P < 0.001), and mercury ( P = 0.02) compared to controls. Urine levels of selenium ( P = 0.02), mercury ( P = 0.03), and lead ( P = 0.04) were higher in cases. Reduced levels of serum GPx ( P = 0.02) and higher levels of LPO ( P = 0.04) were detected in cases. Elevated levels of copper ( P = 0.03), manganese ( P = 0.002), selenium ( P < 0.001), and cadmium ( P < 0.001) were found in the adjacent normal parenchyma compared to the tumor tissue. VHL ( P = 0.03) and oxidative stress gene expressions were lower in the tumour tissue compared to the normal parenchyma.
Conclusion
Elevated levels of heavy metals in the blood, urine, tissue, and imbalance in the serum oxidative status along with downregulated tumor suppressor VHL and oxidative stress genes in the tumor tissues likely explain the carcinogenic role of heavy metals in RCC. Environmental exposure is the main cause of heavy metal toxicity. Mitigating the environmental exposure of heavy metals and thereby their toxicity might play a role in cancer prevention.
1
Introduction
Environmental exposure to heavy metals is a known carcinogen in humans. At low concentrations, some of these heavy metals known as trace elements are required for human physiology. Heavy metals are toxic even in low concentrations whereas trace elements are toxic at higher concentrations. Various malignancies including urologic cancers are associated with exposure to heavy metals [ , ]. The kidney plays a vital role in the reabsorption and concentration of metals and divalent ions, thus making it a vulnerable target for heavy metal toxicity [ ]. Song et al. [ ] in their meta-analysis of observational studies demonstrated that a higher occupational exposure of cadmium (Cd) maybe a risk factor for RCC. Boffetta et al. [ ] studied the occupational exposure of heavy metals and found that exposure to lead (Pb) increased the risk of RCC. However, these studies were observational and did not involve measurement of heavy metal levels. Some studies have evaluated the concentration of heavy metals in RCC tumour tissue and normal renal tissue. Sa et al. [ ] detected elevated levels of Cd, chromium (Cr) and manganese (Mn) in RCC tissue without any heavy metal accumulation in the adjacent normal renal parenchyma. A similar finding of higher heavy metal concentration in RCC tissue was reported by Abdel et al. [ ]. In contradiction to these studies, Cerulli et al. [ ] and Karcioglu et al. [ ] reported lower levels of Cd and Pb in RCC tissue and elevated levels of the same in the adjacent normal renal tissue. The literature regarding heavy metals in the serum and urine among patients with RCC is sparse. In our previous study, we have demonstrated significantly altered levels of heavy metals in the serum and urine of patients with RCC [ ]. A comprehensive assessment of all carcinogenic heavy metals in the blood, urine and in tumor tissue of patients with RCC is still lacking in literature.
Heavy metal induced toxicity is attributed to reactive oxygen species (ROS) generation and a disruption in tissue homeostasis by weakening antioxidant defense and increasing oxidative stress [ ]. There are several mechanisms of heavy metal induced carcinogenesis described in the literature. Heavy metals bind to regulatory molecules which are responsible for DNA synthesis, repair, and cell cycle regulation. Cd and arsenic (As) can bind with nuclear factor kappa B (NF-kB) and p53 rendering them inactive. This results in uncontrolled cellular proliferation [ ]. Ras mutations caused by Cd and As can continually activate signaling pathways leading to cell proliferation and tumor formation [ ]. Over expression of Bcl-2 and disruption of the JNK pathway by Cd can result in cellular resistance to apoptosis [ ]. Hexavalent Cr causes DNA damage by inactivating DNA polymerase, DNA ligase and PARP-1. This inactivation causes chromosomal instability and eventually oncogenesis. Metals like mercury (Hg), Pb, Cr, Cd and As can induce epigenetic alterations like DNA methylation and histone modification via ROS production. This increases protooncogene expression while mitigating tumor suppressor genes and can lead to cancer. [ ] However, the specific mechanism of heavy metal induced carcinogenesis in patients with RCC is yet to be clearly elucidated. Hence, we aimed to study the concentration of these heavy metals in serum, urine, and tumor tissue in patients with RCC. Further, we aimed to study the oxidative stress levels in blood along with tumor suppressor Von Hippel-Lindau ( VHL ) and antioxidant gene expression in tissue to establish a causal relationship.
2
Methodology
2.1
Study design
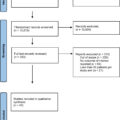
This was a prospective observational case-controlled study conducted between August 2019 and January 2023 at a tertiary care academic institution after obtaining approval from the institute ethics committee (IEC- 321/03.05.2019). Study population included patients with a diagnosis of RCC based on imaging and postoperative histopathology (HPE). Age and sex matched healthy individuals who hailed from the same geographical location were included as controls via a structured questionnaire. The control group included relatives of patients when available who preferably lived in the same household and did not have any occupational exposure to heavy metals. This ensured similar environmental exposure of heavy metals in cases and controls. Patients with chronic kidney or liver disease were excluded. The study was approved by the IEC and written informed consent was taken from all the participants. This research was funded by Indian Council of Medical Research (ICMR), Government of India.
2.2
Outcomes
The primary outcome was to compare the concentration of heavy metals such as As, copper (Cu), Mn, Selenium (Se), Cd, Pb, and Hg in the blood, urine, and tissue. These 7 heavy metals were chosen as they were shown in previous studies, individually, to have a possible association with RCC [ ]. As, Cd, Pb and Hg are class I carcinogens which have been implicated in RCC [ ]. Cu, Mn and Se are micronutrients which are required in small quantities for physiological functions but can be deleterious in high concentrations [ ]. Secondary outcomes were comparison of serum levels of glutathione peroxidase (GPX), lipid peroxidase (LPO) and superoxide dismutase (SOD) between 2 groups; comparison of heavy metal concentration between tumor tissue and adjacent normal parenchyma; and comparison of the genetic expression of VHL , glutathione peroxidase ( GPX1 ), catalase ( CAT) and superoxide dismutase ( SOD1 ) gens in the tumor tissue with that of the adjacent normal renal parenchyma.
2.3
Sample collection and analysis
Peripheral blood samples (10ml) collected in an ultra-pure (Ethylenediaminetetraacetic acid) EDTA coated tubes were evaluated for heavy metal concentration by inductively coupled plasma mass-spectroscopy (ICP-MS). Urine samples (10ml) collected in a sterile metal-free plastic container were evaluated for the concentration of heavy metals by ICP-MS. Samples were collected in the early morning after an overnight fast. Oxidative stress markers and antioxidant levels were measured by commercially available colorimetric ELISA kits (Elabscience, USA). The samples were subjected to acid digestion which digests chelation complexes, proteins, and cellular components. These samples were then subjected to ICP-MS to measure heavy metal concentration where extreme temperatures ensured all components existed in their atomic form.
Tumour tissue and surrounding normal parenchyma were collected from operative specimens after a radical nephrectomy in a sterile, metal-free plastic container with RNAlater storage solution (Thermo Fischer Scientific, USA). The tissues were stored at -80°C till further evaluation of heavy metals by ICP-MS and gene expression of VHL, GPX1 , catalase and SOD1 genes by qPCR (Quantitative polymerase chain reaction) and RT-PCR (Reverse transcriptase polymerase chain reaction). In patients who underwent partial nephrectomy, tissue analysis was not feasible as there was not enough available normal renal parenchyma in the specimen. Tissue analysis of heavy metals by ICP-MS involved in drying of ∼50mg of tissue at 60°C followed by digestion in 70% nitric acid and hydrogen peroxide. The resulting solution was incubated a microwave digestion system (Anton paar Multiwave ECO, Austria). The digested tissue solution was used to measure heavy metal concentration with ICP-MS. Clinico-pathological data were collected from the study population including demographics and biopsy reports.
2.4
RNA extraction and complementary DNA library preparation protocol
For RT-PCR analysis, the tissue samples were minced and homogenized in lysis buffer (Qiagen, USA). Total RNA was extracted using TRIZOL-l reagent (Invitrogen, USA) according to the manufacturer’s protocol. The concentration and purity of total RNA was determined by measuring the absorption using NanoDrop-2000 (Thermo Fisher, USA) at 260 and 280 nm. First-strand cDNA was prepared from total RNA using Agilent reverse transcription system (Agilent Technologies, USA) based on the manufacturer’s instructions. The cDNA thus obtained was used immediately or stored at −80°Csss until use [ ]. The reaction mixture for cDNA library was prepared by mixing 4µL of iscript 5x reaction mix (Bio-Rad, USA) with 1µL of reverse transcriptase enzyme and 4-5µL of RNA in a PCR tube. The total volume was made up to 20µL using nuclease free water. The reaction mixture was incubated in a thermal cycler by priming for 5 minutes, reverse transcription for 20 minutes and RT inactivation for 1 minute. Two microliters of cDNA were used for qPCR.
2.5
Primer designing
Primers were designed for VHL , oxidative stress genes ( CAT, SOD1, GPX1) and 1 house-keeping gene ( GAPDH ) using NCBI NIH Primer Blast tool ( Supplementary Table S1 ). The specificity of primer was determined by agarose gel electrophoresis run. Each primer was standardized for its melting temperature and quantitative amplification.
2.6
qPCR protocol
To interpret the upregulation and downregulation levels of all mRNA Quantitative analysis of the genes VHL, CAT, SOD1 and GPX1 was performed in a CFX96 real-time system (Bio-Rad, USA) using Brilliant III Ultra-Fast SYBR® Green QPCR Master Mix (Agilent, USA). The cDNA were amplified in a 20μL reaction volume containing the specific primers ( Supplementary Table S1 ) [ ]. The mRNA expression levels of all genes were expressed as a ratio relative to GAPDH present in each sample. The level of expression of genes was normalized to that of the GAPDH gene expression (housekeeping gene) and was determined by the 2-ΔΔCt method [ ].
2.7
Quality control
For biochemical assays, each sample was analysed twice. In each run of analysis samples were analysed 3 times by default using MassHunter4 software and each analysis include 50 reading (50 × 3 = 150 readings in single run). For the accuracy and quality control of the analysis the calibration was done from blank (zero) to 1,000 high concentration standards (1,000 ppb) and linearity of calibration graph having R = 0.98 and above was accepted. For the reproducibility and accuracy of the analytical run, an internal standard having different mass range elements was parallelly run in the same matrix (which is used for sample digestion) to maintain the stability of the analytical run. For quality assurance, blood and urine standards with known concentration of elements was analysed after every 10 test samples. Genetic analyses involved qPCR and RT-PCR, where each assay was validated by assessing the efficiency and specificity of the primers through melting curve analysis and agarose gel electrophoresis. For gene expression studies, we used house-keeping genes as internal controls to normalize the data and compensate for any potential variations in sample quality or experimental conditions. Each batch of experiments included negative controls, and all assays were performed in triplicate to verify reproducibility.
2.8
Statistical analysis
Mean ± standard deviation (SD) was used to express continuous variables which were compared using Student’s t-test. Categorical variables expressed as frequency (percentage) were compared using Chi-square or Fischer’s Exact test. Statistical analysis was done with Stata, v.14.0 (StataCorp, USA). The confounding factors like age and gender were adjusted with frequency matching. A P -value of < 0.05 was considered statistically significant.
3
Results
A total of 150 RCC cases and 150 age matched controls were included for analysis. 37% of cases had a cT3 tumor followed by cT1 (32%). Ten percent of patients had cT4 tumors. The most common HPE subtype was clear cell (68.7%) followed by papillary (6.7) and chromophobe RCC (4%). HPE diagnosis of oncocytoma was seen in 8.6% of patients. Other HPE subtypes were found in 4.6% of patients. 11 patients (7.3%) did not have available HPE data at the time of analysis ( Table 1 ).
| Variable | RCC cases ( n = 150) | Controls ( n = 150) | P value |
|---|---|---|---|
| Age, mean ± SD | 50.51 ± 12.66 | 47.44 ± 14.63 | 0.06 |
| Gender, n (%) | |||
| Male | 107 (71.33) | 114 (76) | 0.43 |
| Female | 43 (28.6) | 36 (24) | |
| Clinical T stage, n (%) | |||
| T1 | 47 (32) | ||
| T2 | 32 (21) | ||
| T3 | 56 (37) | ||
| T4 | 15 (10) | ||
| Histopathology, n (%) | |||
| Clear cell | 103 (68.7) | ||
| Papillary | 10 (6.7) | ||
| Chromophobe | 6 (4) | ||
| Oncocytoma | 13 (8.6) | ||
| Others | 7 (4.6) | ||
| No follow up | 11(7.3) |
3.1
Heavy metals in blood
Patients with RCC had significantly elevated mean levels of As, Cu, Mn, Cd, Pb and Hg in blood compared to the control group ( Table 2 ). 60% (92) of cases had elevated Pb in the blood which was the most common heavy metal to have high concentrations. Likewise, 23.7% (36), 25.7% (39), 54.12% (82), 10.56% (16) and 1.32% (2) of patients had concentrations above the permitted levels for Cd, Cu, Mn, Hg and As respectively. Patients with RCC had significantly lower levels of Se compared to the control group ( Fig. 1 A). On subgroup analysis of cases, there was no significant difference in blood heavy metals with respect to age, gender, smoking habit, diet, T stage of the tumor, and histopathological type of RCC ( Supplementary Table S2 ).
Related posts:
 A systematic review of family history, race/ethnicity, and genetic risk on prostate cancer detection and outcomes: Considerations in PSA-based screening
 Neoadjuvant chemotherapy before radical cystectomy in patients with organ-confined and non-organ-confined urothelial carcinoma
 Comparison of outcomes between single-port and multiport retroperitoneal robotic partial nephrectomy
 The learning curve for transperineal MRI/TRUS fusion prostate biopsy: A prospective evaluation of a stepwise approach
 Testosterone recovery after androgen deprivation therapy
 Testicular cancer malpractice trends
Stay updated, free articles. Join our Telegram channel

Full access? Get Clinical Tree


