Highlights
- •
Patients with Lymph node positive disease after radical cystectomy with extended lymphadenectomy fare worse than patients with lymph node negative disease.
- •
Patients with pN1 disease didn’t differ in long-term survival outcomes from patients with pN2-3 disease. Patients with both node positive disease and locally advanced disease (≥pT3) had the worst survival outcomes.
- •
Precystectomy and postcystectomy (minimal residual disease window) undetectable ctDNA status were informative of recurrence-free survival regardless of nodal status.
- •
Patients with undetectable ctDNA status and positive lymph node disease may benefit from treatment de-escalation. Detectable precystectomy ctDNA status may be used for selecting patients to extended lymph node dissection templates.
Abstract
Background and objective
Neoadjuvant therapy followed by radical cystectomy with lymphadenectomy remains the gold standard of treatment in patients with muscle-invasive bladder cancer. Pathologically positive lymph node (pN+) disease is known to convey a poor prognosis. Tumor-informed circulating tumor DNA (ctDNA) has emerged as a possible novel prognostic biomarker in the field. We seek to assess recurrence-free survival (RFS) for patients undergoing robotic-assisted radical cystectomy (RARC) with extended pelvic lymphadenectomy (ePLND) and to assess whether ctDNA status can be a prognostic marker for RFS outcomes in patients with pN+ disease.
Methods
Patients who underwent RARC + ePLND during 2015 to 2023 were included. A sub-group analysis ( n = 109) of patients who had prospectively collected serial-longitudinal tumor-informed ctDNA analyses during 2021-2023 was performed. Survival analysis and Cox-regression models were conducted.
Results
Included were 458 patients with a median age of 69 (IQR 63–76), and a median follow-up time of 20 months (IQR 10-37). RFS for pN0 ( n = 353) and pN+ ( n = 105) at 12, 24 and 36 months were 87% vs. 54%, 80% vs. 39%, and 74% vs. 35%, respectively (log-rank, P < 0.0001). On Cox multivariate analysis ≥pT3 disease (Hazzard ratio [HR] = 3.36 [2.18–5.18], P < 0.001), pN+ disease (HR = 2.39 [1.55–3.7], P < 0.001), and recipients of neoadjuvant treatment (HR = 1.61 [1.11–2.34], P = 0.013) were predictive of disease relapse. Patients with pN+ disease and undetectable precystectomy or postcystectomy ctDNA status had similar RFS to patients with pN0 with undetectable ctDNA. On Cox-regression multivariate sub-group analysis, detectable precystectomy ctDNA status (HR = 3.89 [1.32–11.4], P = 0.014), detectable ctDNA status in the minimal residual disease window ([MRD], HR = 2.89 [1.12–7.47], P = 0.028), and having ≥pT3 with pN+ disease (HR = 4.2 [1.43–12.3], P = 0.009) were predictive of disease relapse.
Conclusions
Patients with pN+ .after RARC had worse oncological outcomes than patients with pN0 disease. Undetectable ctDNA status was informative of RFS regardless of nodal status at both the precystectomy and the MRD window. Patients with undetectable ctDNA status and pN+ disease may benefit from treatment de-escalation.
1
Introduction
Positive lymph node disease (pN+) following radical cystectomy with lymphadenectomy remains a poor prognostic factor for disease recurrence [ ]. Approximately one third of patients with pN+ disease will be cured after radical cystectomy with lymphadenectomy [ ].
Two prospective trials examined the role of extending pelvic lymph node dissection (ePLND) during radical cystectomy to improve disease outcomes, the LEA AUO AB 25/02 trial compared super-extended to a limited template [ ] and the SWOG S1011 [ ] compared super-extended to a standard template. Both trials failed to prove that extending lymph node dissection templates improves cancer-specific survival (CSS) or overall survival (OS). Arguably, both may have been powered to detect too large of a difference between the intervention arms, a difference that in reality may be smaller for such intervention. Thus, identification of novel biomarkers that may improve patient selection for ePLND is crucial.
Circulating tumor DNA (ctDNA) has been introduced as a possible novel biomarker in nonmetastatic bladder cancer [ ]. Recent ultrasensitive tumor-informed ctDNA assays can detect ctDNA in a patient’s plasma with high sensitivity. In our previous publication, we demonstrated the predictive abilities of such tumor-informed assay, where detectable precystectomy ctDNA status was predictive on pN+ disease and locally advanced disease on final pathology, and it was also prognostic of disease relapse [ ]. Yet, whether ctDNA status can inform on treatment escalation e.g., selecting patients to extended lymphadenectomy templates or deciding upon treatment de-escalation, notably, sparing patients from adjuvant treatment while having pN+ disease remains to be determined.
In the current study, we aim to perform a contemporary analysis of consecutive patients who underwent robotic-assisted radical cystectomy (RARC) with extended lymph node dissection (ePLND) and to perform a sub-group analysis among patients who had tumor-informed ctDNA analyses prospectively collected to assess predictors for disease relapse according to ctDNA and nodal status (pN0/pN+).
2
Materials and methods
2.1
Study design and population
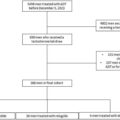
A prospectively maintained database of consecutive patients who underwent RARC with ePLND between 2015 and 2023 in a single center was analyzed ( n = 583). Patients who underwent RARC with concomitant nephroureterectomy ( n = 16), patients who had no lymph node dissection performed ( n = 14), and patients with less than 3 months of follow-up ( n = 95) were excluded. Briefly, the surgical boundaries for lymphadenectomy during radical cystectomy were: carinal-aortic bifurcation; lateral-pelvic side wall and the genitofemoral nerve; medial-rectosigmoid mesentery; inferior-the lacunar ligament and the lymph node of Cloquet; posterior-the obturator fossa. Additionally, precaval and presacral lymph nodes are removed. In a subset of patients super-extended lymph node dissection up to the level of the inferior mesenteric artery was performed.
A subset of patients ( n = 109) had Signatera TM (Natera Inc.) ctDNA assays prospectively collected between 2021 and 2023. As a standard, patients undergoing radical cystectomy at our institution were recommended to have a Signatera TM drawn before surgery with real-time analysis. Baseline characteristics, pathological results, clinical imaging results, and oncological treatments were collected. All patients were operated on clinically M0 disease (according to CT or MRI-urography and chest CT). Patients who underwent neobladder diversion had to have an intraoperative negative urethral frozen margin. Postoperative surveillance was performed per current guidelines [ ] and consisted of cross-sectional imaging every 3-6 months in the first 2 years according to pathologic stage and grade. Serial ctDNA samples were collected every 6 to 12 weeks.
2.2
ctDNA extraction and analysis
Baseline preoperative ctDNA status was established using TURBT specimens, blood was drawn within 1 month or on the day of surgery to detect ctDNA. In patients receiving neoadjuvant treatment, blood for detection of ctDNA was drawn prior to initiation and after the completion of neoadjuvant therapy. Subsequent ctDNA samples were drawn longitudinally postoperatively, during the initial 90 days—the minimal residual disease (MRD) window, and after the initial 90 days during the surveillance window. The patient’s precystectomy TURBT sample was used to assess the ctDNA panel for the precystectomy status and was used throughout the patient’s surveillance.
2.3
Statistical analysis
Study findings were reported using descriptive statistics. Categorical variables were reported as frequency and percentage and continuous variables were reported as the median and interquartile range (IQR). The Fisher exact and the chi-squared tests were used to compare categorical values, the Mann-Whitney test was used to compare medians of 2 groups. Univariable and multivariable Cox proportional-hazards model using clinical and pathological variables were used to find predictors of disease relapse, a sub-group analysis incorporating ctDNA status at the precystectomy and postcystectomy setting was conducted separately ( Tables 3–5 ).
Survival analysis using the Kaplan-Meier method and the log-rank test was used to estimate RFS as the outcome according to lymph node status, ≥pT3 disease, precystectomy (detectable/undetectable) status, and MRD window ctDNA (detectable/undetectable) status. Pairwise comparisons were performed and corrected using the Benjamini-Hochberg (BH) method. Patients lost to follow-up were censored at the time of their last follow-up visit. All tests were 2-sided. A P -value of <0.05 was considered statistically significant. R programming language version 4.3.1 version was used for all statistical analyses.
3
Results
3.1
Baseline characteristics
A total of 458 patients were included ( Table 1 ), 358 patients were males (78.2%) and 100 were females (21.8%). The median age was 69 years (IQR 63–76), and the median follow-up time was 20 months (IQR 10–37). Overall, 267 Patients underwent radical cystectomy due to MIBC (58.3%), of the patients with pathologically proven MIBC or suspected MIBC, 114 received neoadjuvant therapy (42.6%). Variant histology on final pathology was found in 144 patients (31.4%). pN+ was found in 105 patients (22.9%), of them 37 (8.1%) had pN1 and 68 (14.8%) had pN2-pN3 disease, the median number of lymph nodes resected was 23 (IQR 15–31). Of the 181 patients who had an indication for adjuvant treatment (≥pT3 and/or pN+), 85 patients (47%) received adjuvant treatment. Metastatic recurrence occurred in 140 patients (30.6%), and 34 patients had concomitant local recurrence (7.4%), 2 patients had solitary urethral recurrence and underwent urethrectomy. The median time to progression was 6 months (IQR 3–13), and 119 patients (26%) died during the follow-up period, of them 63 had documented death due to metastatic bladder cancer (13.8%).
3.2
Survival analysis of stratified according to lymph node status and pT stage
Kaplan-Meier analysis demonstrated that patients with pN+ had worse RFS with a median RFS of 13.6 months in the pN+ patients vs. not reached (NR) in the pN0 disease at 3 years (log-rank, P < 0.0001, Fig. 1 ). RFS for pN+ and pN0 at 1, 2 and 3 years was 54% vs. 87%, 39% vs. 80%, and 35% vs. 74%, respectively. When stratifying pN+ disease to pN0, pN1, or pN2-3, no RFS difference was found among pN1 vs. pN2-3 (BH, P = 0.085). The median number of lymph nodes resected were comparable between the pN1 disease (25 nodes [IQR 17–31]) and the pN2-3+ group (24 nodes [IQR 15–31], P = 0.93). Yet, the median RFS time was almost double, 17.2 months for the pN1+ disease vs. 9.4 months for the pN2-3+ disease ( Supplementary Fig. 1 ).
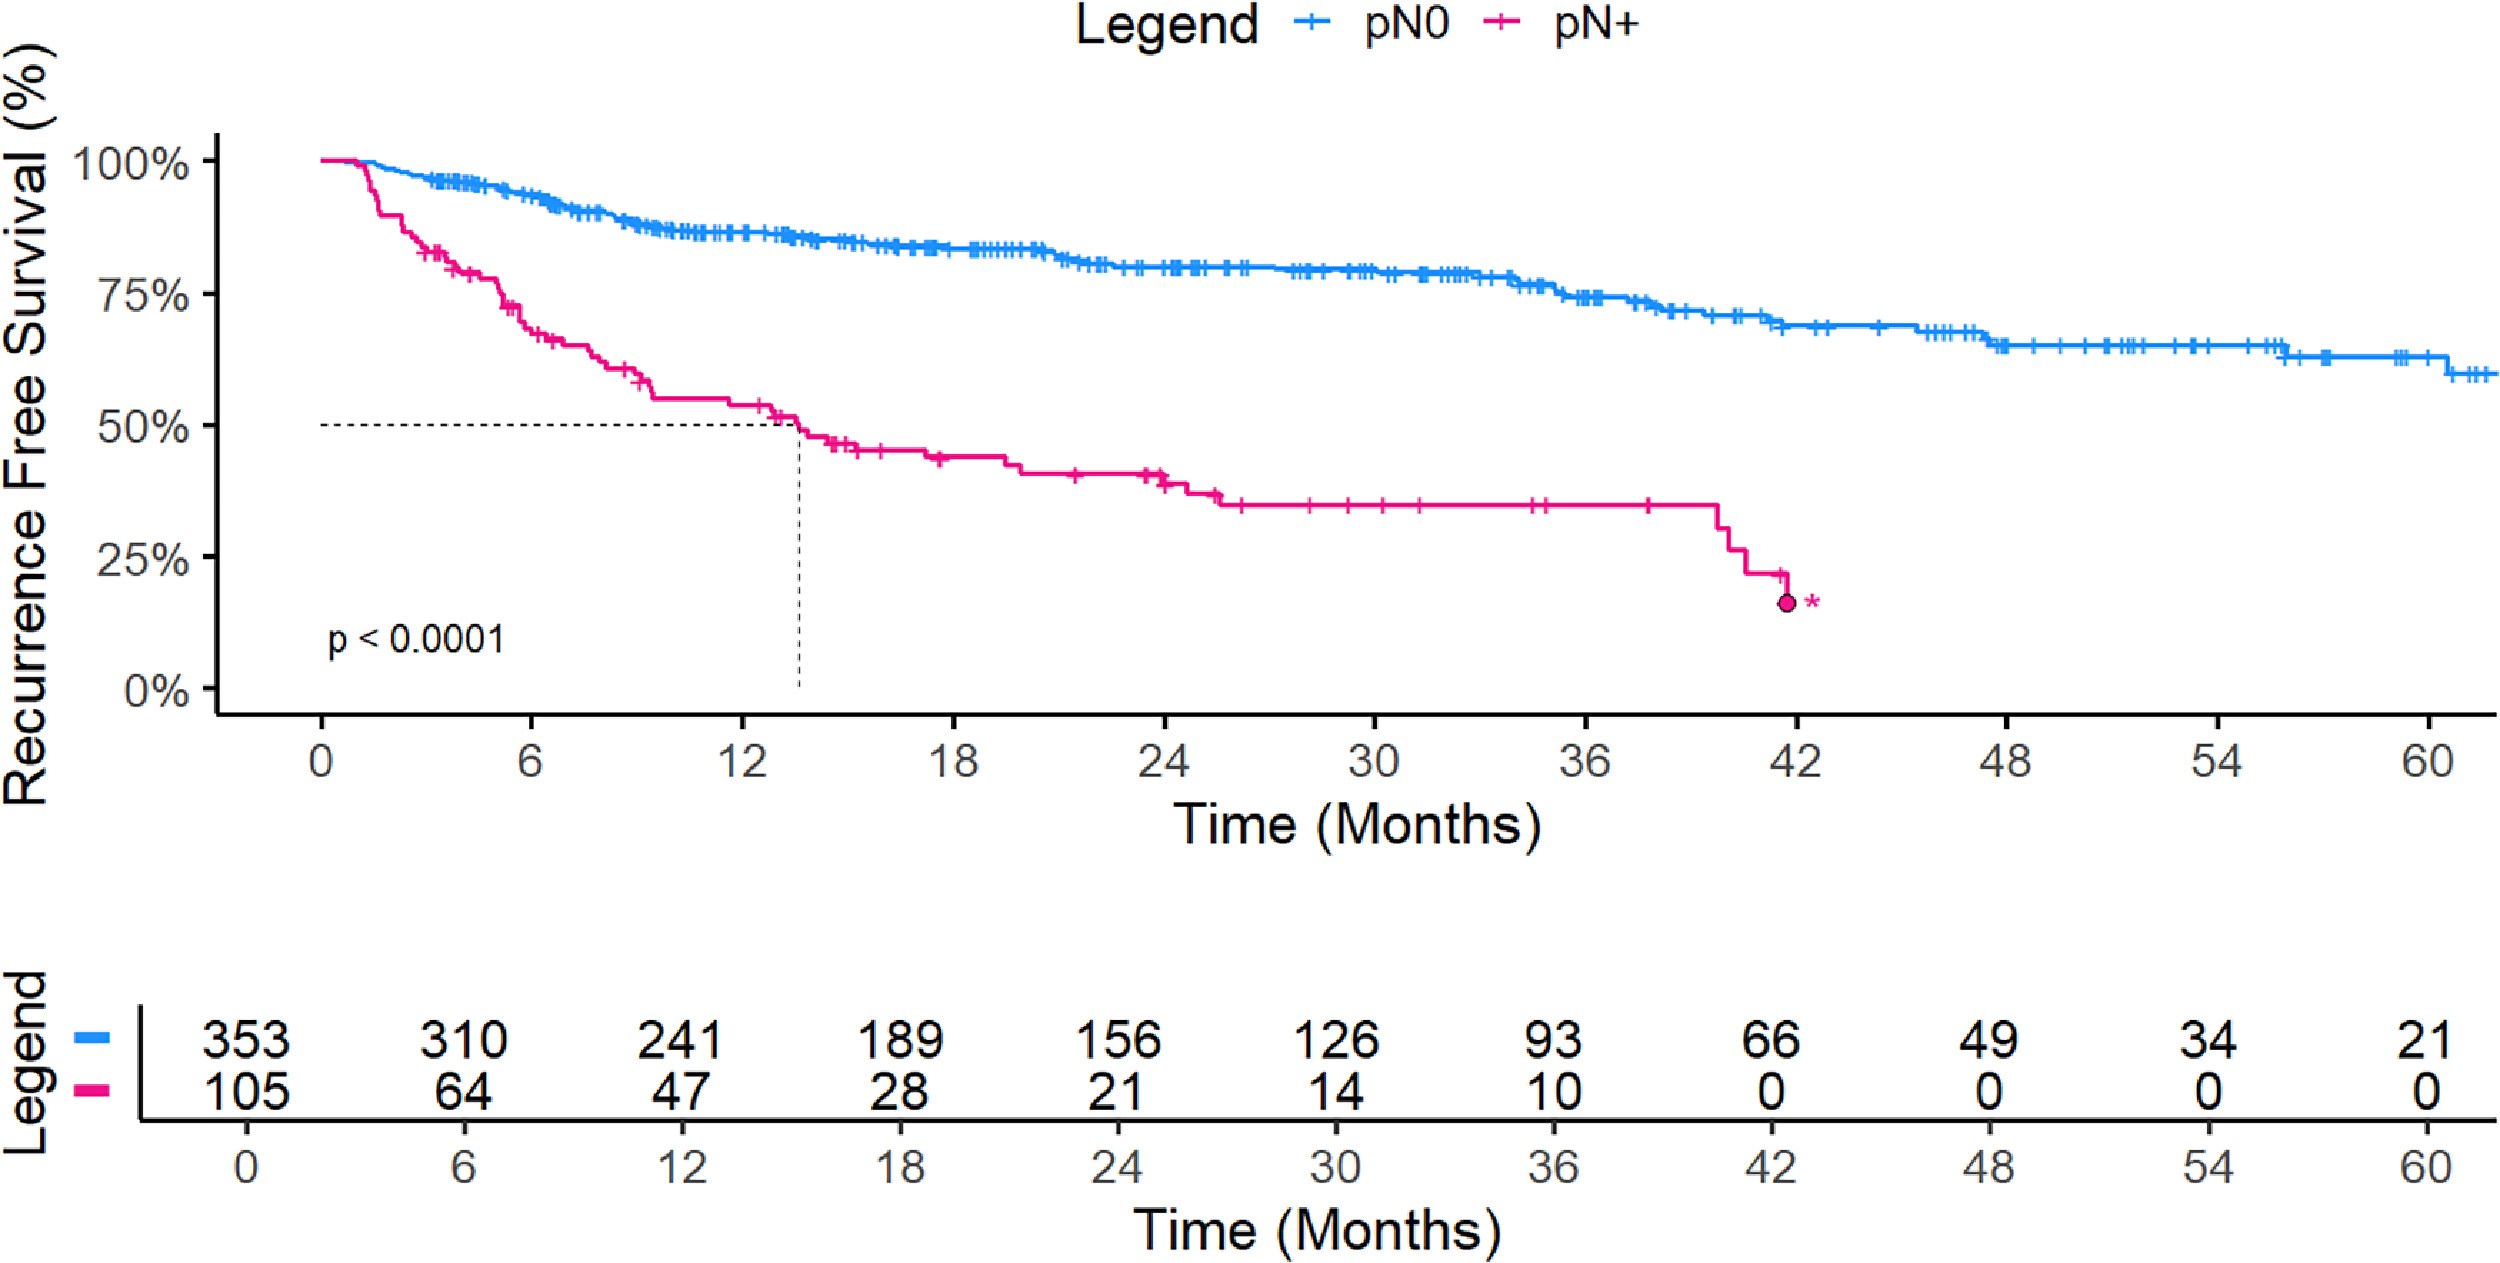
Analysis of patients stratified to having <pT3/≥pT3 and/or pN0/pN+ found that combination of ≥pT3 and pN+ had the worst RFS, with a median RFS at 3 years of 9.4 months versus NR in the other groups. Patients with <pT3 and pN0 disease had better RFS than patients with ≥pT3 and pN+ (BH, P = 0.019, Supplementary Fig. 2 ). On Cox-regression multivariate analysis, ≥pT3 disease (hazard ratio [HR] = 3.36 [2.18,5.18], P < 0.001), pN+ (HR = 2.39 [1.55, 3.7], P < 0.001) and patients who received neoadjuvant treatment (HR = 1.61 [1.1, 2.34], P = 0.013) were found as predictors of disease relapse ( Table 2 ).
| Overall ( n = 458) | pN0 ( n = 353) | pN+ ( n = 105) | P | ||
|---|---|---|---|---|---|
| Age (Median [IQR]) | 69 [63, 76] | 68 [63, 76] | 71 [62, 78] | 0.083 | |
| Race (%) | White | 280 (61.1) | 212 (60) | 68 (64.7) | 0.663 |
| African American | 49 (10.7) | 41 (11.6) | 8 (7.6) | ||
| Hispanic | 45 (9.8) | 35 (9.9) | 10 (9.5) | ||
| Asian | 19 (4.1) | 14 (4) | 5 (4.8) | ||
| Missing | 65 (14.2) | 51 (14.4) | 14 (13.3) | ||
| Sex (%) | Male | 358 (78.2) | 286 (81) | 72 (68.6) | 0.01 |
| Female | 100 (21.8) | 67 (19) | 33 (31.4) | ||
| BMI (Median [IQR]) | 26 [23, 30] | 26 [23, 30] | 25 [23, 29] | 0.372 | |
| ASA Score (%) | 1 | 2 (0.4) | 2 (0.6) | 0 (0) | 0.503 |
| 2 | 116 (25.3) | 94 (26.6) | 22 (21) | ||
| 3 | 308 (67.2) | 234 (66.3) | 74 (70.5) | ||
| 4 | 20 (4.4) | 14 (3.9) | 6 (5.7) | ||
| Missing | 12 (2.6) | 9 (2.5) | 3 (2.9) | ||
| Smoking Status (%) | Former | 214 (46.7) | 163 (46.2) | 51 (48.6) | 0.18 |
| Never | 148 (32.3) | 109 (30.9) | 39 (37.1) | ||
| Current | 72 (15.7) | 61 (17.3) | 11 (10.5) | ||
| Missing | 24 (5.2) | 20 (5.7) | 4 (3.8) | ||
| Charlson Co-morbidity Index (Median [IQR]) | 5 [ , ] | 5 [ , ] | 6 [ , ] | 0.01 | |
| Clinical T Stage (%) | ≥T2 | 267 (58.3) | 188 (53.3) | 79 (75.2) | <0.001 |
| <T2 | 191 (41.7) | 165 (46.7) | 26 (24.8) | ||
| Neoadjuvant Treatment (%) 1 | 114 (42.6) 1 | 88 (46.8) 1 | 26 (32.9) 1 | 0.05 | |
| Urinary Diversion Type (%) | Ileal Conduit | 302 (65.9) | 214 (60.6) | 88 (83.8) | <0.001 |
| Neobladder | 148 (32.3) | 134 (38) | 14 (13.3) | ||
| UCS | 8 (1.7) | 5 (1.4) | 3 (2.9) | ||
| Robotic Approach(%) | Intracorporeal | 393 (85.8) | 304 (86.1) | 89 (84.8) | 0.751 |
| Extracorporeal | 65 (14.2) | 49 (13.9) | 16 (15.2) | ||
| Operation Time (Median [IQR]) | 299 [262, 347] | 302 [264, 346] | 295 [250, 348] | 0.331 | |
| Intraoperative Transfusion (%) | 39 (8.5) | 27 (7.6) | 12 (11.4) | 0.157 | |
| Estimated Blood Loss (mL, Median [IQR]) | 300 [200, 500] | 300 [200, 500] | 300 [150, 400] | 0.32 | |
| Length of Stay (Median [IQR]) | 4 [ , ] | 4 [ , ] | 4 [ , ] | 0.845 | |
| Variant Histology (%) | 144 (31.4) | 90 (25.5) | 54 (51.4) | <0.001 | |
| Pathological T Stage (%) | pT0 | 58 (12.7) | 55 (15.6) | 3 (2.9) | <0.001 |
| pT1, pTis, pTa | 147 (32.1) | 139 (39.4) | 8 (7.6) | ||
| pT2 | 94 (20.5) | 83 (23.5) | 11 (10.5) | ||
| pT3a | 56 (12.2) | 31 (8.8) | 25 (23.8) | ||
| pT3b | 57 (12.4) | 27 (7.6) | 30 (28.6) | ||
| T4a | 39 (8.5) | 15 (4.2) | 24 (22.9) | ||
| T4b | 7 (1.5) | 3 (0.8) | 4 (3.8) | ||
| ≥pT3 (%) | 159 (34.7) | 76 (21.5) | 83 (79) | <0.001 | |
| Nodes Resected (Median [IQR]) | 23 [15, 31] | 22 [15, 31] | 24 [16, 31] | 0.385 | |
| Positive Surgical Margins (%) | Ureter | 19 (4.1) | 12 (3.4) | 7 (6.7) | 0.162 |
| Urethra | 10 (2.2) | 6 (1.7) | 4 (3.8) | 0.247 | |
| Soft Tissue | 16 (3.5) | 7 (2) | 9 (8.6) | 0.003 | |
| Adjuvant Treatment (%) | 94 (20.5) | 33 (9.3) | 61 (58.1) | <0.001 | |
| Recurrence (%) | 140 (30.6) | 78 (22.1) | 62 (59) | <0.001 | |
| Time to Progression (Median [IQR]) | 6 [3, 13] | 7 [3, 11] | 6 [3, 13] | 0.691 | |
| Follow-Up Time (Median [IQR]) | 20 [10, 37] | 22 [13, 40] | 14 [6, 26] | <0.001 | |
| Death of Any Cause (%) | 119 (26) | 67 (19) | 52 (49.5) | <0.001 |
Related posts:
 A systematic review of family history, race/ethnicity, and genetic risk on prostate cancer detection and outcomes: Considerations in PSA-based screening
 Neoadjuvant chemotherapy before radical cystectomy in patients with organ-confined and non-organ-confined urothelial carcinoma
 Comparison of outcomes between single-port and multiport retroperitoneal robotic partial nephrectomy
 The learning curve for transperineal MRI/TRUS fusion prostate biopsy: A prospective evaluation of a stepwise approach
 Testosterone recovery after androgen deprivation therapy
 Testicular cancer malpractice trends
Stay updated, free articles. Join our Telegram channel

Full access? Get Clinical Tree


