Highlights
- •
All of Us is a prospective clinic genomic database with a diverse population.
- •
Black, Hispanic, and Asian men are less likely to be screened for prostate cancer.
- •
Social determinant of health factors are significant predictors of PSA screening.
- •
Biopsy rates are similar across races after being screened with a PSA above 4 ng/mL.
- •
Those screened after 70 years old are often White, more educated, and homeowners.
Abstract
Purpose
To examine prostate cancer (PCa) screening disparities among ethnic groups in the U.S. using the All of Us database.
Material and Methods
White, Black, Hispanic, and Asian males ≥ 40 years old were included, excluding diagnosis’s that conflict with PCa screening. We analyzed prostate-specific antigen (PSA) screening rates by age based on American Urological Association guidelines, using multivariable logistic regression (MLR) and a Cox time-to-event models that considered race, age, income, education, insurance, and home ownership as independent variables. Initial screening ages and biopsy rates were also compared.
Results
Of 56,473 individuals, 18,088 had PSA measurements: 74% White, 15% Black, 9% Hispanic, and 2% Asian. Hispanic (20%) and Black (21%) minorities were less likely to undergo PSA screening compared to White men (39%, P < 0.001). However, minorities had their initial PSA earlier with their first test from 53–54 years old compared to White men at 58 years ( P < 0.001). MLR revealed race, age, income, education, insurance type, and home ownership as screening predictors ( P < 0.001). Screened Black men had higher odds of an elevated PSA ( P < 0.001), but the likelihood of receiving a biopsy postelevated PSA did not significantly differ from White men ( P = 0.821). Additionally, those screened at age ≥ 70 were more likely to be White, have at least a college education, and be homeowners ( P < 0.001).
Conclusions
White men, despite starting at a later age, are screened with PSAs more frequently than minorities, and often undergo screening at older ages outside the recommended guidelines. Black men did not have a higher rate of biopsy after having an elevated PSA compared to White men.
1
Introduction
Prostate cancer (PCa) is the 2nd leading cause of cancer-related deaths in men, but its mortality has decreased by 40% in the past 30 years, partly due to the adoption of prostate-specific antigen (PSA) [ ]. However, PSA screening is controversial and associated with overdiagnosis and overtreatment, prompting the United States Preventive Services Task Force (USPSTF) to recommend against routine screening in men over 75 years old and limited screening before the age of 55, while encouraging shared-decision making in all age groups [ ].
The impact of screening changes is important considering the racial disparities in PCa prevalence and mortality. Black men, for example, have a 60% higher risk of cancer incidence and a 2–3 greater risk of mortality compared to White men, while lower rates are observed in Asian populations [ , ]. These disparities highlight the need for research on screening trends across different racial groups, especially since Black men often have more aggressive cancer and present later than White patients [ , ]. The All of Us (AoU) database serves as an interesting resource in this context. As a nationwide clinic genomic resource with over 413,000 prospectively enrolled participants, over 75% of whom are from underrepresented groups, making it a comprehensive tool for analyzing healthcare disparities [ ].
The 2018 American Urological Association (AUA) guideline categorize men into different age groups for screening, with specific considerations for those at high-risk, like African American or those with a family history (FH) of metastatic or lethal adenocarcinomas [ ]. Despite these guidelines, recent literature indicates a decline in screening rates among Black men, especially in the 40-54 age group [ ]. Given limited Black patient enrollment and the lack of recent data post-2018 USPSTF recommendations, our study assessed the AoU database for racial disparities in PCa screening [ , , ]. We also evaluated factors influencing health care utilization in the United States (US) for PCa screening, and how this differs by race. We hypothesized that White men have higher PCa screening rates, even when accounting for social determinants of health (SDOH) factors, and expected that White men may get screened at older ages. Lastly, we predicted a lower rate and delayed time from screening until biopsy for Black men with elevated-PSA levels compared to White patients that we would attribute to social economic status (SES) factors limiting access to care.
2
Materials and methods
The AoU research program is a prospective cohort study aimed at recruiting at least 1 million individuals to provide a comprehensive database to investigate the effects of access to care, FH, environment, SES factors, and genomics on participant healthcare. This database uses aggregate data from genomic variants, physical measurements, survey responses, wearable data, and electronic health record (EHR) information. EHR information was acquired with patient consent from AoU and their participating medical facilities. Analysis was performed using AoU version 7 (R2022Q4R9) [ ].
Patients ≥ 40 years old who self-identified as White, Black, Asian, or Hispanic and whose EHR information was released were included as a cohort eligible for PSA screening. Hispanic included anyone who selected “Hispanic, Latino, or Spanish” for ethnicity; the other 3 racial groups consisted of men’s self-identified race and those who did not select “Hispanic, Latino, or Spanish.” To focus on a cohort of men that likely underwent PSA testing as part of PCa screening, patients with a history of prostatitis, hematuria, urinary retention, and PCa diagnosis or prostate biopsy prior to the initial PSA measurement were excluded. Men were separated into age groups based on the 2018 AUA screening guidelines, where age was truncated as of July 1st, 2022 (freezing date of AoU v7) [ ]. “Elevated-PSA” was defined as a PSA ≥ 4 ng/ml. Under the overarching nomenclature database Athena, we resorted to a SNOMED code (4163261), 2 LOINC codes (3013603 and 3034548), and 3 CPT4 codes (2110026, 2110027, 2110028) for retrieval of PCa diagnosis, PSA measurement, and biopsy procedure from participants’ EHR data [ ].
The percentage of patients screened was calculated as the total number of patients found with a PSA measurement in the EHR divided by the total number of the screening-eligible cohort. This proportion was compared across race groups, adjusting age, income, education, insurance type, and home ownership status as covariates. Data for the 4 SES factors were parsed from participants’ responses to the Basics Survey, while FH of PCa was parsed from the Survey of Personal and Family Health History. For home ownership, only owning and renting were retained, other answers were treated as missing data. For insurance, 6 categories were used: Employment, Medicaid, Medicare, VA/Military, multiple plans, and uninsured.
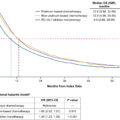
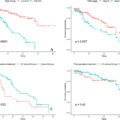
Further subgroup analysis was performed using the patient age of first PSA screening contrasted across the races. Within the PSA-screened sub-cohort and adjusting for the covariates, we compared cross-race PSA elevation rates and further biopsy rates while adjusting for PSA elevation. For the 2 layers of sub-cohorts, 2 time-to-event variables were modeled: 1) the time from initial PSA measurement to a biopsy and 2) the time from elevated-PSA to biopsy. Jupyter Notebook of R environment was utilized for data extraction and statistical analysis. Multivariable logistical regression (MLR), Kaplan-Meier curve, and Cox proportional hazard model were utilized to calculate odds/hazard ratios (HR) and p-values. Chi-squared test and unpaired Wilcoxon 2-group test was used to compare data. A p-value < 0.05 was considered statistically significant.
3
Results
A total of 56,473 individuals were included in the study, of which 18,088 men underwent a PSA measurement. Within this cohort ( Table 1 ), the most common self-identified race was White (74%), followed by Black (15%), then Hispanic (9%), and lastly Asian (2%).
| Factor | # of Total Men (%) | # of Men with a PSA (%) | # of Men Without a PSA (%) | |
|---|---|---|---|---|
| Race/ Ethnicity | White | 34627 (61%) | 13413 (74%) | 21214 (55%) |
| Black | 12550 (22%) | 2684 (15%) | 9866 (26%) | |
| Hispanic | 8012 (14%) | 1612 (9%) | 6400 (17%) | |
| Asian | 1284 (2%) | 379 (2%) | 905 (2%) | |
| 55-69 | 24142 (43%) | 8390 (46%) | 15752 (41%) | |
| Age | 40–54 | 15599 (28%) | 1894 (10%) | 13705 (36%) |
| ≥ 70 | 16732 (30%) | 7804 (43%) | 8928 (23%) | |
| Education | > High School | 37633 (67%) | 14263 (79%) | 23370 (61%) |
| = High School | 11541 (20%) | 2544 (14%) | 8997 (23%) | |
| < High School | 5793 (10%) | 991 (5%) | 4802 (13%) | |
| NA a | 1506 (3%) | 290 (2%) | 1216 (3%) | |
| Home | Own | 29168 (52%) | 12209 (67%) | 16959 (44%) |
| Rent | 18761 (33%) | 4498 (25%) | 14263 (37%) | |
| NA b | 8544 (15%) | 1381 (8%) | 7163 (19%) | |
| Income ( per year ) | > $75,000 | 18857 (33%) | 7943 (44%) | 10914 (28%) |
| $35,000–$75,000 | 9095 (16%) | 3562 (20%) | 5533 (14%) | |
| < $35,000 | 17636 (31%) | 3903 (22%) | 13733 (36%) | |
| NA a | 10885 (19%) | 2680 (15%) | 8205 (21%) | |
| Insurance | Employment | 12607 (22%) | 4254 (24%) | 8353 (22%) |
| Multi-Insured | 8667 (15%) | 4018 (22%) | 4649 (12%) | |
| VA/Military | 1600 (3%) | 849 (5%) | 751 (2%) | |
| Medicare | 10340 (18%) | 4004 (22%) | 6336 (17%) | |
| Medicaid | 9666 (17%) | 1447 (8%) | 8219 (21%) | |
| Uninsured | 3719 (7%) | 598 (3%) | 3121 (8%) | |
| NA a | 9874 (17%) | 2918 (16%) | 6956 (18%) |
a NA = Values that were missing survey data. All percentages were derived by dividing the total N of 98867 that included missing-value categories.
b NA = combined raw values of Housing “Other Arrangement” and housing “NA a ”
3.1
Screening rates by racial group
Overall, White men (39%) underwent screening more frequently ( P < 0.001) compared to Black (21%) and Hispanics (20%), and marginally more than Asian men (30%, P = 0.056). On MLR, race, in addition to age, income, education, insurance type, and home ownership all were independent predictors of men receiving PSA screening ( Table 2 , P < 0.001). We ran a variance inflation factor test over the candidate screening predictors (4 SES factors, age bracket, and race), finding no concerning collinearity (all variance inflation factors < 3). Looking at the median number of PSAs per year across the 4 races, separated by age ranges (40–54, 55–69, and ≥ 70), we still see that White patients have a statistically higher screening frequency compared to Hispanics across all age groups and Black patients in the 55–69 and ≥ 70 age groups.
| Factor | Level | % of Men w/ PSA | OR [95% CI] | P-value |
|---|---|---|---|---|
| Race/ Ethnicity | White ( Ref ) | 39 | – | – |
| Black | 21 | 0.81 [0.75–0.88] | <0.001 | |
| Hispanic | 20 | 0.8 [0.73–0.88] | <0.001 | |
| Asian | 30 | 0.85 [0.72–1] | 0.056 | |
| Age ( years ) | 55–69 ( Ref ) | 35 | – | – |
| 40–54 | 12 | 0.26 [0.24–0.28] | <0.001 | |
| ≥ 70 | 47 | 1.12 [1.04–1.19] | <0.001 | |
| Education | > High School ( Ref ) | 38 | – | – |
| = High School | 22 | 0.83 [0.77–0.9] | <0.001 | |
| < High School | 17 | 0.74 [0.65–0.83] | <0.001 | |
| Home | Own ( Ref ) | 42 | – | – |
| Rent | 24 | 0.8 [0.75–0.86] | <0.001 | |
| Income ( per year ) | > $75,000 ( Ref ) | 42 | – | – |
| $35,000–$75,000 | 39 | 0.97 [0.91–1.03] | 0.275 | |
| < $35,000 | 22 | 0.81 [0.75–0.88] | <0.001 | |
| Insurance | Employment ( Ref ) | 34 | – | – |
| Multi-Insured | 46 | 1.24 [1.14–1.34] | <0.001 | |
| VA/Military | 53 | 2.22 [1.95–2.53] | <0.001 | |
| Medicare | 39 | 0.85 [0.78–0.92] | <0.001 | |
| Medicaid | 15 | 0.65 [0.58–0.72] | <0.001 | |
| Uninsured | 16 | 0.87 [0.76–1.01] | 0.067 |
Related posts:
 Optimal imaging techniques across the spectrum of testicular cancer
 Defining the genetic profile of prostate cancer
 Real-world survival and economic burden among patients with locally advanced or metastatic urothelial carcinoma in the United States
 The value of a postoperative nomogram based on the primary tumor score for overall survival of patients with renal cell carcinoma and inferior vena cava tumor thrombus
 Germline genetic testing for prostate cancer: Ordering trends in the era of expanded hereditary cancer screening recommendations
 Navigating the gray zone: Machine learning can differentiate malignancy in PI-RADS 3 lesions
Stay updated, free articles. Join our Telegram channel

Full access? Get Clinical Tree


