Highlights
- •
Renal Cell Carcinoma (RCC) as high number cases in western countries.
- •
3D reconstructions of kidneys and tumors are useful for the surgical operations.
- •
Contact Surface Area (CSA) between kidney and tumor is a predictive factor for the peri-operative parameters.
- •
Use of the algorithm developed to calculate the CSA leveraging the geometry of the 3D reconstructions.
Abstract
Objective
The Contact Surface Area (CSA) is a predictor for peri-operative parameters and represents the contact area between the tumor and the organ. A precise method for calculating CSA is yet to be found. We tested a new CSA calculation method as a predictor of intra-operative parameters in robot assisted partial nephrectomy (RAPN).
Materials & Methods
The study population consisted of all consecutive patients treated with RAPN at a single high-volume European institution (between 2020 to 2023; 82 patients). We proposed a new method to measure the real value of CSA using an algorithm that leverages the geometry of kidneys and tumors obtained from 3D reconstruction. These reconstructions were obtained using the certified software Materialized Mimics InPrint. The peri-operative parameters of patients were recorded in an anonymous database. We explored the correlation between real CSA (RCSA), CSA of Hsieh (HCSA), PADUA and R.E.N.A.L. scores with peri-operative parameters using Spearman’s correlation. Furthermore, we examined which of RCSA, PADUA and R.E.N.A.L. score better describes the intra-operative parameters, Warm Ischemia Time (WIT), Operating Time (OT), and Estimated Blood Loss (EBL) using Receiver Operating Characteristic (ROC) curve analysis. Multivariable linear regression analyses were performed.
Results
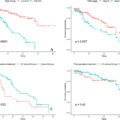
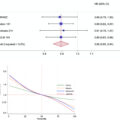
Seventy-eight patients were prospectively enrolled. We observed a significant correlation between RCSA and WIT ( P < 0.001), OT ( P < 0.001) and EBL ( P < 0.001). Moreover, RCSA outperformed both the PADUA and R.E.N.A.L. score as demonstrated in the ROC curve analysis. In ROC analysis was chosen a threshold for each of the parameters: for WIT 20 minutes, for OT 180 minutes and for EBL 200 mL. At multivariable regression analysis, RCSA emerged as the only independent predictor for WIT ( P = 0.002), OT ( P = 0.01) and EBL ( P < 0.001).
Conclusions
Our original 3D RCSA calculation method was associated to intra-operative surgical outcomes. As compared to PADUA and RENAL score, our calculated RCSA represented a more reliable predictor of intra-operative parameters.
1
Introduction
Renal cell carcinoma (RCC) accounts for 3% of all solid malignancies and ranks tenth in terms of prevalence, with a higher number of cases in western countries [ , ]. The main objective in the treatment of localized stage I renal masses is to obtain complete cancer control together with a maximal preservation of the surrounding heathy renal parenchyma, avoiding positive surgical margins [ , ]. Three-dimensional 3D reconstruction plays an important role approaching both easy and complex tumour masses that overturn renal anatomy, especially when vascular anatomy is surgically challenging [ , ]. Several scores have been considered to approach robot-assisted partial nephrectomy (RAPN) in order to standardize the characterization of renal tumours and assess the complexity of nephron sparing surgery (NSS), correlating with some perioperative outcomes; pure nephrometry scores (radius [R], exophytic/endophytic [E], nearness to collecting system/sinus [N], anterior/posterior [A], and location relative to polar lines [L] [RENAL], preoperative aspects and dimensions used for an anatomical classification [PADUA], Simplified Padua Renal Nephrectomy [SPARE], C-Index, Diameter-Axial-Polar [DAP], Contact Surface Area [CSA]) [ ] can effectively correlate with intra- and post-operative outcomes. However, these nephrometric scores were formulated during a period when 3D reconstruction had not yet been extensively developed and applied. The concept of CSA was introduced by Leslie et al. in 2014 [ ] and it is a variable and an anatomical measure that aims to quantify the contact area between the renal tumor and the surrounding healthy parenchyma. Specifically, the CSA calculation was based on the assumption that all kidney tumors were similar to spheres. It reflects 2 indicative anatomical factors of surgical complexity: the size of the tumor and its degree of intraparenchymal extension [ , ]. In our study, we reassess the values of CSA in our cohort of patients treated with RAPN, using an innovative calculation system based on 3D DICOM to obtain a more reliable calculation of contact surface between tumor mass and surrounding renal parenchyma, correlating the new contact surfaces area values with perioperative outcomes after RAPN.
2
Materials and methods
2.1
Data acquisition
We evaluated all consecutive patients undergoing RAPN between November 2020 to May 2023 at our Institute, “IRCCS Ospedale Policlinico San Martino,” operated by the same surgeon. We included 78 patients out of the 82 who underwent RAPN excluding those with more than 1 tumor or bilateral tumors. We collected demographic data Body Mass Index (BMI), age and sex. Clinical data included postoperative and follow-up parameters such as haemoglobin (HB), creatinine (CREA) and estimate glomerular filtration rate (eGFR). Intra-operative surgical data comprised warm ischemia time (WIT), operative time (OT) and estimate blood loss (EBL). Pathological features such as histotype (T, N, M), staging and benign/malignant classification were also recorded for each patient. We also considered nephrometry scores as PADUA score and R.E.N.A.L. score. The measure of eGFR relied on the CKD-EPI equation adjusted for creatinine values [ ]. Pre-operative data was recorded 1 day before the operation, while postoperative data 3 days after surgery. Furthermore, follow-up data were recorded 6 months after surgery. Therefore, only patients treated between November 2020 and December 2022 had follow-up data. Additionally, the percentage change in eGFR (PCE) was calculated for each patient using the following formula: <SPAN role=presentation tabIndex=0 id=MathJax-Element-1-Frame class=MathJax style="POSITION: relative" data-mathml='(eGFRpost−eGFRpre)/eGFRpre’>(𝑒𝐺𝐹𝑅𝑝𝑜𝑠𝑡−𝑒𝐺𝐹𝑅𝑝𝑟𝑒)/𝑒𝐺𝐹𝑅𝑝𝑟𝑒(eGFRpost−eGFRpre)/eGFRpre
( e G F R p o s t − e G F R p r e ) / e G F R p r e
2.2
Surgical technique
All the consecutive RAPNs were performed by the same experienced robotic surgeon (C.T.) by transperitoneal or retroperitoneal approach, depending on surgeon’s preference, tumor location and patients’ anatomical conditions. In all cases, after hilum dissection and renal mass exposure, the main renal artery was clamped and tumor dissected with sharp and blunt dissection. Inner renography was always performed using a Monocryl 3/0 running suture with sliding-clip technique. A separate suture was applied for opened calyxes closure, if necessary. Early unclamping of the main artery was done after inner renography. Cortical renography using Vicryl 0 running suture with sliding-clip technique was applied only in case of residual bleeding for the tumor bed after artery unclamp. Haemostatic agents were applied only in selected cases (large parenchymal defects, minimal bleeding after renography.
2.3
CT protocol
In case that radiological examinations of the tumor were not adequate and available for the preoperative planning of RAPN, we acquired the images with a SIEMENS SOMATON DEFINITION FLASH 128 scanner with a technique dedicated to 3D reconstructions, which provided a double administration of iodinated contrast agent 10 minutes apart, 50 + 90 ml (split bolus technique) and the execution of an arterial phase scan with bolus tracking (delay 10 sec) acquired after the second administration of contrast agent, at 3.5 mL /sec. This dedicated protocol allows the simultaneous opacification of the urinary tract, the renal arterial and venous vessels by the contrast agent (using the physiological early renal venous opacification).
2.4
Segmentation
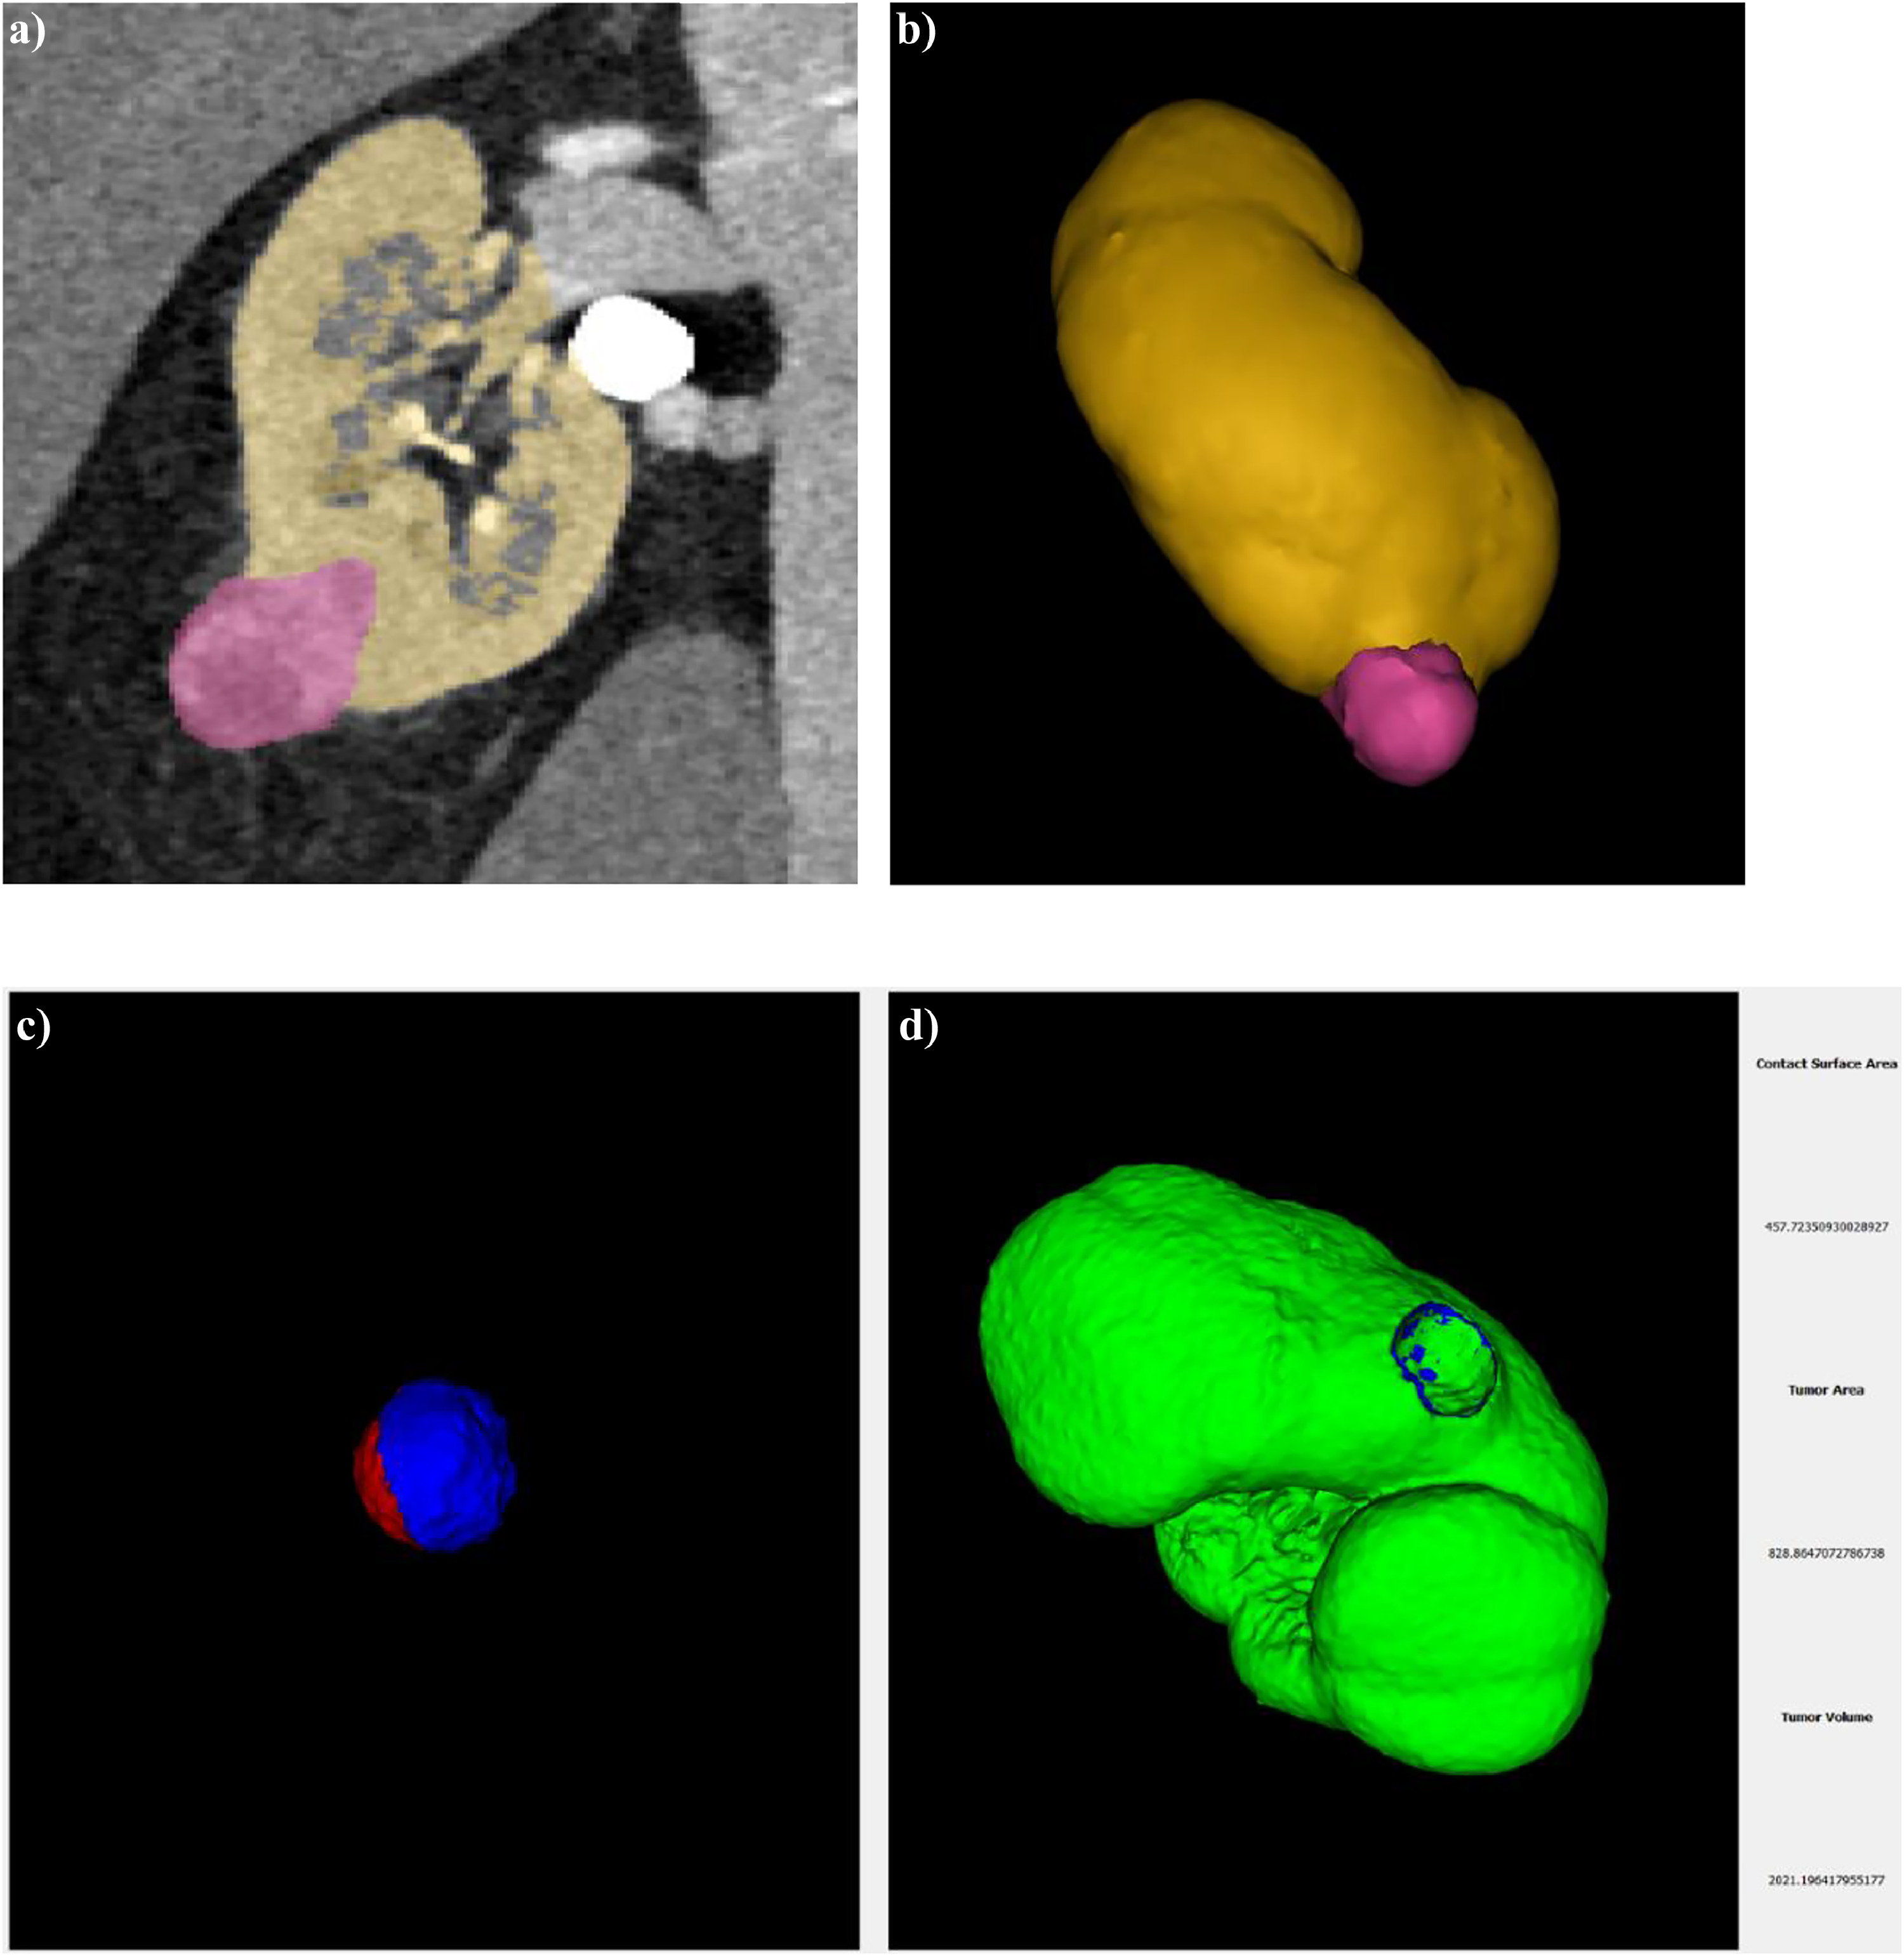
Not all images we used for segmentation were acquired with the protocol described above as some patients underwent CT scan in other centers. However, for all patients we utilized the same phase for segmentation, specifically arterial phase. This phase provided the best visualization of the kidneys and tumors, allowing for accurate recognition. For the reconstruction of the kidney and tumors, we utilized a certified medical software Materialize Mimics inPrint. The absence of holes in the parenchyma involved in the contact surface is a necessary condition for computing CSA, as depicted in Fig. 1 A. We used the reconstructed kidneys and tumors to compute the real value of CSA ( Fig. 1 B).
2.5
Algorithm
An algorithm was developed which leverages the geometry of the tumor and the organ to estimate the real value of CSA. Our software processed the 3D reconstructions of the kidney and tumor, uploaded as STL files, and returned the Real Contact Surface Area (RCSA) together with a 3D visualization of the tumor and of the RCSA, as shown in Fig. 1 C. Additionally, the algorithm provided the values of the total area and total volume of the tumor. These values were compared with the measurement of the total area and volume automatically computed by Materialize after the 3D reconstruction, and they were found to be consistent. The performance of the algorithm in estimating the RCSA was evaluated using a synthetic benchmark built using a Computer-Aided Design (CAD) software consisting of 20 pairs of 3D models, 1 representing the tumor and the other representing the organ for measuring the RCSA. The estimation of RCSA presented a median error of 2.01% (interquartile range [IQR] 2.77%). The source code and the executable can be found at the following link https://github.com/ACarfi/contact-surface-area-gui .
2.5
CSA measured with Hsieh’s method
In addition, we utilized the CT images to replicate the approximate formula proposed by Hsieh for evaluating the CSA values (HCSA) [ ]. The formula is <SPAN role=presentation tabIndex=0 id=MathJax-Element-2-Frame class=MathJax style="POSITION: relative" data-mathml='2*π*r*d’>2*𝜋*𝑟*𝑑2*π*r*d
2 * π * r * d
where r is the maximum radius of the tumor and d represents the maximum depth of the tumor into the uninvolved parenchyma considering the axes perpendicular to the tumor. The CSAH was calculated in a double-blind manner by 2 radiologists, 1 with more than 20 years of experience in CT reporting, and the other with 3 years of experience. In our statistical analysis we relied on the measurement conducted by the radiology with more experience.
2.7
Statistical analysis
Statistical analysis was conducted using the software IBM SPSS statistic version 29.0.1.0. Continuous and ordinal variables are shown as median and interquartile range (IRQ), while categorical variables as percentage. To determine the normality of the data, the Kolmogorov-Smirnov test was employed. Since all data distribution was found to be non-normal, non-parametric test were used for analysis. Spearman’s correlation was utilized to investigate potential correlation between RCSA, HCSA, PADUA score, R.E.N.A.L. score and preoperative, intra-operative and follow-up parameters. Receiver Operating Characteristic (ROC) curve were used to evaluate the performances of RCSA, PADUA score and R.E.N.A.L. score factors compared to intra-operative parameters such as WIT, OT, EBL. Furthermore, multivariable linear regression was used to determine if RCSA could predict intra-operative parameters. The criteria required for applying linear regression were tested prior to conducting the analysis. A significance level of 0.05 was chosen, serving as the threshold for accepting or rejecting the hypotheses in the various tests.
3
Results
Of the 78 patients that underwent RAPN, 19 were female (24%) and 59 males (76%). As shown in the Table 1 the median age was 64 year (56–73 as IQR), BMI was 26 kg/m 2 (23.88–29.41 as IQR). All of the aforementioned cases showed negative margins in the histopathological examination. The median WIT was 17 min (11–22 IQR), OT was 180 min (130–210 IQR) and EBL was 100 mL (57.5–287.5 IQR). In addition to the postoperative complications listed in Table 2 , 2 intraoperative complications were observed: 1 case of conversion to radical nephrectomy and 1 major vascular lesion. We obtained the following median and IQR of the surface and tumor volume: RCSA was 14.37 cm 2 (7.37–24.15), total area and total volume computed using the algorithm were 30.44 cm 2 (16.13–66.23) and 14.24 cm 3 (6.54–45.28) respectively, HCSA measured by more experienced radiologist was 15.02 cm 2 (6.17–26.28). PADUA score had a median value of 8,5 (7–10 IQR) while R.E.N.A.L. score 7 (5–8 IQR). Median values of pre-operative parameters were HB 13.85 g/dL (12.5–14.9 IQR), CREA 1.0 mg/dL (0.8–1.1 IQR), eGFR 82 mL/min/1.73m 2 (64.25–93.25). The post-operative parameters ( Table 1 ) had the following median values HB was 12.1 g/dL (11–13.6 IQR), CREA was 1.0 mg/dL (0.9–1.2 IQR) and eGFR was 75 mL/min/1.73m 2 (57–91 IQR). Instead for the follow-up parameters we obtained HB 14 g/dl (12.63–15 IQR), CREA 1.1 mg/dL (0.9–1.2 IQR) and eGFR 73 mL/min/1.73m 2 (61–87.5 IQR). As can be seen in Table 3 the Spearman’s test showed a correlation between RCSA and intra-operative parameters. There was no correlation between RCSA and pre-operative parameters. Instead, there was statistically significant correlation with the post-operative CREA post-operative (ρ = 0.27 & P = 0.01) and an inverse correlation with post-operative eGFR post-operative ( Ρ = -0.32 & P = 0.004). Furthermore, we found a significant correlation with the follow-up parameters CREA ( Ρ = 0.38 & P = 0.004) and eGFR ( Ρ = -0,34 & P = 0.01). The correlation between RCSA and follow-up HB turned out to be not significant ( P > 0.05). Also, HCSA, as shown in previous works, was correlated with intra-operative parameters and follow-up parameters. PADUA score was correlated with intra-operative parameter, post-operative eGFR but had no correlation with follow-up parameters. R.E.N.A.L. score exhibits a strong correlation with WIT ( Ρ = 0.47 & p < 0.001), OT ( Ρ = 0.25 & P = 0.03) and EBL ( Ρ = 0.29 & P = 0.01). R.E.N.A.L. was also correlated with follow up HB (ρ = -0.29 & P = 0.03), but there was no correlation with follow-up eGFR ( P > 0.05). We further examined the correlation between RCSA and HCSA, PADUA score, and R.E.N.A.L. score. The PCE was found to be unrelated to both scores and the 2 CSA.
Related posts:
 Optimal imaging techniques across the spectrum of testicular cancer
 Defining the genetic profile of prostate cancer
 Real-world survival and economic burden among patients with locally advanced or metastatic urothelial carcinoma in the United States
 Concomitant antihistamine administration is associated with improved survival outcomes in patients with locally advanced or metastatic urothelial carcinoma treated with atezolizumab. Analysis of individual participant data from IMvigor210 and IMvigor211
 The value of a postoperative nomogram based on the primary tumor score for overall survival of patients with renal cell carcinoma and inferior vena cava tumor thrombus
 Gene expression of prostate-specific membrane antigen ( FOLH1) in clear cell renal cell carcinoma predicts angiogenesis and response to tyrosine kinase inhibitors
Stay updated, free articles. Join our Telegram channel

Full access? Get Clinical Tree


