Highlights
- •
Accounting for postprogression therapies improves overall survival (OS) estimation.
- •
Multistage treatment strategies (MTS) guide treatment sequence decisions to optimize OS.
- •
Sequentially Multiple Assignment Randomized Trials (SMART) offer unbiased comparisons of MTS.
- •
SMART designs are underutilized in oncology.
- •
Modernizing trial design and data collection can facilitate MTS estimation.
Abstract
Modern advances in systemic and localized therapies for patients with renal cell carcinoma (RCC) have significantly improved patients’ outcomes. If disease progression occurs after initial treatment, clinicians often have multiple options for a first salvage therapy. Because salvage and initial treatments both may affect overall survival time, and they may interact in unanticipated ways, there is a growing need to determine sequences of initial therapy and first salvage therapy that maximize overall survival while maintaining quality of life. The complexity of this problem grows if a second salvage therapy must be chosen for patients with treatment-resistant disease or a second progression occurs following first salvage. On November 9, 2023, a think tank was convened during the International Kidney Cancer Symposium (IKCS) North America to discuss challenges in accounting for postprogression therapies when estimating overall survival (OS) time based on randomized controlled trial (RCT) data. The present manuscript summarizes the topics discussed, with the aim to encourage adoption of statistical methods that account for salvage therapy effects to obtain scientifically valid OS estimation. We highlight limitations of traditional methods for estimating OS that account for initial treatments while ignoring salvage therapy effects and discuss advantages of applying more sophisticated statistical methods for estimation and trial design. These include identifying multistage treatment strategies, correcting for confounding due to salvage therapy effects, and conducting Sequentially Multiple Assignment Randomized Trials (SMARTs) to obtain unbiased comparisons between multistage strategies. We emphasize the critical role of patient input in trial design, and the potential for information technology (IT) advances to support complex trial designs and real-time data analyses. By addressing these challenges, future RCTs can better inform clinical decision-making and improve patient outcomes in RCC.
1
Introduction
Modern advances in systemic and localized therapies have improved the outcomes of patients with renal cell carcinoma (RCC) [ ]. Clinicians now choose among a variety of therapeutic options, both for initial treatment and later for salvage therapy if disease progression is seen [ ]. There is a growing consensus that, rather than considering treatment selection at each therapeutic stage separately, there is a need to identify personalized treatment sequences to maximize overall survival (OS) time for an individual patient while maintaining good quality of life. A multistage treatment strategy (MTS), also known as an adaptive treatment strategy, dynamic treatment regime (DTR), or treatment policy, is a sequence of therapeutic decision rules, with each using the patient’s current history [ ]. An MTS is a formal description of what physicians do in practice: at each stage of a patent’s therapy, the physician may use the patient’s history of previous treatments, clinical outcomes, and evolving characteristics as tailoring variables for making the next treatment decision [ ]. Due to the heterogeneous effects that different salvage therapies can produce when given at disease progression, traditional methods for estimating OS distributions that only account for initial treatments in a randomized controlled trial (RCT) can lead to incorrect conclusions and mislead practicing oncologists [ ]. To address this, contemporary RCC RCTs have begun to report OS estimates that account for effects of second line therapies [ ].
An important problem is how to identify a patient’s optimal MTS at the start of therapy. For example, an aggressive frontline treatment that maximizes the initial response rate but also is likely to cause severe toxicity may not be the first component of the MTS that is best in terms of OS, especially for older patients or those who have multiple co-morbidities. OS is a critical measure in oncology and should be reliably estimated to guide treatment decisions, regulatory approvals and healthcare resource allocation. On November 8, 2023, the Kidney Cancer Association (KCA) brought together a multidisciplinary group of clinicians, methodologists, and patient advocates during the International Kidney Cancer Symposium (IKCS) North America in Nashville (TN) to discuss key methodological issues when dealing with MTS’s. The goals were to initiate a discussion of how and why postprogression therapies in contemporary RCC trials can impact OS estimates, and to provide recommendations for potential strategies and infrastructure changes that can facilitate accurate OS estimation and inform development of new MTS’s for RCC. The meeting followed a structured agenda, including topic presentations, group discussions, and a series of moderated sessions aimed at identifying key challenges and formulating recommendations. A literature review was conducted from January 1980 to November 2023 as outlined in the Preferred Reporting Items for Systematic reviews and Meta-Analyses (PRISMA) flow diagram in the Supplementary Appendix . To explain how an optimal MTS may be identified, we first establish elementary ideas involving treatment choices at successive stages of therapy that can influence OS time.
2
Clinical endpoints and estimands
The addendum E9(R1) on estimands and sensitivity analyses in clinical trials was released in 2019 by the International Council for Harmonization of Technical Requirements for Pharmaceuticals for Human Use (ICH) [ ]. It defined an estimand as a parameter that corresponds to the relative treatment effect of an experimental intervention on the clinical endpoint of interest compared to a control in an RCT [ , ]. Estimands can be defined in many ways [ ]. Perhaps counterintuitively, for a given dataset, 2 different estimands can lead to different conclusions regarding which of 2 treatments is better. For example, Msaouel et al. [ ] described how comparing 2 RCC treatments in terms of 3-month OS probabilities versus median OS times can lead to opposite conclusions. More specifically, the absolute risk reduction (ARR) for death in 3 months is more pronounced in patients with more aggressive disease, whereas median OS differences are more notable in patients with more favorable disease [ , ]. Consequently, when comparing treatments, the choice of estimand is very important.
Clinical endpoints are treatment outcomes that characterize how patients feel, function, or survive [ ]. OS time is an intuitive, objective, clinically meaningful endpoint for comparing the effectiveness of a new intervention against a control in an RCT [ ]. However, OS time is affected by both initial and subsequent therapies. One approach that avoids this complication is to use intermediate endpoints, such as disease-free survival (DFS) time, progression-free survival (PFS) time, or time to recurrence (TTR), all of which are evaluated prior to postprogression therapies. A limitation is that an intermediate endpoint often does not mark the end of a patient’s treatment process [ ]. For example, TTR is used in perioperative (neoadjuvant and adjuvant) RCTs to identify whether a patent is cured, since patients who experience recurrence are not cured while those who have not experienced recurrence after a prolonged period of time may be considered cured. However, patients also may die from causes other than cancer, known as “competing risks.” Therefore, improvements in cure rates may not be reflected fully by OS. These examples illustrate why, in general, the relevance of a given clinical endpoint is context dependent.
Composite clinical endpoints containing the word “survival,” such as DFS time, measure the time to either an intermediate endpoint or death, whichever occurs first. Conversely, endpoints without “survival” in their name measure only the intermediate endpoint. For example, TTR only considers disease recurrence as an event, while recurrence-free survival (RFS) time, accounts for both disease recurrence and death. Similarly, time to progression (TTP) measures only disease progression, treating death without progression as an independent censoring event, whereas PFS includes either disease progression or death as events [ ]. DFS often is used interchangeably with RFS, but also may include as an event the occurrence of a new disease, such as another primary cancer. A limitation of these composite clinical endpoints is that, implicitly, they treat the intermediate event and death as being equally important.
A common practice in RCTs is to use a surrogate endpoint to make early inferences about treatment effects, rather than waiting for the longer follow up required to evaluate an outcome such as OS or PFS. A surrogate endpoint is a variable that typically is assessed relatively quickly, such as at the end of 1 therapy cycle [ ]. Methodological considerations for robust surrogate marker estimation have been reviewed extensively elsewhere [ ]. Examples of commonly used surrogates include complete remission (CR) or pathologic response in a neoadjuvant RCC study, or a biomarker reaching a specified level that signifies a targeted agent is effective, each evaluated within 1, 2, or 3 months from the start of therapy. For example, response defined in terms of serum prostate-specific antigen (PSA) level may be used, in certain contexts, as a surrogate to predict PFS or OS in patients with prostate cancer [ ]. Because it is evaluated sooner, PFS often is used as a surrogate for OS. However, PFS is based on radiologic measurements that are prone to human error and may not be reflective of patients’ health status and quality of life [ ].
Regulators and researchers typically use PFS as an imperfect surrogate for OS [ ]. While it is rare for a clinically active therapy to show poor intermediate endpoints but good OS, or vice versa, such discrepancies can occur due to nonintuitive aspects of probabilistic relationships, and should be investigated further [ , ]. It also is not uncommon for an active therapy to show positive intermediate endpoints but inconclusive or negative OS results, especially in indolent diseases requiring long-term follow-up [ , ]. Careful data assessment is necessary if an intermediate endpoint shows a positive signal for the investigational treatment, but OS favors the control arm. While surrogate early or intermediate endpoints are convenient because they are evaluated more quickly, they do not perfectly predict a long-term outcome of primary interest and may lead to misleading conclusions. For example, Thall [ ], Chapter 7, described a RCT comparing Melphalan (Mel) to Busulfan + Melphalan (Bu+Mel) as preparative regimens for autologous stem cell transplantation in multiple myeloma. The estimated 90-day CR rates were 13/32 (40.6%) for Mel and 6/44 (13.6%) for Bu+Mel, indicating that Mel was greatly superior, and accordingly the trial was stopped early for futility. However, longer follow-up gave estimated 12-month PFS probabilities 77% for Mel and 90% for Bu+Mel. After IRB approval, the trial was re-started, with the final results showing that Bu+Mel was superior to Mel for PFS, but not for OS [ ]. Similarly, a phase I-II trial in patients with advanced clear cell RCC (ccRCC) found that starting doses of 80 mg and 120 mg of sitravatinib have nearly identical estimated efficacy-toxicity trade-off desirability scores, using objective response to characterize efficacy, but 120 mg was superior in terms of both PFS time and QOL evaluated at 3 months [ ]. These examples illustrate how using an early surrogate alone may mislead investigators to make an incorrect conclusion about long-term outcomes.
Endpoints focused exclusively on antitumor efficacy may not adequately capture risk-benefit trade-offs that must be assessed during clinical decision-making. This requires also accounting for the impact of adverse events, time commitment, financial toxicity and other costs to patients [ , , , ]. Furthermore, cancer treatments can trigger or worsen comorbidities, and cause secondary malignancies, that may adversely impact quality of life and shorten OS [ ]. Comprehensive measures of patient benefit can encompass all these considerations by using joint utility functions which capture patient preferences over a set of outcomes such as PFS time and total toxicity burden. By tailoring these preferences to individual patient characteristics, decision rules can be developed for choosing between different treatment strategies [ , ]. Herein, we focus exclusively on challenges related to accurate OS estimation in the presence of both initial and subsequent therapies. This facilitates development of future estimands and MTS designs that incorporate more comprehensive risk-benefit trade-off considerations.
3
Bias in OS comparison from subsequent therapy at disease progression
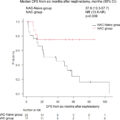
The scientific goal of an RCT is to compare treatments, such as an experimental regimen E and a control C, in terms of a specified clinical outcome, such as a treatment response indicator, progression-free survival (PFS) time, or overall survival (OS) time. This may be formalized by denoting the unknown population mean of the outcome with treatments E and C by θ E and θ C , and noting that a statistical estimator of the E-versus-C effect, Δ = θ E – θ C , is unbiased if the estimator’s distribution has mean Δ. The mean of a biased estimator does not equal Δ, which may mislead physicians to wrongly prescribe an inferior treatment. For example, if everolimus is preferentially prescribed in patients with favorable risk disease then its outcomes will be falsely inflated compared with therapies prescribed for patients with more aggressive cancer. Because bias may arise in numerous ways [ , , , ], it commonly is avoided by randomizing patients between E and C, so that each patient receives 1 of the 2 treatments with probability 0.5 each. If desired, more structured randomization strategies may be used to ensure additional balance on patient characteristics, which increases study power and obtains more efficient parameter estimators. Common methods include using permuted blocks, which are predefined patient subgroups with treatments assigned in random order and the desired allocation proportion achieved exactly within each block, or adjusting the randomization to balance on strong prognostic covariates, such as the International Metastatic Renal Cell Carcinoma Database Consortium (IMDC) risk score at the time of randomization ( Fig. 1 ).
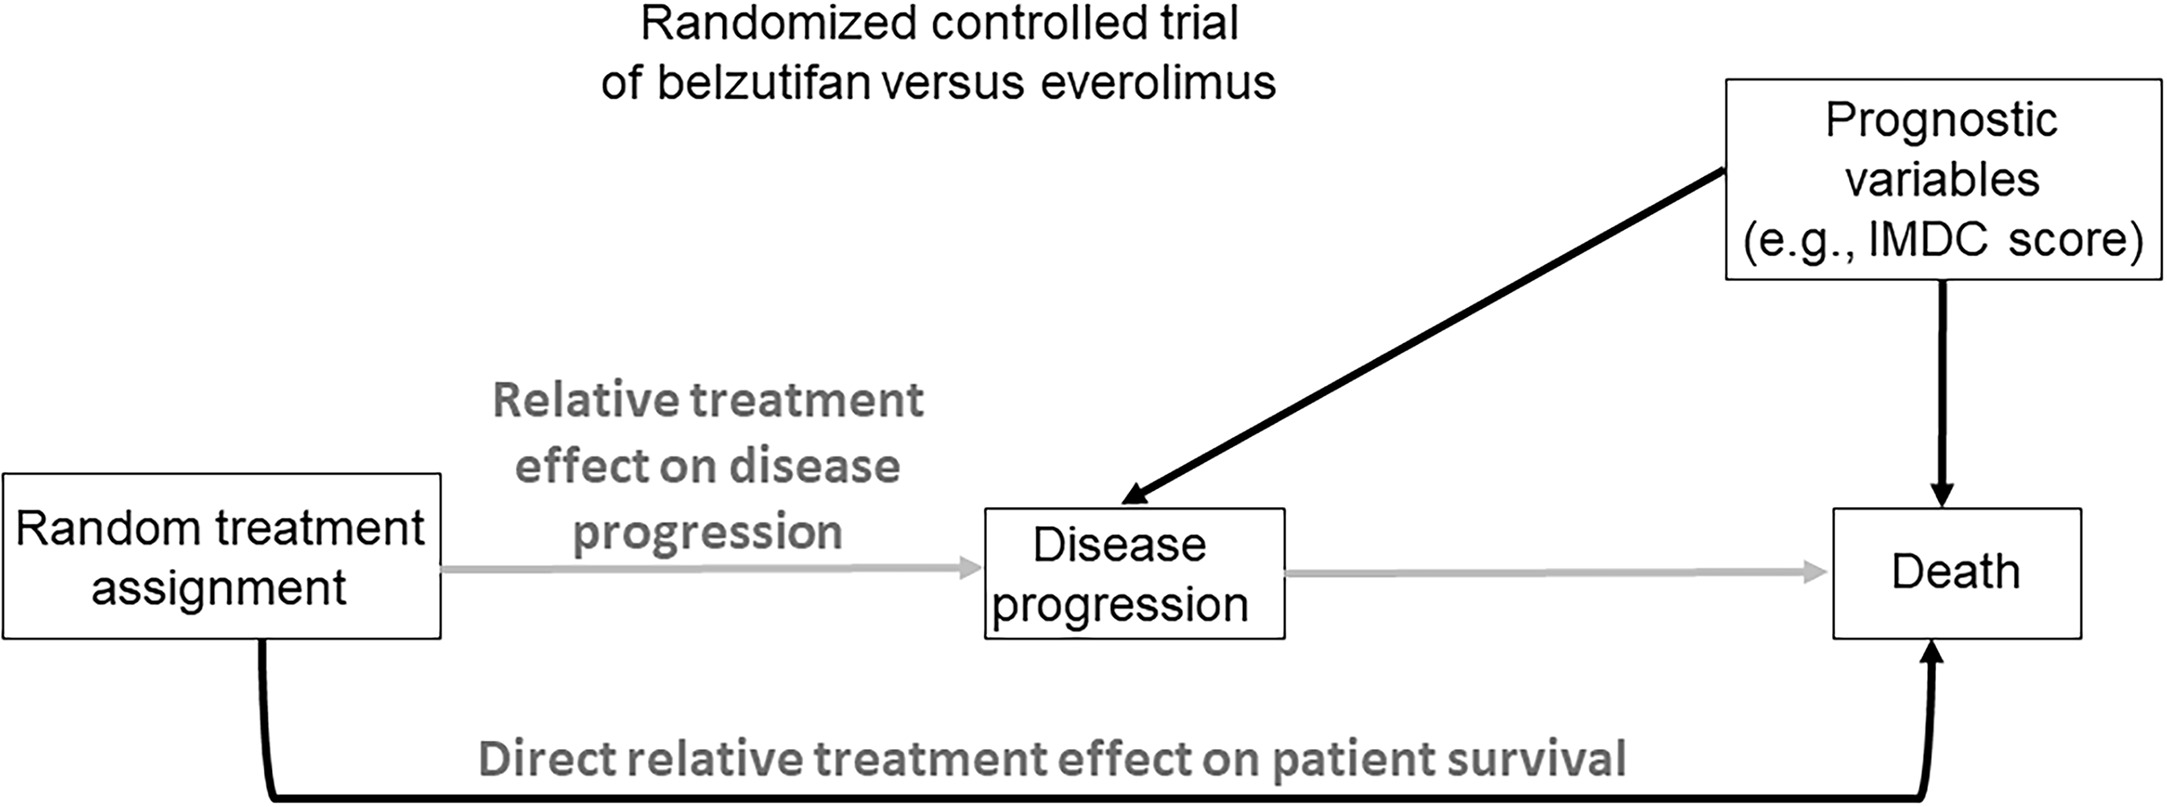
Among possible outcomes that may be used to compare E to C, OS is the least ambiguous both in terms of its assessment and universal agreement regarding its beneficial value to the patient. This makes OS a highly reliable outcome that is considered the “gold standard” compared to all other clinical efficacy endpoints commonly used in oncology RCTs [ ]. However, OS is most reliable, and provides a basis for using simple, well established statistical estimators, only when no salvage therapies are administered after disease progression, and death occurs either without being preceded by measurable disease progression or shortly after it. In such settings, randomization ensures that an unbiased estimator of the comparative treatment effect Δ on OS can be obtained ( Fig. 1 ). For example, in the LITESPARK-005 trial [ ], the aim was to compare the effect of the HIF2α inhibitor belzutifan to the mTOR inhibitor everolimus in heavily pretreated patients with ccRCC. Assuming that no active subsequent therapies were available and that patients adhered perfectly to their assigned treatments, randomization ensured that an unbiased estimator of Δ, the mean belzutifan versus everolimus effect on OS, could readily be computed [ , ].
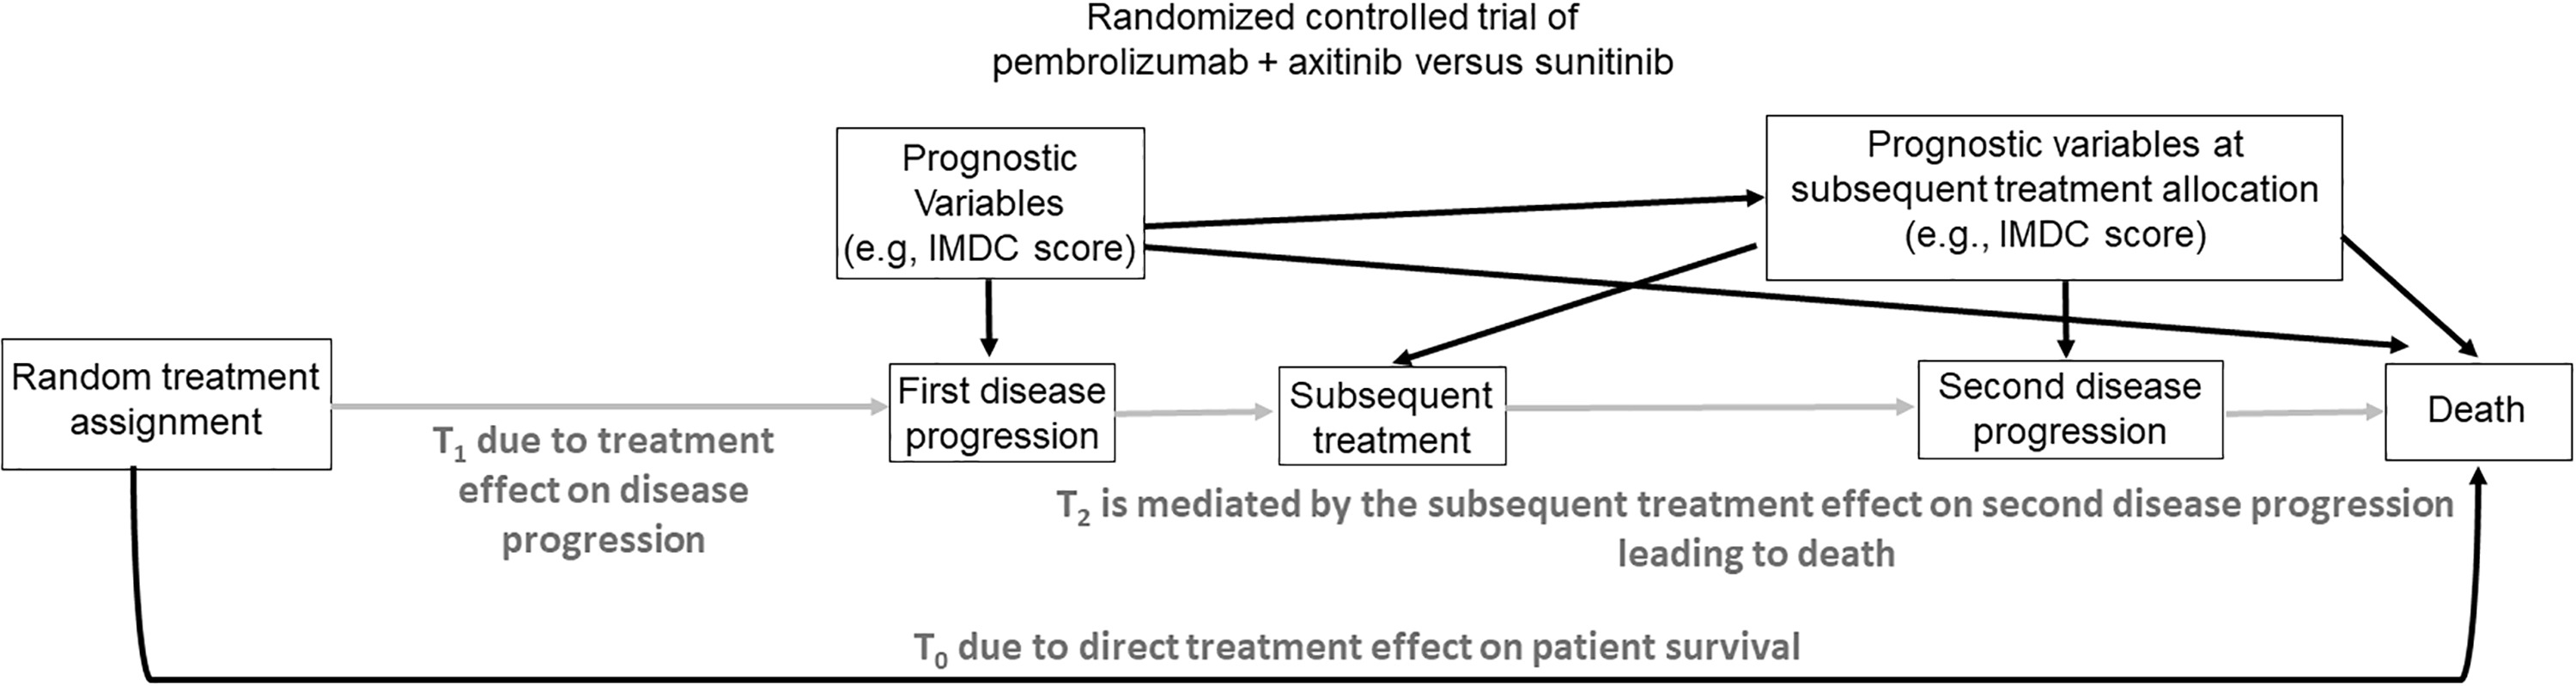
A major problem arises, however, if a salvage therapy is administered after progression. In this case, randomization between initial therapies cannot ensure that an unbiased estimator of Δ can be obtained using standard methods. This is due to confounding of salvage therapy effects with initial treatment effects on OS. To see why this happens, we first note that, in this case, there are 3 possible transition times for each patient that involve progression, salvage therapy, and death, illustrated in Fig. 2 . If progression does not occur, then OS time is T OS = T 0 = time to death without progression, which only depends on the initial treatment assigned by randomization. If progression occurs, then T OS = T 1 + T 2 , where T 1 = time to first progression and T 2 = time from first progression to death. In this case, T OS depends on both the initial randomized treatment through T 1 and the first salvage treatment through T 2 ( Fig. 2 ). While the therapeutic goal of salvage treatment is to make subsequent survival time T 2 longer, it is essential to bear mind that one must account for initial and salvage therapy together, since they may interact. Death and first progression are semi-competing risks since death censors first progression, but not conversely. In practice, most often first salvage treatment is chosen by clinicians, with the choice based on the magnitude of T 1 , the therapies available, and the patient’s characteristics, possibly updated at progression. Thus, when evaluating T OS = T 1 + T 2 , the effect of the randomized initial treatment on T 1 is confounded with the effect of the subjectively chosen salvage treatment on T 2 , which may depend on patient and disease characteristics as well as available treatment options at the time of progression. This type of confounding is similar to what occurs in observational studies [ ]. As a result, for RCTs where salvage therapies chosen by clinicians may be given at progression, standard statistical methods for comparing initial treatments in terms of OS are incorrect.
To illustrate numerically how salvage therapy effects may be mistaken for initial treatment effects, suppose that RCC patients are randomized between initial treatments A and B that both have a mean time to disease progression of 12 months. Suppose all patients receive the same salvage treatment S at progression, but the initial and salvage treatments favorably interact so that the 2-stage regime (A,S) has a mean time from progression to death of 10 months compared to 4 months for (B,S). Assume, for simplicity, that no patients die without first progressing. Since the overall mean survival times are 12+10 = 22 months for (A,S) versus 12+4 = 16 months for (B,S), and all patients received the same salvage therapy, a naïve analysis might conclude that A is better than B. However, the 22 versus 16 month difference is due entirely to the fact that S interacts differently with A and B. It therefore is critical for clinicians to be aware of this favorable interaction between A and S. Such scenarios may be particularly pertinent with immune checkpoint therapies which have long serum half-life and even longer pharmacodynamic effects that can potentially interact with subsequent therapies [ ].
A second example is a setting where, either by chance or due to physician choice, 80% of patients who progressed after A received salvage S 1 and 20% received salvage S 2 , while for patients who progressed after B, 20% received S 1 and 80% received S 2 . Suppose that neither salvage therapy interacts with initial therapy, and the mean times from progression to death are 10 months for S 1 and 2 months for S 2 . This gives mean OS times 20.4 for patients who received A initially versus 15.6 for patients who received B initially. Thus, if salvage effects are ignored, it appears that A is superior to B, despite the fact that the difference in mean OS is due entirely to the 2 salvage treatments being given with different probabilities. In each of these examples, due to effects of salvage therapies, randomizing patients between initial therapies does not ensure unbiased comparisons. For example, in a phase 3 RCT comparing tivozanib versus sorafenib in patients with ccRCC, a much greater proportion of patients received a subsequent targeted therapy after being randomized to sorafenib (63%) versus tivozaninib (13%) [ ].
To avoid confounding due to salvage therapy, a common practice is to use PFS time as the outcome, since it is defined as the minimum of T 0 and T 1 , and thus PFS only depends on the initial randomized treatments ( Fig. 2 ). This is why standard statistical methods for estimation and comparison are valid when PFS time is used as the primary outcome of a RCT. However, a limitation of PFS is that it incorrectly treats progression and death as equally important and unambiguous.
If one desires to use OS time as the primary outcome, 2 key scientific issues must be addressed. The first issue, explained above, is that it is incorrect to use standard statistical methods to compare the initial randomized treatments as if they characterize the entire treatment process, since this ignores key information. The second implication is that it is far more relevant to evaluate and compare all possible MTS pairs (initial treatment, first salvage treatment) used in the trial, in terms of their effects on OS. An MTS is what is used to treat a patient, and it reflects clinical practice [ , ]. Consequently, statistical methods for evaluating and comparing the effect of different MTS strategies on OS are required.
For patients who experience a first progression, write T 3 = time from first progression to second progression, and T 4 = time from first progression to death. In this case, for patients who experience a first progression, progression-free survival time after second-line of therapy (PFS-2) may be defined as T 1 + the minimum of (T 3 , T 4 ). Because the distributions of T 3 and T 4 depend on first salvage therapy, PFS-2 depends on the treatment sequence (initial treatment, salvage treatment at first progression). PFS-2 has been proposed as an alternative to OS as a primary outcome for RCC trials where multiple lines of subsequent therapies are available, since PFS-2 only depends on the first salvage therapy given following first progression therapy [ ]. However, PFS-2 has the same limitations of other intermediate endpoints, such as PFS, including bias due to effects of the frequency, timing, and subjectivity of radiological assessments. As detailed in the Supplementary Appendix , PFS-2 also is subject to confounding biases that influence the first postprogression treatment selection. Therefore, the strategies outlined below to address the impact of postprogression therapies on OS also are relevant for PFS-2.
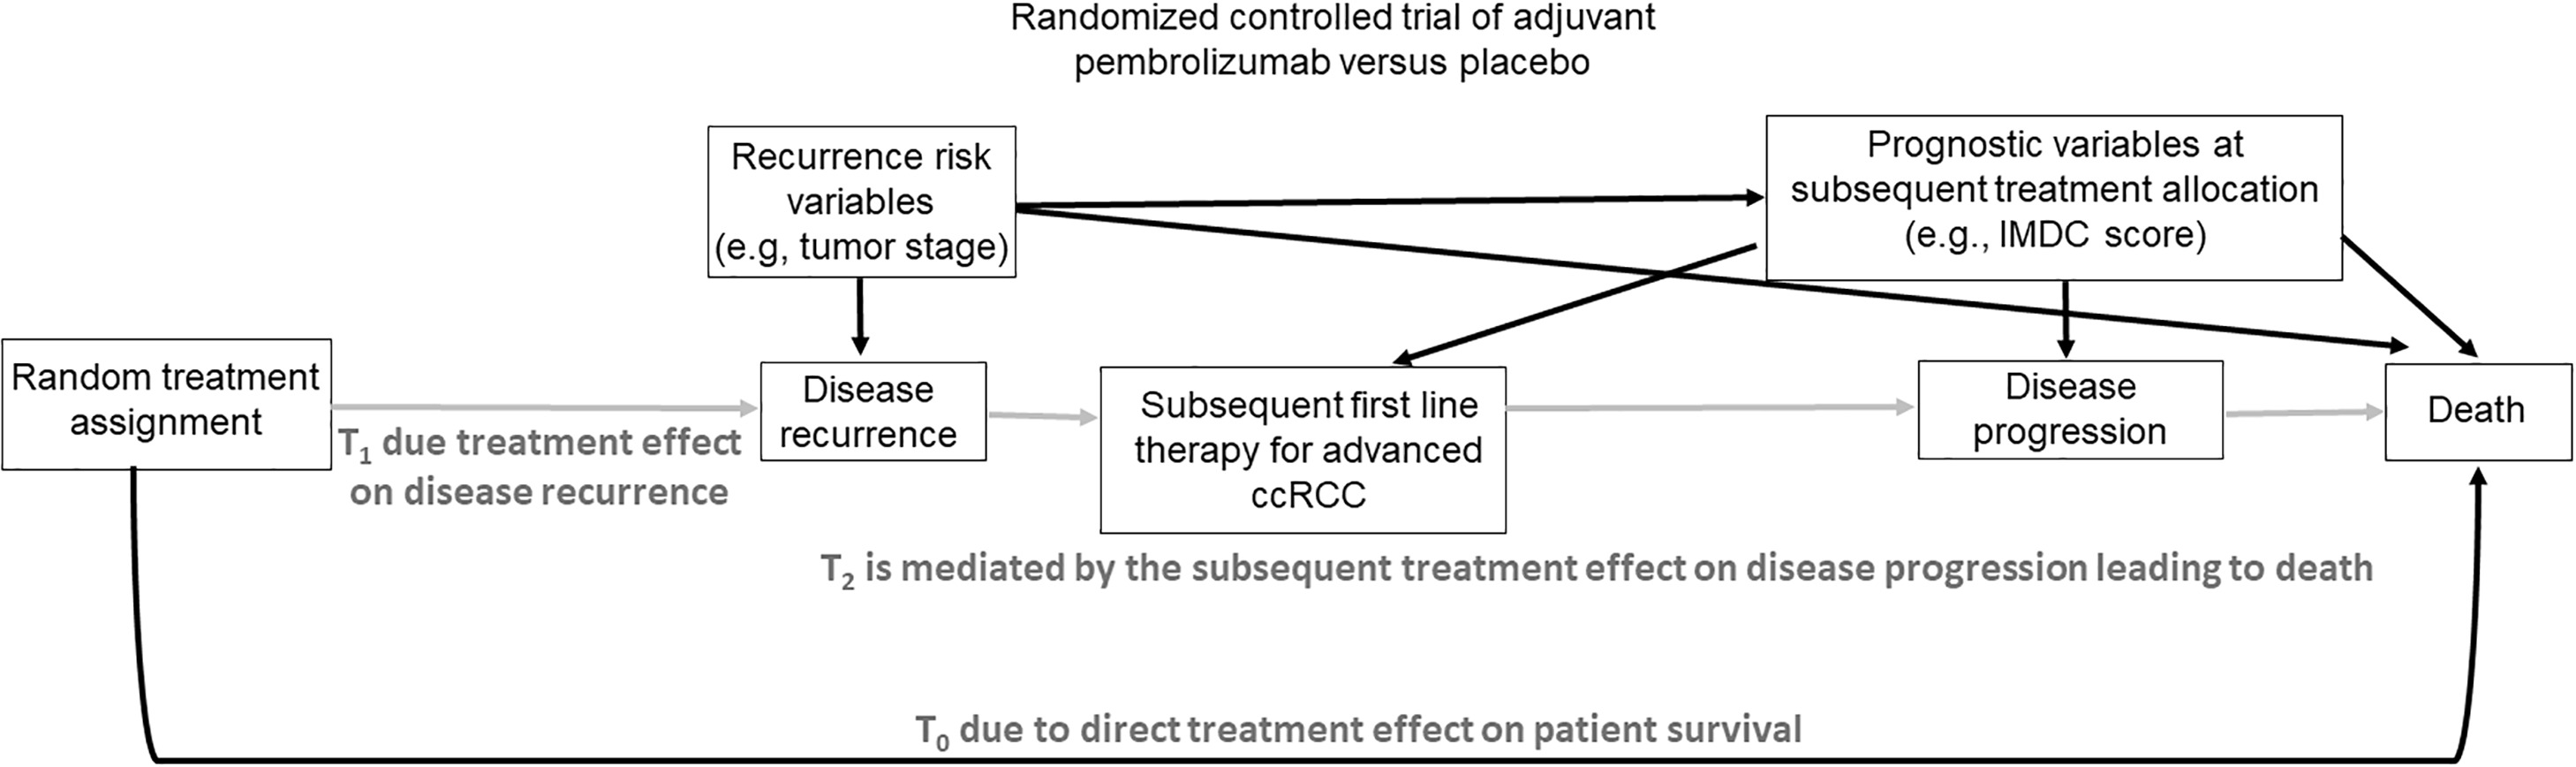
The KEYNOTE-564 RCT aimed to test the impact on OS of adjuvant pembrolizumab versus placebo in patients with ccRCC who had increased recurrence risk after surgery [ ]. As shown in Fig. 3 , the comparative effect of the 2 randomized initial treatments on DFS is unconfounded. However, if it is desired to compare initial treatments based on OS, all of the problems discussed above arise. The majority of ccRCC patients whose disease recurs after their initial random treatment assignment have access to subsequent therapies, and the choice between these options is influenced by the availability of a particular therapy in a given country/location, as well as confounders used as tailoring variables, such as IMDC risk score at the time of subsequent treatment choice. Therefore, statistical modeling of OS time must account for frontline therapy, all subsequent therapies administered, and confounders such as the IMDC score and geographic location that may influence therapy choices. The scientific aim is to make fair, “apples-to-apples” comparisons between each MTS that clinicians can use to estimate potential OS outcomes for patients based on their actual therapeutic process. Supplementary Appendix explains how randomization facilitates estimation of potential OS outcomes in the absence and presence of postprogression therapies.
Related posts:
 Optimal imaging techniques across the spectrum of testicular cancer
 Defining the genetic profile of prostate cancer
 Retrospective analysis of partial cystectomy in patients with muscle-invasive urothelial carcinoma: A German single-center experience
 Impact of neoadjuvant therapy on prognosis in renal cell carcinoma with inferior vena cava thrombus
 Bladder cancer associated with elevated heavy metals: Investigation of probable carcinogenic pathways through mitochondrial dysfunction, oxidative stress and mitogen-activated protein kinase
 Oral Cavity Cancer
Stay updated, free articles. Join our Telegram channel

Full access? Get Clinical Tree


