Highlights
- •
Predicting models may reduce unnecessary biopsies and optimize its indication.
- •
Risk Scores have shown to work as reliable and ease to use predicting models.
- •
Combining age, PSA density, lesion’s length and PIRADS score we predict csPCa.
Abstract
Background
The implementation of population screening for prostate cancer has increased the number of patients with biochemical suspicion. Prediction models may reduce the number of unnecessary biopsies by identifying patients who benefit the most from them. Our aim is to develop a prediction model that is easily applicable in patients with suspicion of prostate cancer in the urology clinic setting to avoid unnecessary biopsies.
Methods
We developed prediction models based on risk scores for the detection of prostate cancer and clinically significant prostate cancer using the TRIPOD guidelines. For this, we conducted an observational and retrospective review of computerised medical records of 204 patients undergoing prostate fusion biopsy between 2018 and 2021. We also reviewed other prediction models for prostate cancer including radiological parameters and targeted sampling of suspicious lesions.
Results
A total of 204 patients underwent a biopsy, 138 were diagnosed of prostate cancer, and from them, 60 of clinically significant prostate cancer. Multivariate regression and random forest analysis were performed. Age, PSA density, diameter of the index lesions and PIRADS score on MRI were identified as predictors with an Area Under the Curve ranging between 0.71 and 0.80 and acceptable calibration results. Risk scores may avoid between 21.7% and 48.1% of biopsies.
Conclusion
Our prediction models are characterised by ease of use and may reduce unnecessary biopsies with satisfactory discrimination and calibration results while bringing benefits to the healthcare system and patients.
Introduction
The implementation of population screening for prostate cancer based on prostate-specific antigen (PSA) levels has increased the number of patients with biochemical suspicion of prostate cancer. The diagnosis of prostate cancer is confirmed by histopathological analysis and the performance of a prostate biopsy is associated with a set of risks and potential complications for each patient, as well as high costs for the healthcare system. Some authors have reported up to 6.4% of infectious complications, 2% of acute urinary retention and 1.5% hematuria requiring clinical assesment after a MRI-guided prostate biopsy [ , ].
Prostate cancer may present an indolent course or, on the contrary, it may impact on morbidity and survival requiring an active treatment. Clinically significant prostate cancer is defined by pathologic findings such as the Gleason Score or tumoral volume [ ].
Predictive modelling aims to combine various radiological, clinical and biochemical parameters to assess the individual risk of developing prostate cancer and optimise decision-making concerning prostate biopsy [ ]. Several predictive methods based on large multicentre cohorts have been reported; these approaches require exhaustive information and are based on studies carried out using systematic prostate biopsy [ ]. On the other hand, to our knowledge, no prediction models based on risk scores have been published.
The aim of this study was to identify predictors of prostate cancer (PCa) and clinically significant prostate cancer (csPCa) in patients undergoing software-assisted fusion prostate biopsy, and to develop an easily applicable prediction model to support individualised decision-making about whether to perform a prostate biopsy.
Material and methods
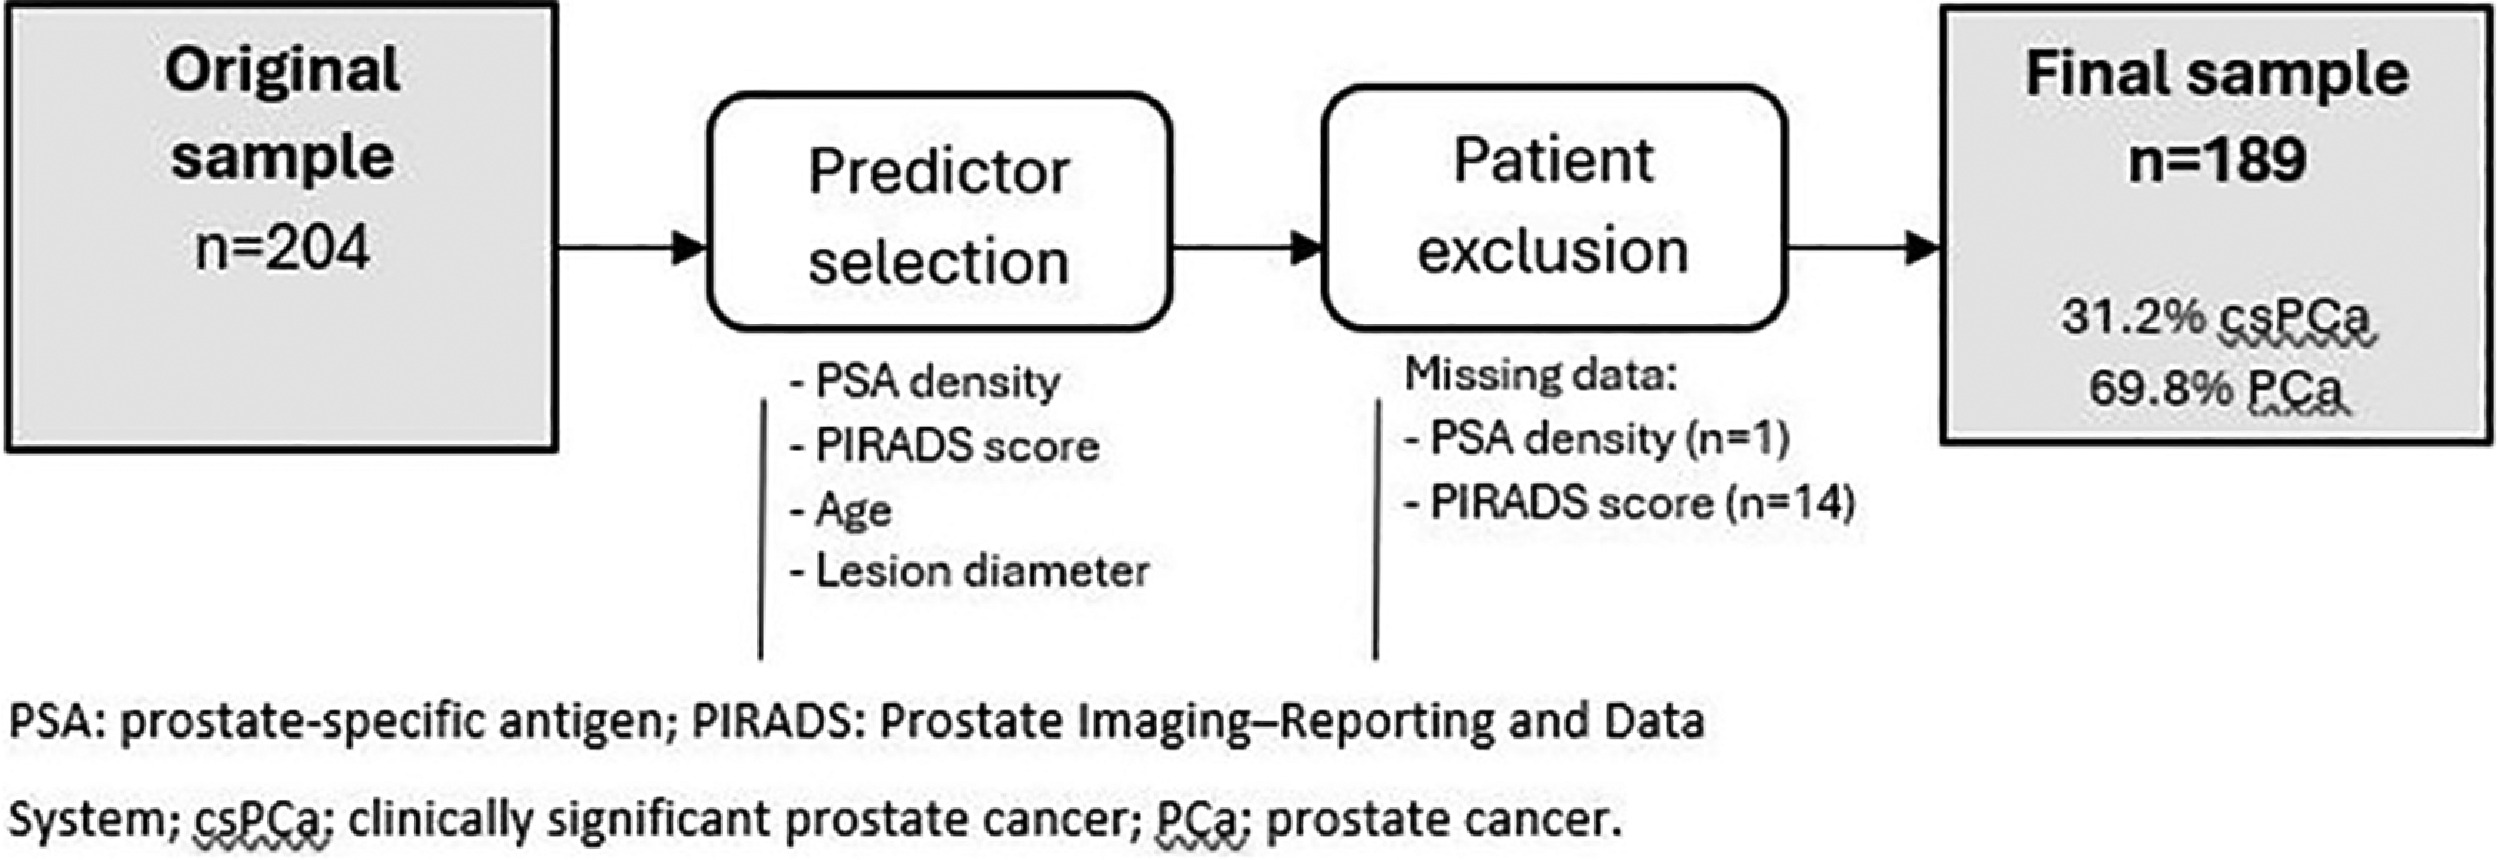
In this study, we developed prediction models through observational and retrospective review of computerised medical records. We included 204 patients who underwent prostate biopsy using elastic software-assisted fusion of transrectal ultrasound (TRUS) and magnetic resonance imaging (MRI) with the Koelis® Trinity system at Araba University Hospital between 2018 and 2021. From the original sample, we assessed the predicting variables of PCa and csPCa. Finally, to evaluate the performance of the prediction models in our sample,patients lacking information on the predictors were excluded.
The statistical analysis was carried out in collaboration with the Statistics Unit at Bioaraba Health Research Institute. We carried out a descriptive analysis of the entire sample of patients included in the study and a comparative analysis of the main demographic, clinical, analytical and radiological characteristics of patients diagnosed with PCa and csPCa. Next, univariate and multivariate logistic regression models were built for the detection of PCa and csPCa considering the overall biopsy result (the combination of targeted and systematic sampling). A random forest analysis was performed to identify the variables most closely associated with the development of a given outcome event by creating multiple decision trees combined to form a final model capable of predicting the dependent variable. In our study, 5,000 trees were constructed by combining 5 of the variables found to be statistically significant in the univariate analysis.
Then, 3 prediction models were built in the form of predictive scores. The quantitative variables included were categorised using the cut-off points with the best performance in the sample. In accordance with the Prognosis Research Strategy (PROGRESS) recommendations, the discrimination of our prediction model was evaluated by measuring the area under the receiver operating characteristic (ROC) curve and its calibration using calibration tables and graphs, as well as calculating sensitivity, specificity, and positive and negative predictive values (PPV and NPV respectively). Cut-off points for indicating biopsy were set to create score-based risk groups.
Finally, we performed a narrative review of prediction models for prostate cancer including radiological parameters and targeted sampling of suspicious lesions. We summarised the information retrieved concerning the type of prediction model, target population, biopsy technique, variables included, observed AUC and predicted outcome in a table, to facilitate comparison of our prediction models with previously reported models in this field.
Clinically significant prostate cancer (csPCa) is defined as prostate cancer with an International Society for Urological Pathology (ISUP) grade ≥2.
Results
Our sample includes 204 patients who underwent MRI/TRUS elastic fusion prostate biopsy using the Koelis® Trinity system. After identifying the predictors of PCa and csPCa in the original sample, 15 patients lacked some information on the predictors and were excluded from the assessment of the model performance. Fig. 1 describes the flow of patients through the predictive modelling study. Table 1 summarises the patients’ clinical, biochemical and radiological characteristics, as well as the overall outcomes of the biopsy.
| Clinical, biochemical and radiological characteristics | N | n (%) / mean (SD) |
|---|---|---|
| Age (years) | 204 | 66.8 (7.88) |
| Family history of PCa | 167 | 41 (25%) |
| History of prostatitis | 59 | 16 (27%) |
| Treated lower urinary tract symptoms | 204 | 77 (38%) |
| 5-alpha-reductase inhibitor therapy | 204 | 13 (6.4%) |
| History of prostate surgery | 204 | 17 (8.3%) |
| History of prostate biopsy | 204 | 165 (81%) |
| Previous diagnosis of atypical small acinar proliferation | 204 | 15 (9.3%) |
| Previous diagnosis of PCa under active surveillance | 204 | 18 (11%) |
| Suspicious findings on rectal examination | 204 | 34 (17%) |
| Adjusted PSA (ng/ml) | 204 | 9.73 (7.04) |
| PSA ≥10 ng/ml | 204 | 61 (30%) |
| PSA ≥20 ng/ml | 204 | 15 (7.4%) |
| Free/total PSA ratio (%) | 139 | 0.18 (0.08) |
| PSA density | 203 | 0.20 (0.16) |
| PSA density ≥0.15 | 203 | 108 (53%) |
| PSA density ≥0.20 | 203 | 69 (34%) |
| MRI prostate volume (ml) | 203 | 53.91 (28.86) |
| PIRADS score (IL) | 190 | |
| 3 | 41 (21.1%) | |
| 4 | 109 (57%) | |
| 5 | 40 (21%) | |
| Laterality of suspected lesions | 184 | |
| Left | 70 (38%) | |
| Right | 68 (37%) | |
| Bilateral | 46 (25%) | |
| Craniocaudal distribution (IL) | 162 | |
| Base | 50 (31%) | |
| Middle | 41 (25%) | |
| Apex | 71 (44%) | |
| Location (IL) | 168 | |
| Transitional zone | 25 (15%) | |
| Peripheral zone | 142 (85%) | |
| Both | 1 (0.6%) | |
| Number of lesions biopsied | 204 | |
| 0 | 13 (2.9%) | |
| 1 | 147 (72.1%) | |
| 2 | 34 (16.7%) | |
| 3 | 10 (4.9%) | |
| Maximum diameter (IL) (mm) | 204 | 12.84 (9.28) |
| Diameter >1 cm | 204 | 113 (55%) |
| Biopsy outcome variables | ||
| Cores taken | 204 | 20.23 (3.98%) |
| Positive cores | 204 | 3.42 (3.65%) |
| Pathological findings | 204 | |
| No pathological findings | 62 (30.5%) | |
| Atypical small acinar proliferation | 4 (2%) | |
| Cancer | 138 (67.5%) | |
| International Society for Urological Pathology grade | 204 | |
| 1 | 78 (57%) | |
| 2 | 30 (33%) | |
| 3 | 22 (16%) | |
| 4 | 5 (3.6%) | |
| 5 | 3 (2.2%) | |
| Cancer | 204 | 138 (68%) |
| Clinically significant cancer | 204 | 60 (29%) |
The free/total PSA ratio was only available for 139 patients (68.1%) as the laboratory at Araba University Hospital only measures this parameter when the total PSA level is between 2 and 10 ng/ml. Regarding radiological characteristics, prostate volume data were missing for 1 patient (0.4%), and hence, it was not possible to calculate PSA density in this case. Of the 204 patients included in the study, 190 had suspicious lesions on MRI categorised according to the Prostate Imaging-Reporting and Data System (PIRADS) score.
The results of univariate and multivariate logistic regression for the detection of PCa or csPCa when considering the overall biopsy findings are presented in Table 2 .
| Demographic characteristics | Clinically significant cancer | Cancer | |||
|---|---|---|---|---|---|
| Univariate regression | |||||
| n | Odds ratio (95% CI) | P -value | Odds ratio (95% CI) | P -value | |
| Age (years) | 204 | 1.05 (1.01-1.10) | 0.012 | 1.08 (1.04-1.12) | <0.001 |
| Age ≥70 years | 204 | 1.84 (1.00-3.39) | 0.051 | 2.44 (1.31-4.71) | 0.006 |
| History of prostatitis | 59 | 1.55 (0.44-5.18) | 0.48 | 0.25 (1.31-4.71) | 0.033 |
| Treated lower urinary tract symptoms | 204 | 0.76 (0.40-1.42) | 0.40 | 0.56 (0.31-1.03) | 0.061 |
| History of prostate surgery | 204 | 1.00 (0.31-2.84) | >0.99 | 2.37 (0.74-10.6) | 0.19 |
| History of prostate biopsy | 204 | 1.08 (0.51-2.41) | 0.85 | 0.57 (0.24-1.24) | 0.17 |
| Suspicious findings on rectal examination | 204 | 1.00 (0.43-2.19) | >0.99 | 2.05 (0.88-5.36) | 0.11 |
| PSA (adjusted for 5ARI therapy) (ng/ml) | 204 | 1.07 (1.03-1.12) | 0.002 | 1.08 (1.02-1.16) | 0.012 |
| PSA ≥10 ng/ml | 204 | 2.65 (1.40-5.03) | 0.003 | 1.92 (0.98-3.92) | 0.063 |
| PSA ≥20 ng/ml | 204 | 4.06 (1.39-12.6) | 0.011 | 3.33 (0.88- 21.7) | 0.12 |
| Free/total PSA ratio (%) | 139 | 0.01 (0.00-1.06) | 0.064 | 0.00 (0.00-0.07) | 0.002 |
| PSA density (ng/ml 2 ) | 203 | 39.0 (5.16-377) | <0.001 | 915 (34.3-45.13) | <0.001 |
| PSA density ≥0.20 (ng/ml 2 ) | 203 | 2.51 (1.34-4.73) | 0.004 | 1.97 (1.04-3.90) | 0.044 |
| MRI prostate volume (ml) | 203 | 0.99 (0.97-1.00) | 0.030 | 0.98 (0.97-0.99) | <0.001 |
| PIRADS score (3-4-5) | 190 | 4.29 (2.47-7.91) | <0.001 | 4.24 (2.49-7.71) | <0.001 |
| Pooled PIRADS (3 vs 4/5) | 190 | 7.85 (2.68-33.5) | <0.001 | 5.71 (2.76-12.2) | <0.001 |
| Maximum diameter of index lesion (mm) | 204 | 1.04 (1.01-1.08) | 0.027 | 1.09 (1.04-1.15) | <0.001 |
| Number of suspicious lesions | 191 | 0.52 (0.25-0.97) | 0.056 | 1.12 (0.65-2.05) | 0.69 |
| Multivariate regression | |||||
| Age ≥70 years | 204 | 3.52 (1.61-8.25) | 0.001 | ||
| Treated lower urinary tract symptoms | 204 | ||||
| PSA (adjusted for 5ARI therapy) (ng/ml) | 204 | ||||
| PSA ≥10 ng/ml | 204 | ||||
| PSA ≥20 ng/ml | 204 | ||||
| PSA density (ng/ml 2 ) | 203 | ||||
| PSA density ≥0.15 (ng/ml 2 ) | 203 | 2.87 (1.27-6.73) | 0.011 | ||
| MRI prostate volume (ml) | 203 | 0.97 (0.96-0.99) | <0.001 | ||
| PIRADS score (3-4-5) | 190 | ||||
| Pooled PIRADS score (3 vs. 4/5) | 190 | 5.53 (2.50-12.6) | <0.001 | ||
| Maximum diameter of index lesion (mm) | 204 | 1.17 (1.05-1.33) | 0.003 | ||
| Number of suspicious lesions | 191 | 0.32 (0.13-0.72) | 0.005 |
Related posts:
 Tumor involvement of the trigone and urethra at the time of robot-assisted radical cystectomy is associated with adverse oncological outcomes
 Understanding the microbiome as a mediator of bladder cancer progression and therapeutic response
 5α-reductase inhibitors with or without alpha-blockers and risk of incident upper tract urothelial carcinoma in men with benign prostatic hyperplasia: Analysis of US insurance claims data
 The use of nephron-sparing intervention does not appear to be compromised after a period of active surveillance for patients with cT1 renal masses
 Causal relationship between bladder cancer and gut microbiota contributes to the gut-bladder axis: A two-sample Mendelian randomization study
 Rethinking the definition of stage III disease in adrenocortical carcinoma: Assessing the impact of clinical lymph node positive disease
Stay updated, free articles. Join our Telegram channel

Full access? Get Clinical Tree


