Highlights
- •
The addition of androgen receptor signaling inhibitors (ARSIs) to androgen deprivation therapy (ADT), known as ARSI doublet therapy, has shown a significant impact on PSA dynamics and oncological outcomes in metastatic castration-sensitive prostate cancer (mCSPC) patients.
- •
Our study analyzed PSA nadir, PSA response rate, and time to PSA nadir (TTN) as prognostic markers using the largest Japanese mCSPC database.
- •
Achieving a PSA nadir of ≤ 0.02 ng/mL, a PSA response rate of ≥ 99%, and a TTN > 12 months were associated with improved survival outcomes.
- •
ARSI doublet therapy was found to induce deeper and faster PSA responses compared to combined androgen blockade (CAB).
Abstract
Background
Androgen receptor signaling inhibitors (ARSIs) have revolutionized the treatment of metastatic castration-sensitive prostate cancer (mCSPC). Prostate-specific antigen (PSA) dynamics, including PSA nadir, PSA response rate, and time to PSA nadir (TTN), are well-established markers of disease control. We evaluated the clinical significance of these PSA dynamics using data from a multicenter clinical database for mCSPC patients.
Methods
We conducted a multicenter retrospective study including 552 mCSPC patients treated with ARSI and ADT, and 262 patients treated with combined androgen blockade (CAB). PSA nadir, PSA response rate, and TTN were evaluated using predefined cut-offs. Clinicopathological data were collected and subsequently analyzed using multivariate Cox regression models to investigate impact of the PSA dynamics on oncological outcomes, including castration resistant prostate cancer free survival (CRPCFS), cancer-specific survival (CSS), and overall survival (OS). Propensity score matching (PSM) was used to minimize selection bias and balance baseline characteristics between treatment the groups. The achievement rates of low PSA nadir and high PSA response were then evaluated.
Results
In the ARSI cohort, 36.4% of patients achieved a PSA nadir of ≤ 0.02 ng/mL, and 65.8% attained a PSA response rate of ≥ 99 %. Notably, patients with a PSA nadir of ≤ 0.02 ng/mL, a PSA response rate ≥ 99%, and TTN > 12 months demonstrated significantly improved oncological outcomes. Multivariate analyses confirmed that these PSA dynamics were independent predictors of favorable oncological outcomes. A PSA nadir of ≤ 0.02 ng/mL was as an independent predictor of improved oncological outcomes compared to a nadir of > 0.2 ng/mL (CRPCFS: HR, 0.063; CSS: HR, 0.12; OS: HR, 0.15; P < 0.001). A PSA response rate of ≥ 99% compared to < 95%, also independently predicted more favorable outcomes (CRPCFS: HR, 0.29; CSS: HR, 0.26; OS: HR, 0.30; P < 0.001). Furthermore, a TTN > 12 months was also an independent predictor of improved survival compared to TTN ≤ 3 months (CRPCFS: HR, 0.12; CSS: HR, 0.08; OS: HR, 0.12; P < 0.001). PSM with a 1:1 ratio was associated with significantly higher rates of PSA nadir ≤ 0.02 ng/mL and PSA response rate ≥ 99% in the ARSI doublet group compared to the CAB group.
Conclusions
Our study demonstrates that achieving a PSA nadir ≤ 0.02 ng/mL, a PSA response rate ≥ 99%, and a longer TTN are associated with significantly improved oncological outcomes. Furthermore, we elucidated how PSA dynamics differ between ARSI doublet therapy and CAB, highlighting the distinct characteristics of each. These findings provide valuable clinical information for guiding the management and prognosis of mCSPC in routine clinical practice.
1
Introduction
Androgen receptor signaling inhibitors (ARSIs) have revolutionized the treatment of metastatic castration-sensitive prostate cancer (mCSPC) [ ]. Over the past 2 decades, therapeutic approaches have evolved from androgen deprivation therapy (ADT), monotherapy, or combined androgen blockade (CAB) to the inclusion of ARSIs, chemotherapy, or their combinations based on tumor characteristics [ , ]. Despite the proven efficacy of triplet therapy with ARSI, docetaxel, and ADT, particularly for high-volume mCSPC, current clinical guidelines recommend the addition of ARSI to ADT (ARSI doublet) for mCSPC [ , ].
Prostate-specific antigen (PSA) decline is a well-established marker of disease control in early and advanced stages of prostate cancer. In addition, various aspects of PSA dynamics, including nadir and response rate, have been studied as potential prognostic markers in mCSPC. For instance, the SWOG9346 trial stratified mCSPC patients treated with ADT monotherapy based on PSA nadir levels (≤ 0.2 ng/mL vs. > 0.2 to 4 ng/mL vs. > 4 ng/mL) and evaluated their relationship with overall survival (OS) [ ]. In the trial, patients with a PSA nadir of ≤ 0.2 ng/mL had less than one-fifth the risk of death compared to those with PSA nadir of > 4 ng/mL and demonstrated significantly improved survival compared to patients with PSA nadir of >0.2 to 4 ng/mL. Recently, a post hoc analysis of the TITAN trial identified a PSA nadir of 0.02 ng/mL and revealed its association with favorable OS [ ]. Furthermore, post hoc analyses of the TITAN, PROSPER, and SPARTAN trials have demonstrated that PSA response rate is a significant predictor of OS [ ].
Despite promising findings from post hoc analyses of randomized controlled trials (RCTs) on the prognostic value of PSA dynamics in mCSPC [ ], real-world data validating these results remain limited. Therefore, we evaluated the clinical significance of PSA dynamics, including PSA nadir, PSA response rate, and time to PSA nadir (TTN), using a multicenter clinical database of mCSPC patients. Furthermore, we compared the differences in PSA dynamics between ARSI doublet therapy and CAB, investigating the unique characteristics of ARSI doublet.
2
Patients and methods
2.1
Patients
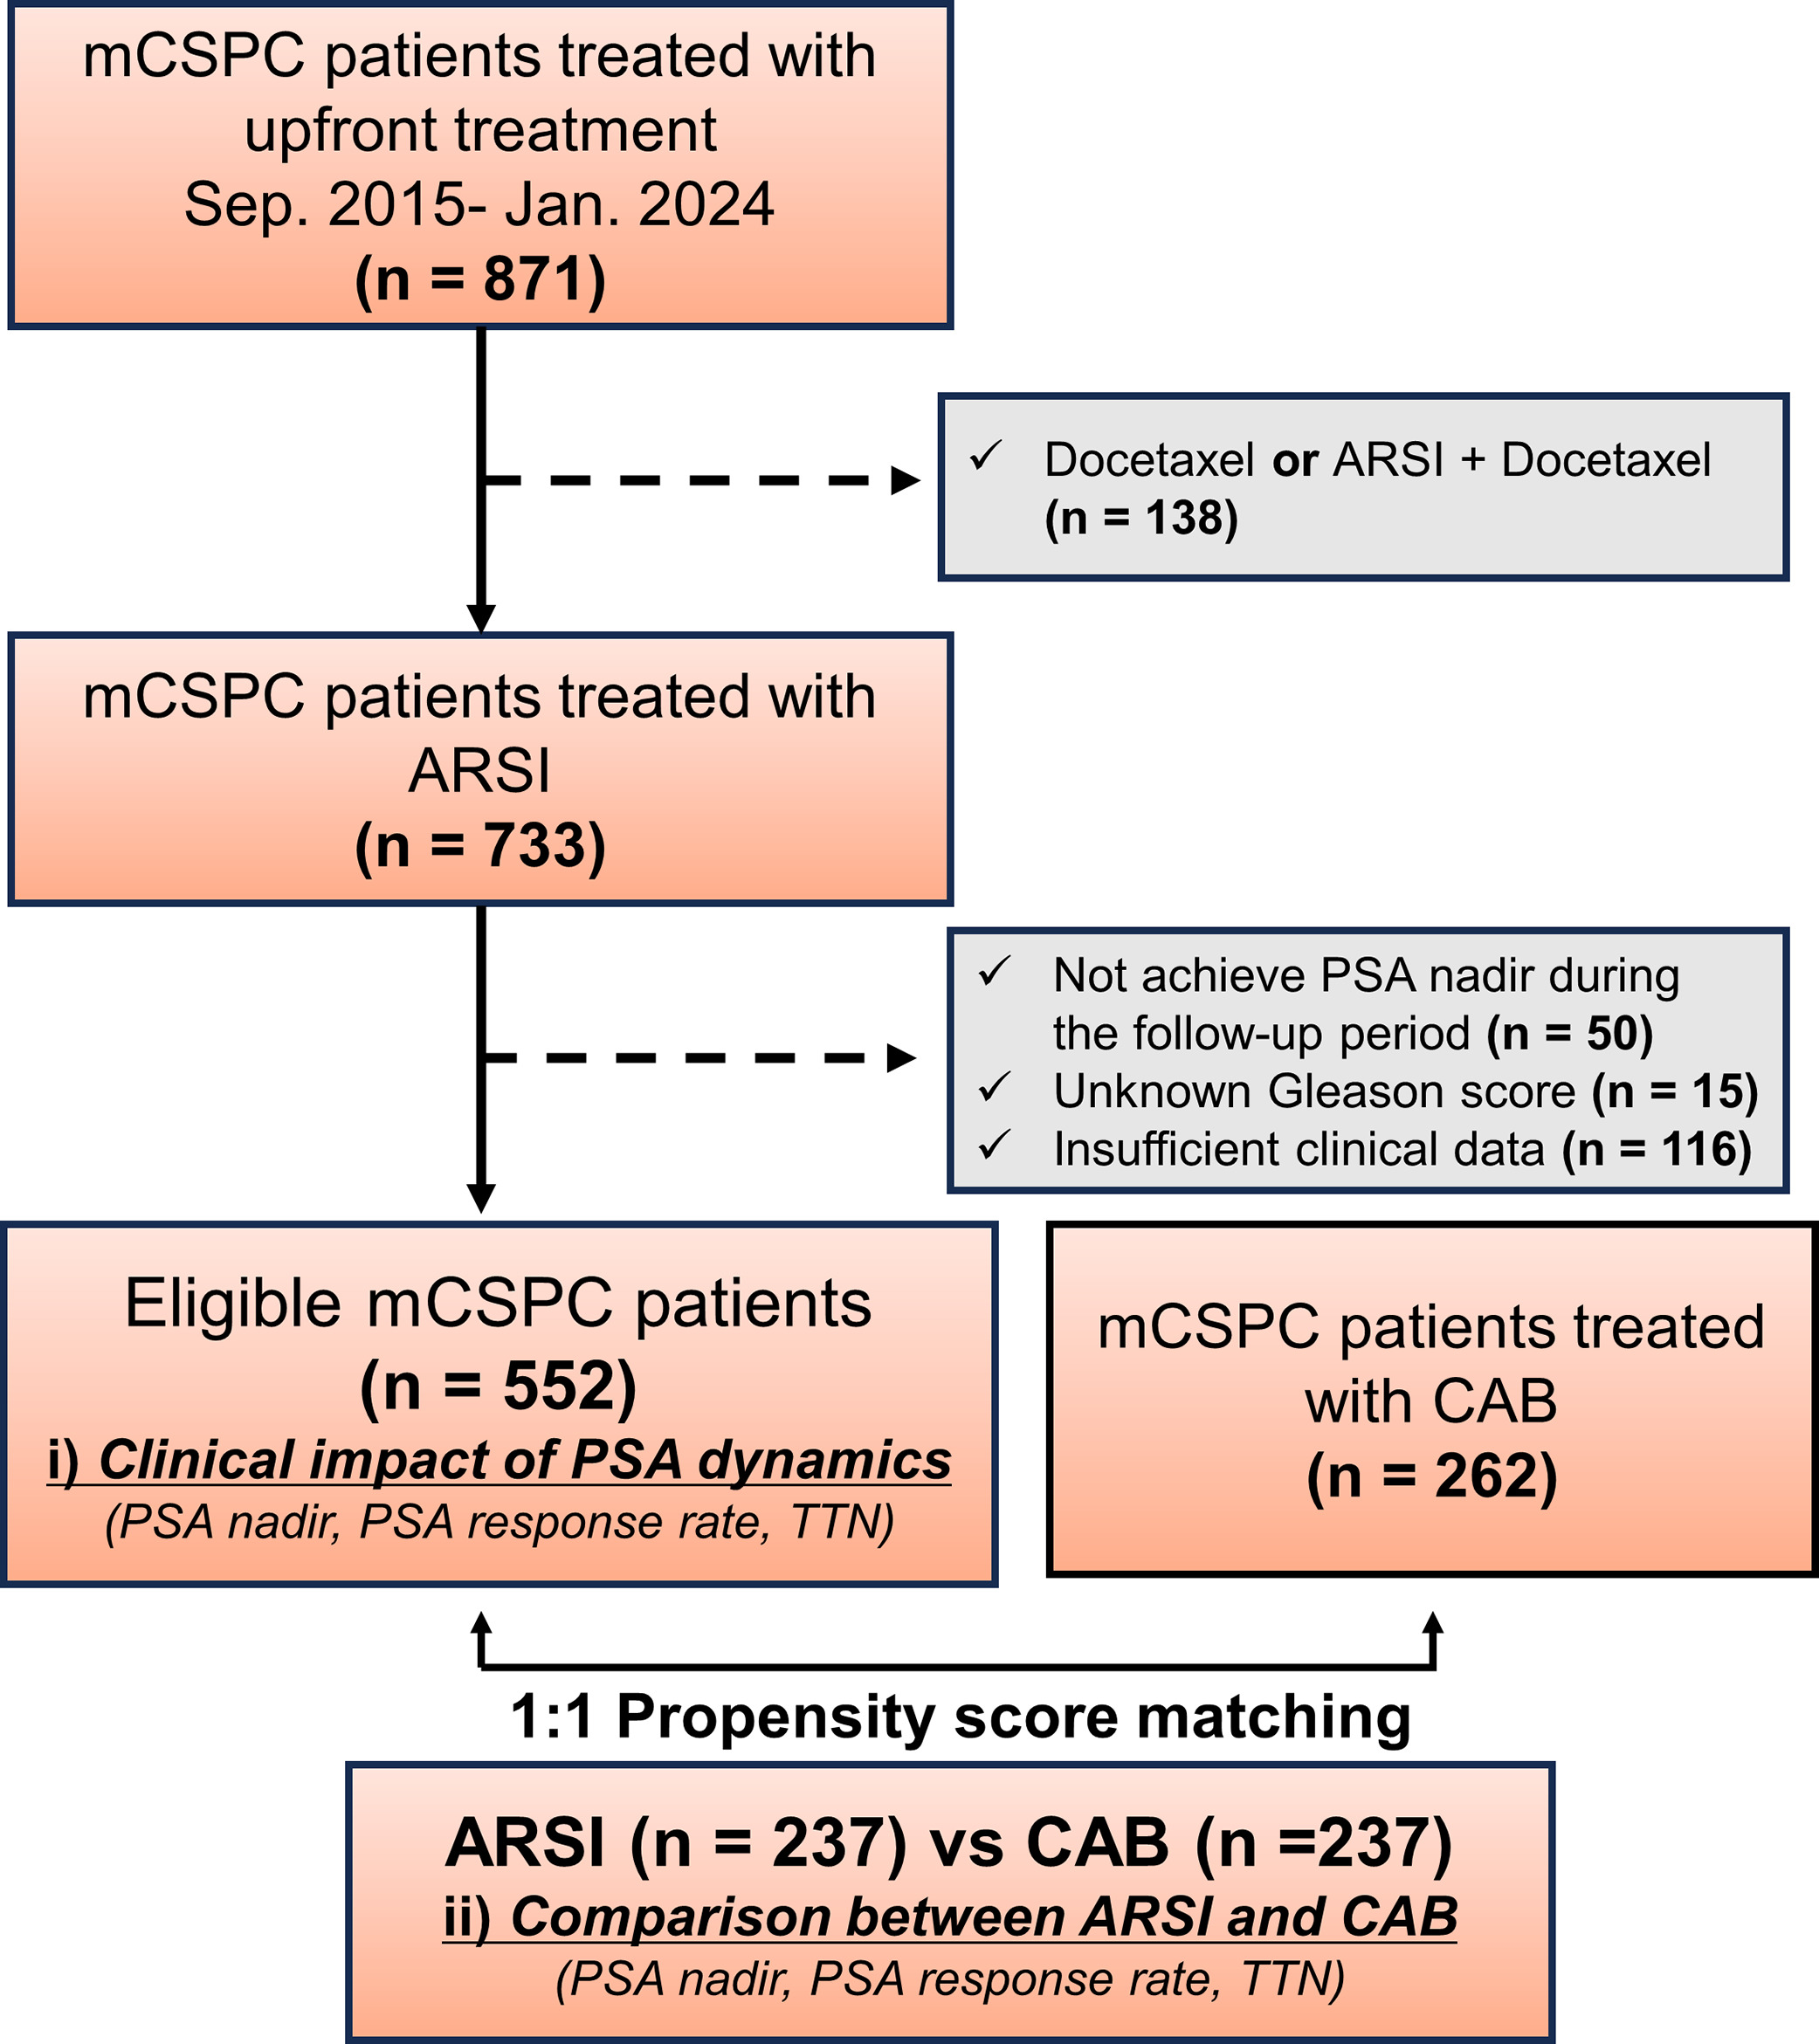
This multicenter, retrospective study included consecutive de novo mCSPC patients who received ARSIs combined with ADT or CAB. In the ARSI doublet cohort, we reviewed the medical records of 871 consecutive mCSPC patients treated with ADT and docetaxel or ARSIs at 16 hospitals in Japan between September 2015 and February 2024. Patients who received docetaxel-doublet or docetaxel-triplet therapy ( n = 138), did not achieve PSA nadir during follow-up ( n = 50), did not undergo prostate biopsy ( n = 15), or had incomplete clinical data ( n = 116) were excluded; this resulted in a final cohort of 552 mCSPC patients ( Fig. 1 ). In the CAB cohort, we reviewed the records of 338 mCSPC patients who received CAB treatment at 14 hospitals in Japan. Patients with incomplete clinical data were excluded, leaving a final cohort of 262 mCSPC patients. In both the ARSI doublet and CAB cohorts, no patients received local therapies, such as radical prostatectomy or radiation therapy.
2.2
PSA assessment
PSA nadir was defined as the lowest PSA level recorded during the treatment course. PSA response rate was assessed based on the percentage reduction in PSA from baseline (at diagnosis of mCSPC) at 3 months after induction of an initial therapy. TTN was calculated as the time between treatment commencement and the lowest recorded PSA value. We used PSA cutoffs of ≤ 0.02, > 0.02 to 0.2, and > 0.2 ng/mL based on the ultra-low cut-off derived from post hoc analysis of the TITAN trial data [ ]. For PSA response rate analyses, we assessed cutoff declines from baseline of ≥ 99% vs. < 99% and ≥ 95% vs. < 95%. In addition, for TTN, we evaluated time intervals of ≤ 3, > 3 to 6, > 6 to 12, and > 12 months.
2.3
Clinicopathologic data and study outcomes
Data on demographics, clinicopathological characteristics, treatment strategies, and follow-up results were collected for mCSPC patients. LATITUDE high-risk was defined as the presence of at least 2 of the following 3 factors: Gleason score (GS) ≥ 8, 3 or more lesions in a bone scan, and measurable visceral metastases [ ]. Similarly, CHAARTED high-volume was defined as the presence of 4 or more bone metastases with at least 1 being outside the axial skeleton (vertebral column or spine) or the presence of visceral metastases [ ]. PSA levels were measured at baseline, monthly during the first year, and at least every 1–3 months thereafter.
2.4
Statistical analysis
Firstly, we investigate the relationship between PSA dynamics (PSA nadir, PSA response rate, and TTN) and oncological outcomes in patients treated with ARSI. Then we also evaluate the impact of ARSI doublet on PSA dynamics in comparison to CAB. Castrate-resistant prostate cancer (CRPC) was defined according to the European Association of Urology guidelines as either: biochemical progression consisting of three consecutive increases in the prostate-specific antigen (PSA) concentration 1 week apart, with two 50% increases over the nadir and a PSA level > 2 ng/mL, or radiological progression characterized by new lesions in a bone scan or new soft tissue lesions according to the Response Evaluation Criteria in Solid Tumors (RECIST, 14). CRPC-free survival (CRPCFS) was defined as the duration from initial therapy to the CRPC diagnosis. Cancer specific survival (CSS) was defined as the duration from initial therapy to death from prostate cancer. Overall survival (OS) was defined as the duration from initial therapy to death from any cause. Because of the retrospective nature of this study and the lack of a uniform treatment protocol, follow-up procedures varied; typically, computed tomography or bone scans were conducted every 6–12 months based on the patient’s condition. Continuous parametric variables are presented as median and interquartile range (IQR). Categorical variables were analyzed using the chi-square test to assess associations between histological subtypes and clinicopathological characteristics; for continuous non-parametric variables, the Kruskal–Wallis test was used. Survival distributions were estimated using the Kaplan– Meier method. The log-rank test assessed differences in survival between treatment groups. Further analyses were conducted using a multivariate Cox regression model; this model yielded hazard ratios (HRs) and their corresponding 95% confidence intervals (CIs) to estimate the independent effect of each variable on survival after adjusting for initial PSA, age at mCSPC diagnosis, Eastern Cooperative Oncology Group (ECOG) performance status (PS), GS, and LATTITUDE criteria.
We used propensity score matching (PSM) to account for potential imbalances in baseline patient characteristics between the 2 groups. Six well-established prognostic factors, including age, ECOG-PS, initial PSA, biopsy GS, extent of disease (EOD) score, and LATTITUDE criteria, were selected for propensity score calculation. Propensity scores were generated using logistic regression modeling. Subsequently, PSM analysis was performed using a 1:1 greedy matching algorithm with a caliper width of 0.2. P-values < 0.05 were considered statistically significant. All statistical analyses were performed using Stata software version 13.1 (StataCorp LP, College Station, TX, USA) and R software (R Foundation for Statistical Computing, Vienna, Austria).
3
Results
3.1
Patient demographics
In total, 552 patients were included in the ARSI doublet cohort. The median age was 73 (IQR: 69–78) years, and the median follow-up was 24 (IQR: 14–36) months ( Table 1 ). The median initial PSA at diagnosis of mCSPC was 262.5 (IQR: 69.4–733.8) ng/mL. Regarding treatment distribution, 286 (51.8%) patients received abiraterone acetate, 122 (22.1%) received enzalutamide, and 143 (26.1%) received apalutamide.
| Variables | Total | PSA nadir ≤ 0.02 ng/mL | PSA nadir > 0.02 to 0.2 ng/mL | PSA nadir > 0.2 ng/mL | P -value |
|---|---|---|---|---|---|
| No of Patients | 552 | 201 | 162 | 189 | |
| Follow-up duration (month) median (IQR) | 24 (14–36) | 28 (19–41) | 27 (14–39) | 18 (12–29) | 0.413 |
| Age (year), median (IQR) | 73 (69–78) | 71 (67–77) | 73 (69–77) | 74 (70–79) | 0.302 |
| ECOG-PS, n (%) | |||||
| 0–1 | 512 (92.8) | 193 (96.0) | 154 (95.1) | 165 (87.3) | 0.002 |
| ≥ 2 | 40 (7.3) | 8 (4.0) | 8 (4.9) | 24 (12.7) | |
| Baseline PSA level (ng/mL), median (IQR) | 262.5 (69.4–733.8) | 126.9 (38.1–371.5) | 282.3 (65.3–821) | 466.8 (184–1188) | < 0.001 |
| PSA nadir (ng/mL), median (IQR) | 0.07 (0.01–0.73) | 0.008 (0.003–0.01) | 0.075 (0.03–0.11) | 1.9 (0.63–8.5) | < 0.001 |
| PSA response rate (%), n (%) | |||||
| ≥95, <99 | 102 (18.5) | 18 (9.0) | 30 (18.5) | 54 (28.6) | < 0.001 |
| ≥99 | 363 (65.8) | 170 (84.6) | 118 (72.8) | 75 (39.7) | |
| Gleason score, n (%) | |||||
| ≤7 | 25 (4.5) | 10 (5.0) | 6 (3.7) | 9 (4.8) | 0.018 |
| 8 | 170 (30.8) | 76 (37.8) | 44 (27.2) | 50 (26.5) | |
| 9 | 289 (52.4) | 100 (49.8) | 93 (57.4) | 96 (50.8) | |
| 10 | 68 (12.3) | 15 (7.5) | 19 (11.7) | 34 (18.0) | |
| Extent of disease, n (%) | |||||
| Bone | 511 (92.6) | 181 (90.1) | 147 (90.7) | 183 (96.8) | 0.022 |
| Lung | 112 (20.3) | 50 (24.9) | 33 (20.4) | 29 (15.3) | 0.065 |
| Liver | 12 (2.2) | 5 (2.5) | 1 (0.6) | 6 (3.2) | 0.24 |
| Lymph node | 310 (56.2) | 97 (48.3) | 87 (53.7) | 126 (66.7) | 0.001 |
| EOD score, n (%) | |||||
| 0–1 | 182 (33.0) | 91 (45.3) | 57 (35.2) | 34 (18.0) | < 0.001 |
| 2 | 143 (25.9) | 53 (26.4) | 47 (29.0) | 43 (22.8) | |
| 3 | 187 (33.9) | 51 (25.4) | 47 (29.0) | 89 (47.1) | |
| 4 | 40 (7.3) | 6 (3.0) | 11 (6.8) | 23 (12.2) | |
| CHAARTED Criteria, n (%) | |||||
| High-volume | 454 (82.3) | 158 (78.6) | 126 (77.8) | 170 (90.0) | 0.003 |
| Low-volume | 98 (17.8) | 43 (21.4) | 36 (22.2) | 19 (10.1) | |
| LATTITUDE Criteria, n (%) | |||||
| High-risk | 482 (87.3) | 166 (82.6) | 140 (86.4) | 176 (93.1) | 0.007 |
| Low-risk | 70 (12.7) | 35 (17.4) | 22 (13.6) | 13 (6.9) | |
| ARSI, n (%) | |||||
| Abiraterone | 286 (51.8) | 116 (57.7) | 80 (49.4) | 90 (47.6) | 0.157 |
| Enzalutamide | 122 (22.1) | 44 (21.9) | 36 (22.2) | 42 (22.2) | |
| Apalutamide | 144 (26.1) | 41 (20.4) | 46 (28.4) | 57 (30.2) |
Related posts:
 Tumor involvement of the trigone and urethra at the time of robot-assisted radical cystectomy is associated with adverse oncological outcomes
 Understanding the microbiome as a mediator of bladder cancer progression and therapeutic response
 5α-reductase inhibitors with or without alpha-blockers and risk of incident upper tract urothelial carcinoma in men with benign prostatic hyperplasia: Analysis of US insurance claims data
 The use of nephron-sparing intervention does not appear to be compromised after a period of active surveillance for patients with cT1 renal masses
 Causal relationship between bladder cancer and gut microbiota contributes to the gut-bladder axis: A two-sample Mendelian randomization study
 Rethinking the definition of stage III disease in adrenocortical carcinoma: Assessing the impact of clinical lymph node positive disease
Stay updated, free articles. Join our Telegram channel

Full access? Get Clinical Tree


