Highlights
- •
E-cigarette users are less likely to undergo PSA screening than never-smokers and tobacco smokers.
- •
This pattern of PSA screening utilization among e-cigarette users may be attributed to their reduced use of primary care services.
- •
No significant difference in PSA screening was detected between never-smokers and tobacco smokers.
Abstract
Introduction and objectives
E-cigarettes use has recently increased, even among older individuals quitting smoking. Though past studies suggest tobacco smokers may avoid cancer screening, the relationship between e-cigarette uses and preventive health behaviors like prostate specific antigen screening is uncertain. We assessed the relationship between self-reported e-cigarette smoking and prostate specific antigen screening utilization among US adults with a history of e-cigarette use.
Materials and methods
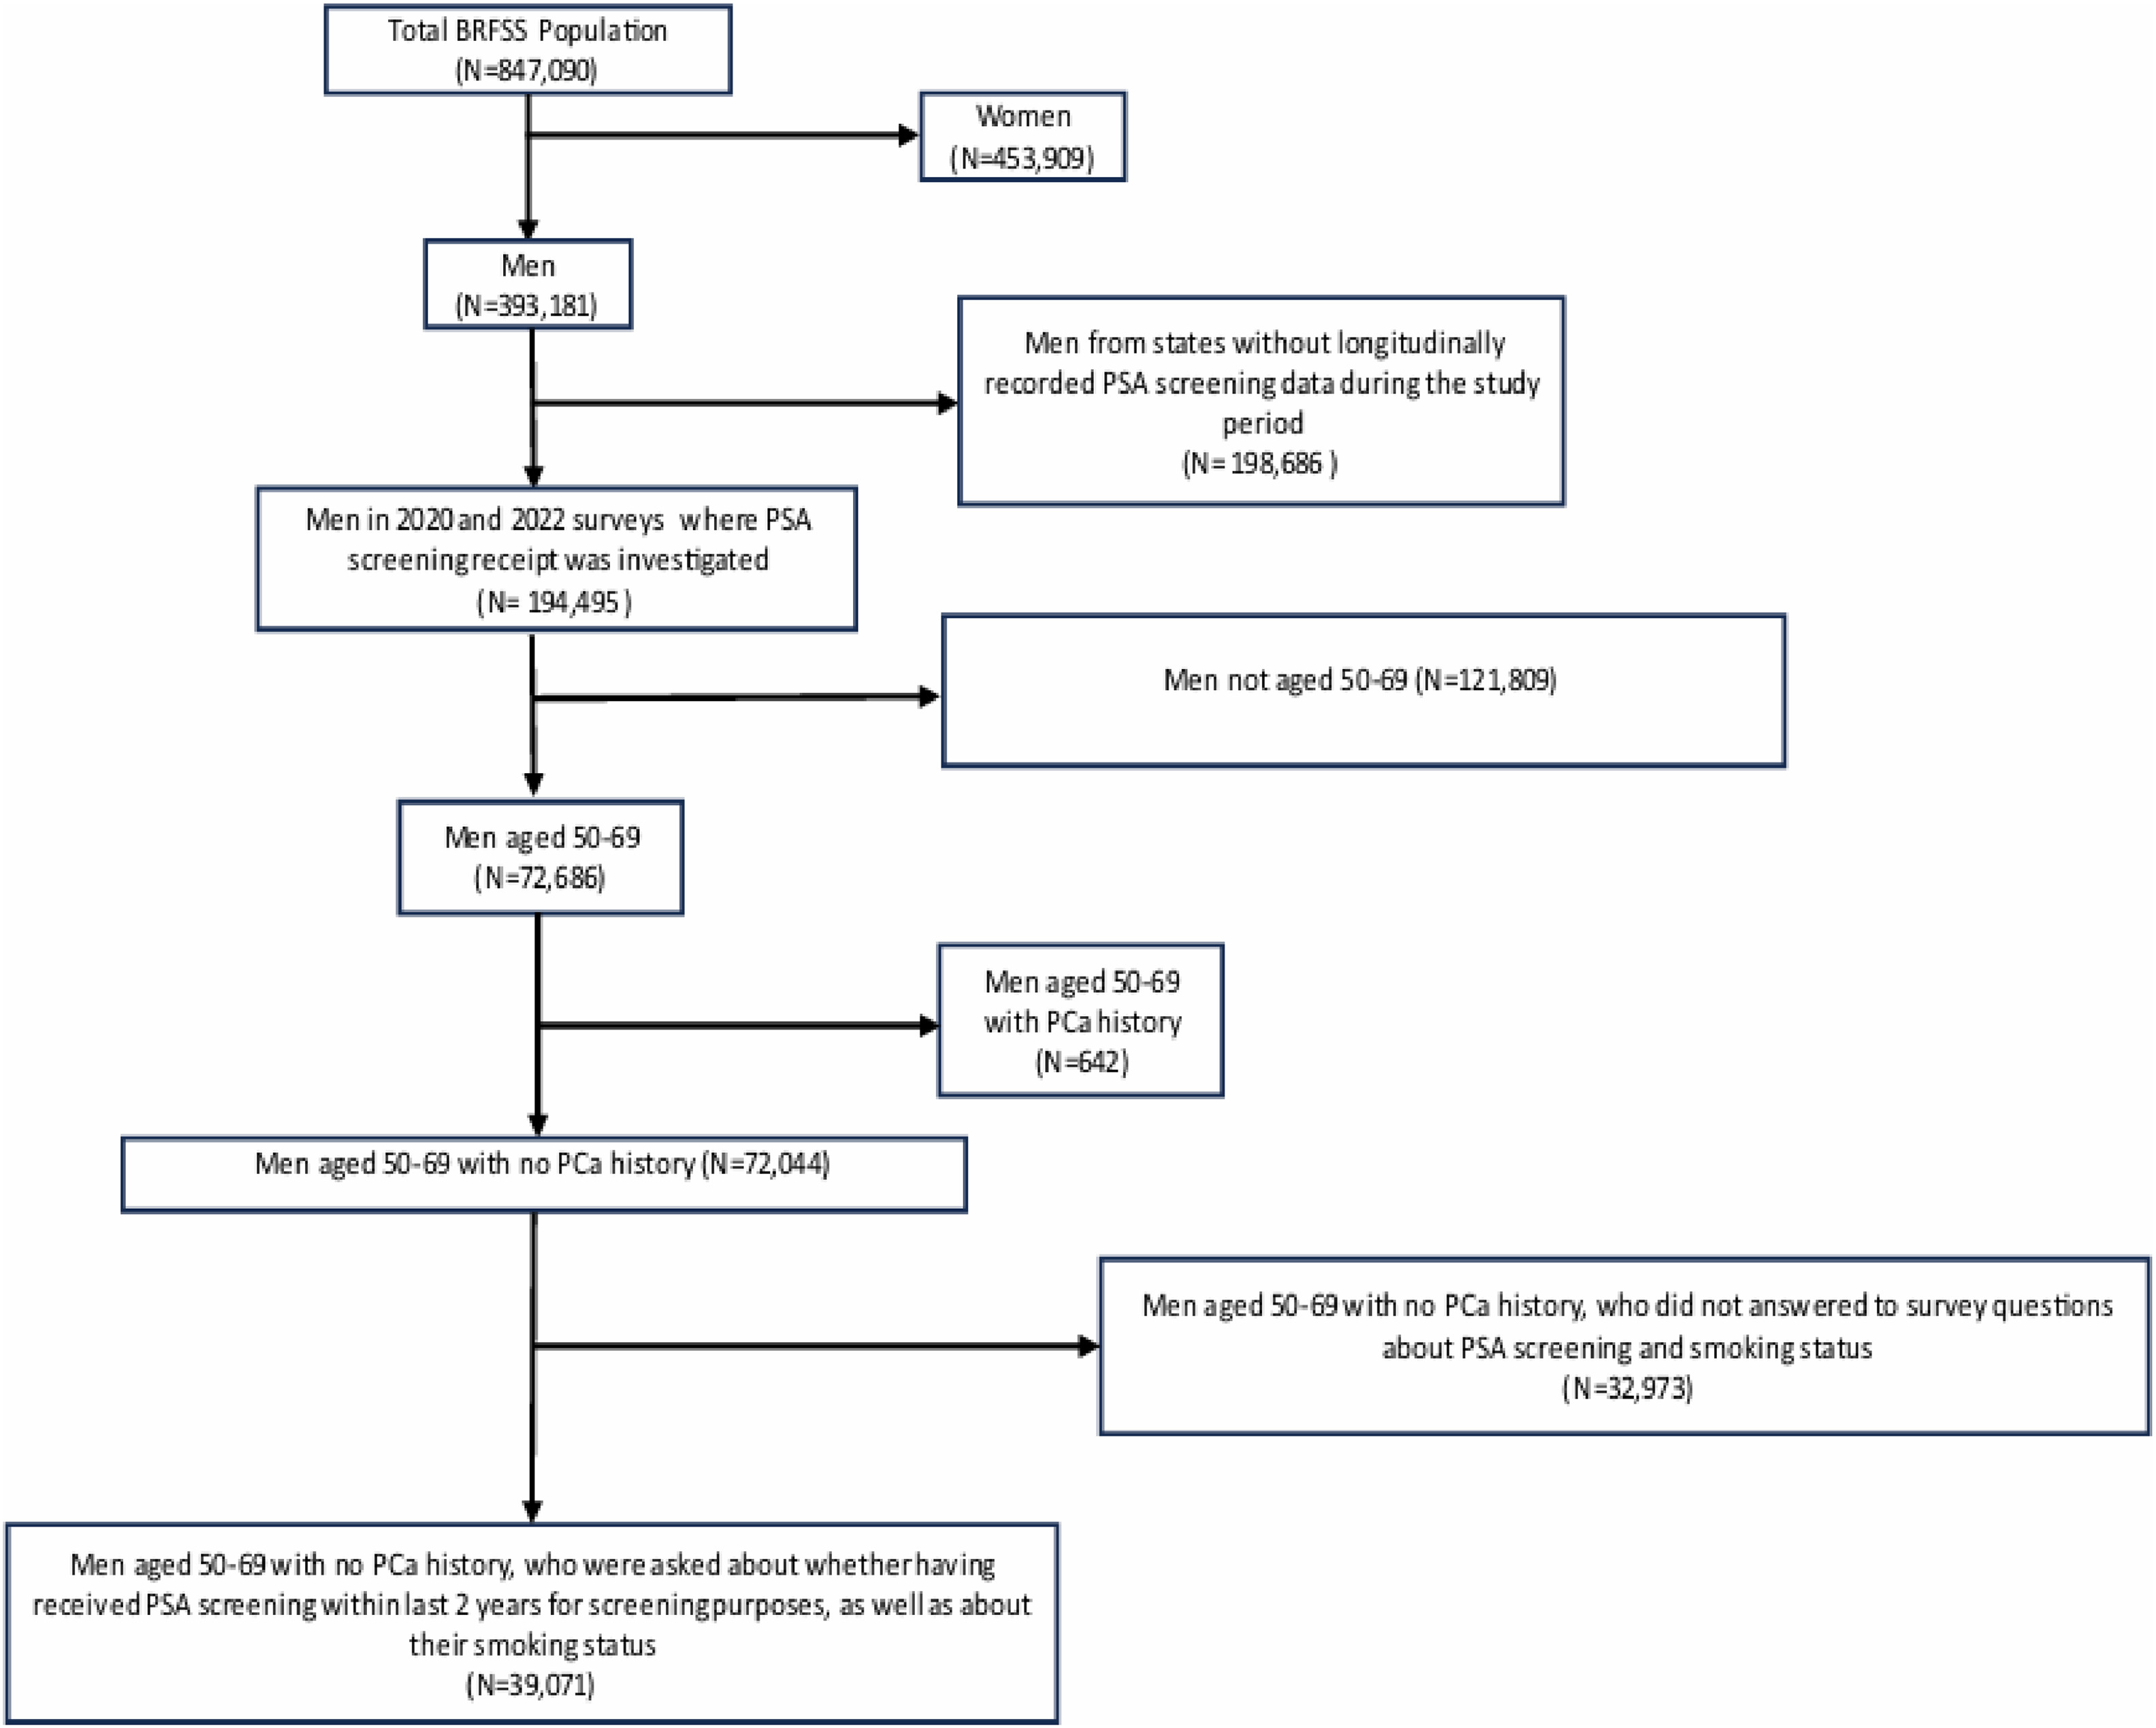
We included men aged 50–69 years, who provided responses regarding PSA screening receipt and smoking status, from Behavioral Risk Factor Surveillance System 2020 and 2022 surveys. Primary outcome was PSA screening receipt. Multivariable regression model was performed to investigate the association between smoking status (never-smokers, current or former e-cigarette smokers, current or former tobacco smokers) and PSA screening.
Results
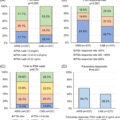
We included a weighted population of 8.1 million men aged 50–69. 2.3 million (28.3%) received PSA screening. 3.9 million (48.2%) were never-smokers. 1.3 million (16.6%) were from e-cigarettes smokers group, and 2.9 million (35.2%) were from tobacco smokers group. E-cigarettes smokers were less likely to receive PSA screening within last 2 years (0.76 [0.66–0.88]) than never-smokers. No significant difference in PSA screening was detected between never-smokers and tobacco smokers (0.91 [0.82–1.02]). E-cigarette smokers were less likely to receive PSA screening within the selected time frame (0.84 [0.72–0.97]) than tobacco smokers. When examining potential mediation by primary care visits, e-cigarette smokers were less likely to have had a check-up visit in past 2 years than tobacco smokers (0.77 [0.65–0.92]).
Conclusions
E-cigarette smokers were less likely to undergo PSA screening than never-smokers and tobacco smokers, possibly due to reduced use of primary care services.
1
Introduction
E-cigarettes have seen a substantial rise in popularity in recent years. There is a reported increase in daily e-cigarette use among recent users, indicating a potential shift towards regular usage [ , ]. In 2021, e-cigarette use in the past 30 days was reported at 4.5% in the National Health Interview Survey (NHIS) and 6.0% in the National Survey on Drug Use and Health (NSDUH) [ ]. E-cigarette use is common in developed countries, with higher rates among younger generations and a modestly increasing prevalence among older adults, often attributed to their perceived role as smoking cessation aids [ , ]. The main concern is the long-term health effects of e-cigarettes, especially their association with cancer risk, given tobacco smoking’s well-established link to cancer of various sites [ , ]. Although quitting smoking is crucial for cancer prevention, enhancing cancer screening programs could greatly benefit smokers by identifying cancers at an earlier stage. Tobacco smokers are less likely to undergo cancer screening and other preventive services, leading to later-stage cancer diagnoses [ , ].
While prior research has extensively explored the screening and other preventive services among tobacco smokers [ ], there remains a lack of evidence concerning the use of preventive health services among e-cigarette smokers. Although men converting to e-cigarette use may be more health-focused (and therefore more likely to use screening) it is also possible that they could assess e-cigarettes as having a lower cancer risk and therefore paradoxically undergo fewer primary care visits and less cancer screening. In this setting we sought to assess the use of prostate specific antigen (PSA) screening in e-cigarette smokers.
2
Methods
2.1
Data source
We analyzed data from the Behavioral Risk Factor Surveillance System (BRFSS) 2020 and 2022 surveys. BRFSS is a national system of health-related telephone-based surveys that collects data about US adult population regarding health-related risk behaviors, chronic health conditions and use of preventive services. Established in 1984, BRFSS collects data in all 50 US states, completing more than 400.000 interviews each year and making it the largest health survey system in the world [ ].
2.2
Study population
For men deemed “average-risk” who choose screening, the recommended age spans from 50 to 55 up to 70 years, with consideration given to their life expectancy. According to the 2022 guidelines of the European Association of Urology, age over 50 years is highlighted as a potential risk factor for prostate cancer (PCa). Therefore, we included men aged 50–69 with no PCa history, who responded to survey questions about whether having received PSA testing for screening purposes within the last 2 years, as well as their smoking status concerning e-cigarettes and tobacco use. Individuals who did not respond to questions about their PSA screening receipt and smoking status were excluded, as were patients who did not provide information on sociodemographic characteristics. Participants from states without longitudinally recorded PSA data during the study period were omitted from the analysis [ , ] [refer to Fig. 1 ].
2.3
Outcomes
Our dichotomous outcome variable defined as whether the respondent received PSA screening within the past 2 years or not. The outcome variable was defined by considering men who underwent a PSA test within the past 2 years (referred to as “psa2yr”) specifically for screening purposes (referred to as “reason_psa”).
2.4
Predictor
Smoking status was our primary predictor variable, which was categorized into 3 groups: Never-smokers, Current and Former e-cigarettes smokers, and Current and Former tobacco smokers. Within the Never-smokers category, we included individuals who had never used either e-cigarettes or tobacco. On the other hand, current and former smokers were both in the tobacco and e-cigarettes smoking categories. Men who declared to use e-cigarettes every day or some days were categorized as current e-cigarettes smokers, whereas those who reported to smoke tobacco every day or some days were categorized as current tobacco smokers. For both e-cigarettes and tobacco smokers, we grouped as former smokers those men who reported to have been either tobacco or e-cigarettes smokers. Regarding current e-cigarettes users who were former users of tobacco; we grouped these under the “Current and Former e-cigarettes smokers” category of the main predictor variable. This approach allowed us to include individuals who, being in their 50s or older, initially started smoking traditional cigarettes before the advent of e-cigarettes (c. 2003) and later took up also e-cigarettes. This was done the vast majority of e-cigarettes users in their 50s–60s at some point had tried combustible cigarettes.
2.5
Covariates
Patient sociodemographic characteristics, such as age, race/ethnicity, annual household income, level of education, marital status, insurance status, employment status, urban/rural status, general health status, and last primary care checkup visit within last 2 years were included in our analyses as covariates. Baseline characteristics of patients are categorized as in Table 1 .
| TOTAL | Not Receiving PSA Screening | Receiving PSA Screening | P -value | ||||
|---|---|---|---|---|---|---|---|
| Est population in millions (%) | 95% CI | Est population in millions (%) | 95% CI | Est population in millions (%) | 95% CI | ||
| Total | 8.1 | 5.8 (71.7%) | 5.7–6.0 | 2.3 (28.3%) | 2.2–2.4 | ||
| Smoking Status | < 0.001 | ||||||
| Never-Smokers | 3.9 (48.2%) | 3.8–4.0 | 2.6 (45.5%) | 2.6–2.8 | 1.3 (55.1%) | 1.2– 1.3 | |
| Current/Former e-cigarettes smokers | 1.3 (16.6%) | 1.3–1.4 | 1.1 (18.4%) | 1.0–1.1 | 0.27 (11.8%) | 0.25–0.30 | |
| Current/Former tobacco smokers | 2.9 (35.2%) | 2.8–3.0 | 2.1 (36.1%) | 2.0–2.2 | 0.76 (33.1%) | 0.71–0.81 | |
| Race | < 0.001 | ||||||
| White Non-Hispanic | 5.8 (71.5%) | 5.7–5.9 | 4.0 (68.9%) | 3.9–4.1 | 1.8 (77.8%) | 1.7–1.9 | |
| Black Non-Hispanic | 1.1 (13.1%) | 1.0–1.1 | 0.79 (13.6%) | 0.7–0.85 | 0.28 (12.1%) | 0.24–0.31 | |
| Hispanic | 0.84 (10.3%) | 0.75–0.93 | 0.69 (11.8%) | 0.6–0.78 | 0.15 (6.5%) | 0.11–0.19 | |
| Other | 0.42 (5.1%) | 0.38–0.45 | 0.33 (5.7%) | 0.3–0.37 | 0.084 (3.6%) | 0.06–0.099 | |
| Education | < 0.001 | ||||||
| Not Graduated at High School | 1.0 (12.4%) | 0.92–1.1 | 0.88 (15.1%) | 0.8–0.97 | 0.12 (5.4%) | 0.09–0.15 | |
| Graduated at High School | 2.4 (29.5%) | 2.3–2.5 | 1.8 (31.5%) | 1.8–1.9 | 0.57 (24.7%) | 0.53–0.61 | |
| Attended College | 2.4 (29.4%) | 2.3–2.5 | 1.7 (28.8%) | 1.6–1.8 | 0.71 (30.8%) | 0.65–0.77 | |
| Postgraduated | 2.3 (28.7%) | 2.3–2.4 | 1.4 (24.6%) | 1.4–1.5 | 0.90 (39.1%) | 0.86–0.94 | |
| Annual Income | < 0.001 | ||||||
| < 10,000 | 0.33 (4.1%) | 0.28–0.39 | 0.29 (5.1%) | 0.2–0.35 | 0.037 (1.6%) | 0.02–0.052 | |
| 10,000–20,000 | 0.82 (10%) | 0.76–0.87 | 0.71 (12.2%) | 0.6–0.76 | 0.11 (4.8%) | 0.091–0.13 | |
| 20,000–35,000 | 1.3 (15.8%) | 1.2–1.4 | 1.0 (17.8%) | 0.9–1.1 | 0.25 (10.8%) | 0.22–0.28 | |
| 35,000–50,000 | 0.94 (11.6%) | 0.88–1.0 | 0.69 (11.8%) | 0.6–0.75 | 0.25 (10.7%) | 0.22–0.27 | |
| 50,000–75,000 | 1.3 (15.8%) | 1.2–1.3 | 0.92 (15.6%) | 0.8–0.97 | 0.37 (15.9%) | 0.34–0.40 | |
| 75,000 or more | 3.5 (42.7%) | 3.4–3.6 | 2.2 (37.5%) | 2.1–2.3 | 1.3 (56.2%) | 1.2–1.4 | |
| Marital Status | < 0.001 | ||||||
| Never Married | 0.74 (9.1%) | 0.69–0.79 | 0.59 (10.1%) | 0.5–0.63 | 0.15 (6.4%) | 0.13–0.17 | |
| Married/Couple | 5.6 (68.3%) | 5.5–5.7 | 3.8 (64.5%) | 3.7–3.9 | 1.8 (78.3%) | 1.7–1.9 | |
| Divorced/Widowed/Separated | 1.8 (22.6%) | 1.8–1.9 | 1.5 (25.4%) | 1.4–1.6 | 0.35 (15.3%) | 0.32–0.38 | |
| Urbanicity | 0.98 | ||||||
| Urban | 7.4 (90.8%) | 7.3–7.6 | 5.3 (90.9%) | 5.2–5.4 | 2.1 (90.8%) | 2.0–2.2 | |
| Rural | 0.74 (9.2%) | 0.71–0.77 | 0.53 (9.1%) | 0.5–0.56 | 0.21 (9.2%) | 0.19–0.23 | |
| Employment Status | < 0.13 | ||||||
| Not Employed | 3.2 (39.5%) | 3.1–3.3 | 2.3 (40.0%) | 2.2–2.4 | 0.88 (38.2%) | 0.82–0.94 | |
| Employed | 4.9 (60.5%) | 4.8–5.0 | 3.5 (60.0%) | 3.4–3.6 | 1.4 (61.8%) | 1.4–1.5 | |
| Health Insurance Status | < 0.001 | ||||||
| No healthcare coverage | 0.81 (9.9%) | 0.74–0.88 | 0.72 (12.4%) | 0.6–0.79 | 0.088 (3.8%) | 0.06–0.110 | |
| Healthcare coverage | 7.3 (90.1%) | 7.2–7.4 | 5.1 (87.6%) | 5.0–5.2 | 2.2 (96.2%) | 2.1–2.3 | |
| General Health Status | < 0.001 | ||||||
| Poor | 0.41 (5.1%) | 0.37–0.45 | 0.36 (6.1%) | 0.3–0.39 | 0.052 (2.2%) | 0.04–0.062 | |
| Fair | 1.1 (13.7%) | 1.0–1.2 | 0.88 (15.1%) | 0.8–0.94 | 0.23 (10.1%) | 0.21–0.26 | |
| Good | 2.6 (31.6%) | 2.5–2.7 | 1.9 (32.3%) | 1.8–2.0 | 0.69 (30.1%) | 0.64–0.74 | |
| Very Good | 2.7 (33.2%) | 2.6–2.8 | 1.8 (30.7%) | 1.7–1.9 | 0.91 (39.4%) | 0.85–0.97 | |
| Excellent | 1.3 (16.4%) | 1.3–1.4 | 0.92 (15.8%) | 0.8–0.97 | 0.42 (18.2%) | 0.39–0.45 | |
| Age Range | < 0.001 | ||||||
| 50–54 years | 2.1 (25.2%) | 2.0–2.1 | 1.6 (29.0%) | 1.6–1.8 | 0.36 (15.7%) | 0.33–0.40 | |
| 55–59 years | 2.0 (25.1%) | 2.0–2.1 | 1.5 (25.6%) | 1.4–1.6 | 0.55 (24.1%) | 0.51–0.60 | |
| 60–64 years | 2.3 (28.3%) | 2.2–2.4 | 1.6 (26.6%) | 1.5–1.6 | 0.75 (32.6%) | 0.70–0.80 | |
| 65–69 years | 1.7 (21.4%) | 1.7–1.8 | 1.1 (18.8%) | 1.0–1.2 | 0.64 (27.6%) | 0.60–0.67 | |
| Last PCP checkup visit within last 2 years | < 0.001 | ||||||
| No | 0.80 (9.8%) | 0.75–0.84 | 0.78 (13.2%) | 0.7–0.81 | 0.031 (1.4%) | 0.023–0.040 | |
| Yes | 7.3 (90.2%) | 7.2–7.4 | 5.0 (86.8%) | 4.9–5.1 | 2.3 (98.6%) | 2.2–2.3 | |
Related posts:
 Tumor involvement of the trigone and urethra at the time of robot-assisted radical cystectomy is associated with adverse oncological outcomes
 Understanding the microbiome as a mediator of bladder cancer progression and therapeutic response
 5α-reductase inhibitors with or without alpha-blockers and risk of incident upper tract urothelial carcinoma in men with benign prostatic hyperplasia: Analysis of US insurance claims data
 The use of nephron-sparing intervention does not appear to be compromised after a period of active surveillance for patients with cT1 renal masses
 Causal relationship between bladder cancer and gut microbiota contributes to the gut-bladder axis: A two-sample Mendelian randomization study
 Clinical significance of PSA dynamics in castration-sensitive prostate cancer treated with ARSI doublet therapy: A multicenter study
Stay updated, free articles. Join our Telegram channel

Full access? Get Clinical Tree


