Highlights
- •
Overweight patients with metastatic renal cell carcinoma had an overall survival advantage following first-line therapies.
- •
Obesity paradox may exist in the contemporary cancer immunotherapy era for metastatic renal cell carcinoma.
- •
BMI can contribute to the development of new prognostic tools for metastatic renal cell carcinoma.
Abstract
Objectives
Higher body mass index (BMI) is reportedly associated with improved prognosis of patients with various cancers. However, it is unclear whether this phenomenon, also known as the obesity paradox, applies to metastatic renal cell carcinoma (mRCC). We aimed to determine the prognostic significance of BMI in patients with mRCC receiving first-line therapies.
Materials and methods
We retrospectively reviewed patients with mRCC receiving first-line immune checkpoint inhibitor (ICI)-based combination therapy or tyrosine kinase inhibitor monotherapy. Overall survival (OS) was defined as the time from systemic therapy initiation to death from any cause or last follow-up. Baseline patient characteristics were compared by Mann–Whitney U test or Fisher’s exact test. OS curves were constructed by Kaplan–Meier estimates and were compared by log-rank test. Multivariable analysis was performed via Cox proportional-hazards regression.
Results
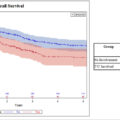
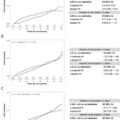
Of the 183 patients included, 130 (71 %) were overweight (≥22 and 18 kg/m 2 in men and women, respectively), and 63 (34 %) received ICI-based combination therapy. There was a significantly higher proportion of men in the overweight subgroup (87 % versus 64 %; P = 0.002). During the study period, 97 patients died, and median (95 % confidence interval) OS was 39.0 months (31.5–66.3 months) and 28.1 months (17.6–39.7 months) in overweight and normoweight patients, respectively ( P = 0.015). On multivariable analysis, overweight was independently associated with longer OS (HR 0.57; P = 0.014). Subgroup analyses of patients receiving ICI-based combination therapy yielded similar results.
Conclusion
Overweight is associated with favorable outcomes in patients with mRCC receiving first-line therapies.
1
Introduction
Renal cell carcinoma (RCC) is the most common form of kidney cancer in adults [ ]. Approximately one-third of RCC cases are diagnosed at an advanced stage, namely, as unresectable or metastatic RCC (mRCC) [ ]. Despite advances in multimodal cancer therapies, the prognosis for patients with mRCC still remains poor, with a 5-year survival rate of only 12 % [ ].
Body mass index (BMI), as calculated from a patient’s height and weight, is a simple measurement of body composition. Higher BMI is reportedly associated with a higher risk of developing RCC but at the same time with better clinical outcomes, which is known as the obesity paradox [ ]. In the era of tyrosine kinase inhibitors (TKIs), higher BMI was identified as a favorable prognostic factor in patients with mRCC, as associated with longer overall survival (OS), cancer specific survival, and progression-free survival from TKI monotherapy initiation [ , ].
With the advent of immune checkpoint inhibitors (ICIs) and a shift in first-line therapies toward ICI-based combinations [ , ], the impact of BMI on prognosis of patients with mRCC needs to be re-examined, given that the relationship between BMI and prognosis of patients with mRCC in the era of ICIs has not yet extensively been studied and that the existence of the obesity paradox remains inconclusive. While some studies supported the existence of obesity paradox [ , ], other studies drew conflicting conclusions [ , ]. Besides, most prior studies have been conducted in Western populations, leaving a gap for Asian populations, whose body composition considerably differs from that of Western populations [ ].
Therefore, we designed this study to explore the relationship between BMI and prognosis of contemporary Japanese patients with mRCC receiving first-line therapies.
2
Materials and methods
2.1
Study design
Medical records of patients with mRCC receiving contemporary first-line therapies between 2009 and 2023 at a single designated cancer hospital were retrospectively reviewed. Eligible patients had been diagnosed with mRCC and received ICI-based combination therapy (nivolumab plus ipilimumab, pembrolizumab plus axitinib, atezolizumab plus bevacizumab, nivolumab plus cabozantinib, and pembrolizumab plus lenvatinib) or TKI monotherapy (sunitinib and pazopanib) in the first-line setting. Patients without available BMI data were excluded.
2.2
Covariate definition
BMI was calculated as follows: BMI = (weight [kg])/(height [m]) 2 , and patients were divided into 2 subgroups, namely, the overweight subgroup (BMI ≥22 and ≥18 kg/m 2 for men and women, respectively) and the normoweight subgroup (BMI <22 and <18 kg/m 2 for men and women, respectively), according to the thresholds derived from the Korea National Health and Nutrition Examination Survey (KNHANES) [ ]. Other clinical variables collected from medical records included age, sex, previous nephrectomy, histology, metastatic sites, the International mRCC Database Consortium (IMDC) risk, and first-line regimens, all of which were included in the multivariable analysis. Histological subtypes of nonclear cell RCC and/or sarcomatoid features were defined as adverse histology. Metastatic sites of brain, bone, and/or liver were defined as adverse metastases. OS was defined as the time from systemic therapy initiation to death from any cause, while all patients who did not have an event by last follow-up were censored.
2.3
Statistical analyses
Baseline clinicopathological factors between the BMI subgroups were compared by Mann–Whitney U test and Fisher’s exact test for respective continuous and categorical variables. OS curves were constructed by Kaplan–Meier estimates and were compared by log-rank test. The multivariable analysis adjusted for age, sex, BMI, previous nephrectomy, histology, metastatic sites, IMDC risk, and first-line regimens. Hazard ratios (HRs) by prognostic factors were estimated by Cox proportional hazards regression. In addition, subgroup analyses were carried out for patients receiving ICI-based combination therapy. Two-tailed P < 0.05 was regarded as significant. All statistical analyses were performed by using R 4.4.0 (R Foundation for Statistical Computing, Vienna, Austria).
3
Results
3.1
Patient characteristics
A total of 200 consecutive patients with mRCC were screened for eligibility, from whom 17 were excluded due to unavailable BMI data. Ultimately, the remaining 183 patients were included in this study. The median (interquartile range [IQR]) age on systemic therapy initiation was 66 years (56–72 years). The cohort predominantly consisted of men ( n = 129; 70 %), and 108 (59 %) received previously nephrectomy. Median (IQR) BMI was 23.0 kg/m 2 (20.6–25.2 kg/m 2 ). The most common histological subtype was clear cell RCC ( n = 148; 82 %), followed by unclassified RCC ( n = 12; 7 %), papillary RCC ( n = 7; 4 %), and collecting duct RCC ( n = 6; 4 %). Eleven (7 %) cases had sarcomatoid features. Lymph node, lung, brain, bone, and liver metastases were observed on systemic therapy initiation in 68 (37 %), 131 (72 %), 8 (4 %), 58 (32 %), and 18 (10 %) patients, respectively. A total of 63 (34 %) and 120 (66 %) received ICI-based combination therapy and TKI monotherapy, respectively. A total of 64 (36 %), 79 (45 %), and 33 (19 %) patients were classified into the IMDC favorable-, intermediate-, and poor-risk, respectively. First-line ICI-based combination regimens were nivolumab plus ipilimumab ( n = 32; 51 %), nivolumab plus cabozantinib ( n = 13; 21 %), pembrolizumab plus axitinib ( n = 10; 16 %), pembrolizumab plus lenvatinib ( n = 6; 10 %), and atezolizumab plus bevacizumab ( n = 2; 3 %), whereas first-line TKI monotherapy regimens were sunitinib ( n = 68; 57 %) and pazopanib ( n = 52; 43 %) in descending order. A total of 98 (54 %) patients subsequently received second-line therapies due to progression and/or toxicity to first-line therapies.
3.2
BMI subgroups
Of the 183 patients included, 130 (71 %) were overweight. There was a significantly higher proportion of male patients in the normoweight subgroup than in the overweight subgroup (87 % versus 64 %; P = 0.002). There was a numerically lower proportion of the IMDC poor-risk patients in the overweight subgroups than in the normoweight subgroup (16 % vs. 27 %; P = 0.191), although it did not reach statistical significance. None of the other baseline characteristics of patients significantly differed between the BMI subgroups as listed in Table 1 .
| Variable | Normoweight( n = 53) | Overweight( n = 130) | P | ||
|---|---|---|---|---|---|
| Median age, years (IQR) | 64 | (56–73) | 66 | (56–72) | 0.994 |
| Men, n (%) | 46/53 | (87 %) | 83/130 | (64 %) | 0.002 |
| Previous nephrectomy, n (%) | 29/53 | (55 %) | 79/130 | (61 %) | 0.509 |
| Adverse histology, n (%) | 14/51 | (27 %) | 26/129 | (20 %) | 0.322 |
| Nonclear cell histology, n (%) | 10/51 | (20 %) | 22/129 | (17 %) | 0.671 |
| Sarcomatoid dedifferentiation, n (%) | 6/48 | (13 %) | 5/120 | (4 %) | 0.078 |
| Adverse metastases, n (%) | 23/53 | (43 %) | 53/130 | (41 %) | 0.744 |
| Brain metastases, n (%) | 2/53 | (4 %) | 6/130 | (5 %) | 1 |
| Bone metastases, n (%) | 18/53 | (34 %) | 40/130 | (31 %) | 0.727 |
| Liver metastases, n (%) | 6/53 | (11 %) | 12/130 | (9 %) | 0.785 |
| Multiple sites of metastases, n (%) | 30/53 | (57 %) | 77/130 | (59 %) | 0.744 |
| IMDC risk, n (%) | 0.191 | ||||
| Favorable | 14/49 | (29 %) | 50/127 | (39 %) | |
| Intermediate | 22/49 | (45 %) | 57/127 | (45 %) | |
| Poor | 13/49 | (27 %) | 20/127 | (16 %) | |
| First-line regimen, n (%) | 0.306 | ||||
| ICI-based combination | 15/53 | (28 %) | 48/130 | (37 %) | |
| TKI mono | 38/53 | (72 %) | 82/130 | (63 %) | |
Related posts:
 Tumor involvement of the trigone and urethra at the time of robot-assisted radical cystectomy is associated with adverse oncological outcomes
 Diet and the microbiome as mediators of prostate cancer risk, progression, and therapy response
 Understanding the microbiome as a mediator of bladder cancer progression and therapeutic response
 5α-reductase inhibitors with or without alpha-blockers and risk of incident upper tract urothelial carcinoma in men with benign prostatic hyperplasia: Analysis of US insurance claims data
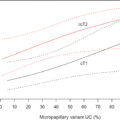 Quantification of micropapillary component on transurethral resection is associated with likelihood of occult lymph node metastasis at radical cystectomy
 Causal relationship between bladder cancer and gut microbiota contributes to the gut-bladder axis: A two-sample Mendelian randomization study
Stay updated, free articles. Join our Telegram channel

Full access? Get Clinical Tree


