Highlights
- •
Biopsy (RTB) is an optional tool during decision making for renal cancer.
- •
The discordance between biopsy and final surgical pathology is minimal.
- •
The optimal RTB should be 2 cores with at least 0.8 cm of tissue or 3 cores.
Abstract
Objective
Renal Tumor biopsy (RTB) can assist clinicians in determining the most suitable approach for treatment of renal cancer. However, RTB’s limitations in accurately determining histology and grading have hindered its broader adoption and data on the concordance rate between RTB results and final pathology after surgery are unavailable. Therefore, we aimed to develop a machine learning algorithm to optimize RTB technique and to investigate the degree of concordance between RTB and surgical pathology reports.
Materials and methods
Within a prospectively maintained database, patients with indeterminate renal masses who underwent RTB at a single tertiary center were identified. We recorded and analyzed the approach (US vs. CT), the number of biopsy cores (NoC), and total core tissue length (LoC) to evaluate their impact on diagnostic outcomes. The K-Nearest Neighbors (KNN), a non-parametric supervised machine learning model, predicted the probability of obtaining pathological characterization and grading. In surgical patients, final pathology reports were compared with RTB results.
Results
Overall, 197 patients underwent RTB. Overall, 89.8% (n=177) and 44.7% (n=88) of biopsies were informative in terms of histology and grading, respectively. The discrepancy rate between the pathology results from renal tissue biopsy (RTB) and the final pathology report following surgery was 3.6% (n=7) for histology and 5.0% (n=10) for grading. According to the machine learning model, a minimum of 2 cores providing at least 0.8 cm of total tissue should be obtained to achieve the best accuracy in characterizing the cancer. Alternatively, in cases of RTB with more than two cores, no specific minimum tissue threshold is required.
Conclusions
The discordance rates between RTB pathology and final surgical pathology are notably minimal. We defined an optimal renal biopsy strategy based on at least 2 cores and at least 0.8 cm of tissue or at least 3 cores and no minimum tissue threshold.
Patients summary
RTB is a useful test for kidney cancer, but it’s not always perfect. Our study shows that it usually matches up well with what doctors find during surgery. Using machine learning can make RTB even better by helping doctors know how many samples to take. This helps doctors treat kidney cancer more accurately.
1
Introduction
The incidence of Renal Cell Carcinoma (RCC) has risen over the past decades [ ]. The management of Small Renal Masses (SRM) involves several options such as active surveillance (AS), local tumour ablation (ABL) and surgery [ ]. SRM include a nonnegligible proportion of benign or low-grade malignant cancer which might benefit from nonsurgical approaches [ , ]. In this context, the use of Renal Tumour Biopsy (RTB) can be instrumental in optimizing the benefit-risk balance for patients by providing crucial diagnostic information for clinical decision-making in terms of surgical (partial vs. radical nephrectomy) vs. nonsurgical approaches and timing of treatment, as well [ ]. European guidelines acknowledge RTB’s diagnostic potential, impacting clinical decisions in select cases, yet provide limited technical recommendations for its execution [ ]. Data regarding the accuracy and treatment outcomes in patients undergoing RTB is historically heterogeneous and limited, but there is consensus that it remains a safe and effective option [ , ]. Despite the potential benefits of RTB, [ , ], few urologists consider RTB in clinical decision-making of SRM [ ], despite the very low morbidity associated with the procedure [ ].
Remarkably, RTB fail to yield diagnosis in 9%–23% of cases [ ] and, to our knowledge, no published data exists on the concordance between RTB pathological findings and final surgical pathology results. While in the context of benign renal diseases, it has been shown that obtaining at least 20 glomeruli in a biopsy specimen is considered adequate [ , ], in the field of onco-urology specific indications on how performing the biopsy or indicators of a quality are still lacking. How many cores should be collected? What is the best imaging guidance? What is the concordance between RTB pathological findings and final surgical pathology results? To address such critical questions, the aim of the study was to develop a machine learning algorithms to optimize RTB technique focusing on modifiable factors, with the goal of defining an optimal RTB and providing clinical indications to improve current practice and to investigate the degree of concordance between RTB and final pathology report after surgery.
2
Methods
2.1
Patient population
After IRB approval (Protocol Rene-2007), within a prospectively maintained database, consecutive patients with indeterminate renal masses who underwent 18-gauge RTB between 2015 and 2022 at a single tertiary referral center were identified. The database comprises patients 1) who underwent RTB before clinical decision or 2) RTB in the context of an ablative treatment or 3) before systemic therapy in metastatic patients.
Patients were assessed via a detailed medical history including data on health-significant comorbidities as scored using the Charlson comorbidity index (CCI) [ ]. Body mass index (BMI; kg/m 2 ) was measured. For each patient, we considered RTB approach (US vs. CT), number of biopsy cores (NoC) and length of cores (LoC). Malignancy, histological type, and grading were recorded. All specimens were evaluated by dedicated uro-pathologists with extensive experience in renal cancer and categorized according to ISUP [ ].
Subsequently, patients were annually followed to track the type of subsequent treatment (surgery vs. AS vs. ABL vs. systemic therapy) and to assess survival. For patients surgically treated, RTB data were compared with pathological histology and grading. Postprocedural complications were identified using the Clavien-Dindo classification for both RTB and renal surgeries [ , ].
2.2
Variable definition
The outcomes of the study were:
- 1.
A diagnostic biopsy with defined as a RTB allowing a conclusive pathology report with specific information of RCC histology and grade defined according to ISUP. [ ]
- 2.
Defining the degree of concordance between RTB histology and grade, and final pathology report after surgery.
The variables of interest were modifiable features of RTB, under the assumption that unmodifiable factors cannot have a direct impact on clinical decision-making per se. Covariates were age, sex, CCI, BMI, lesion side and clinical size.
2.3
Statistical analysis
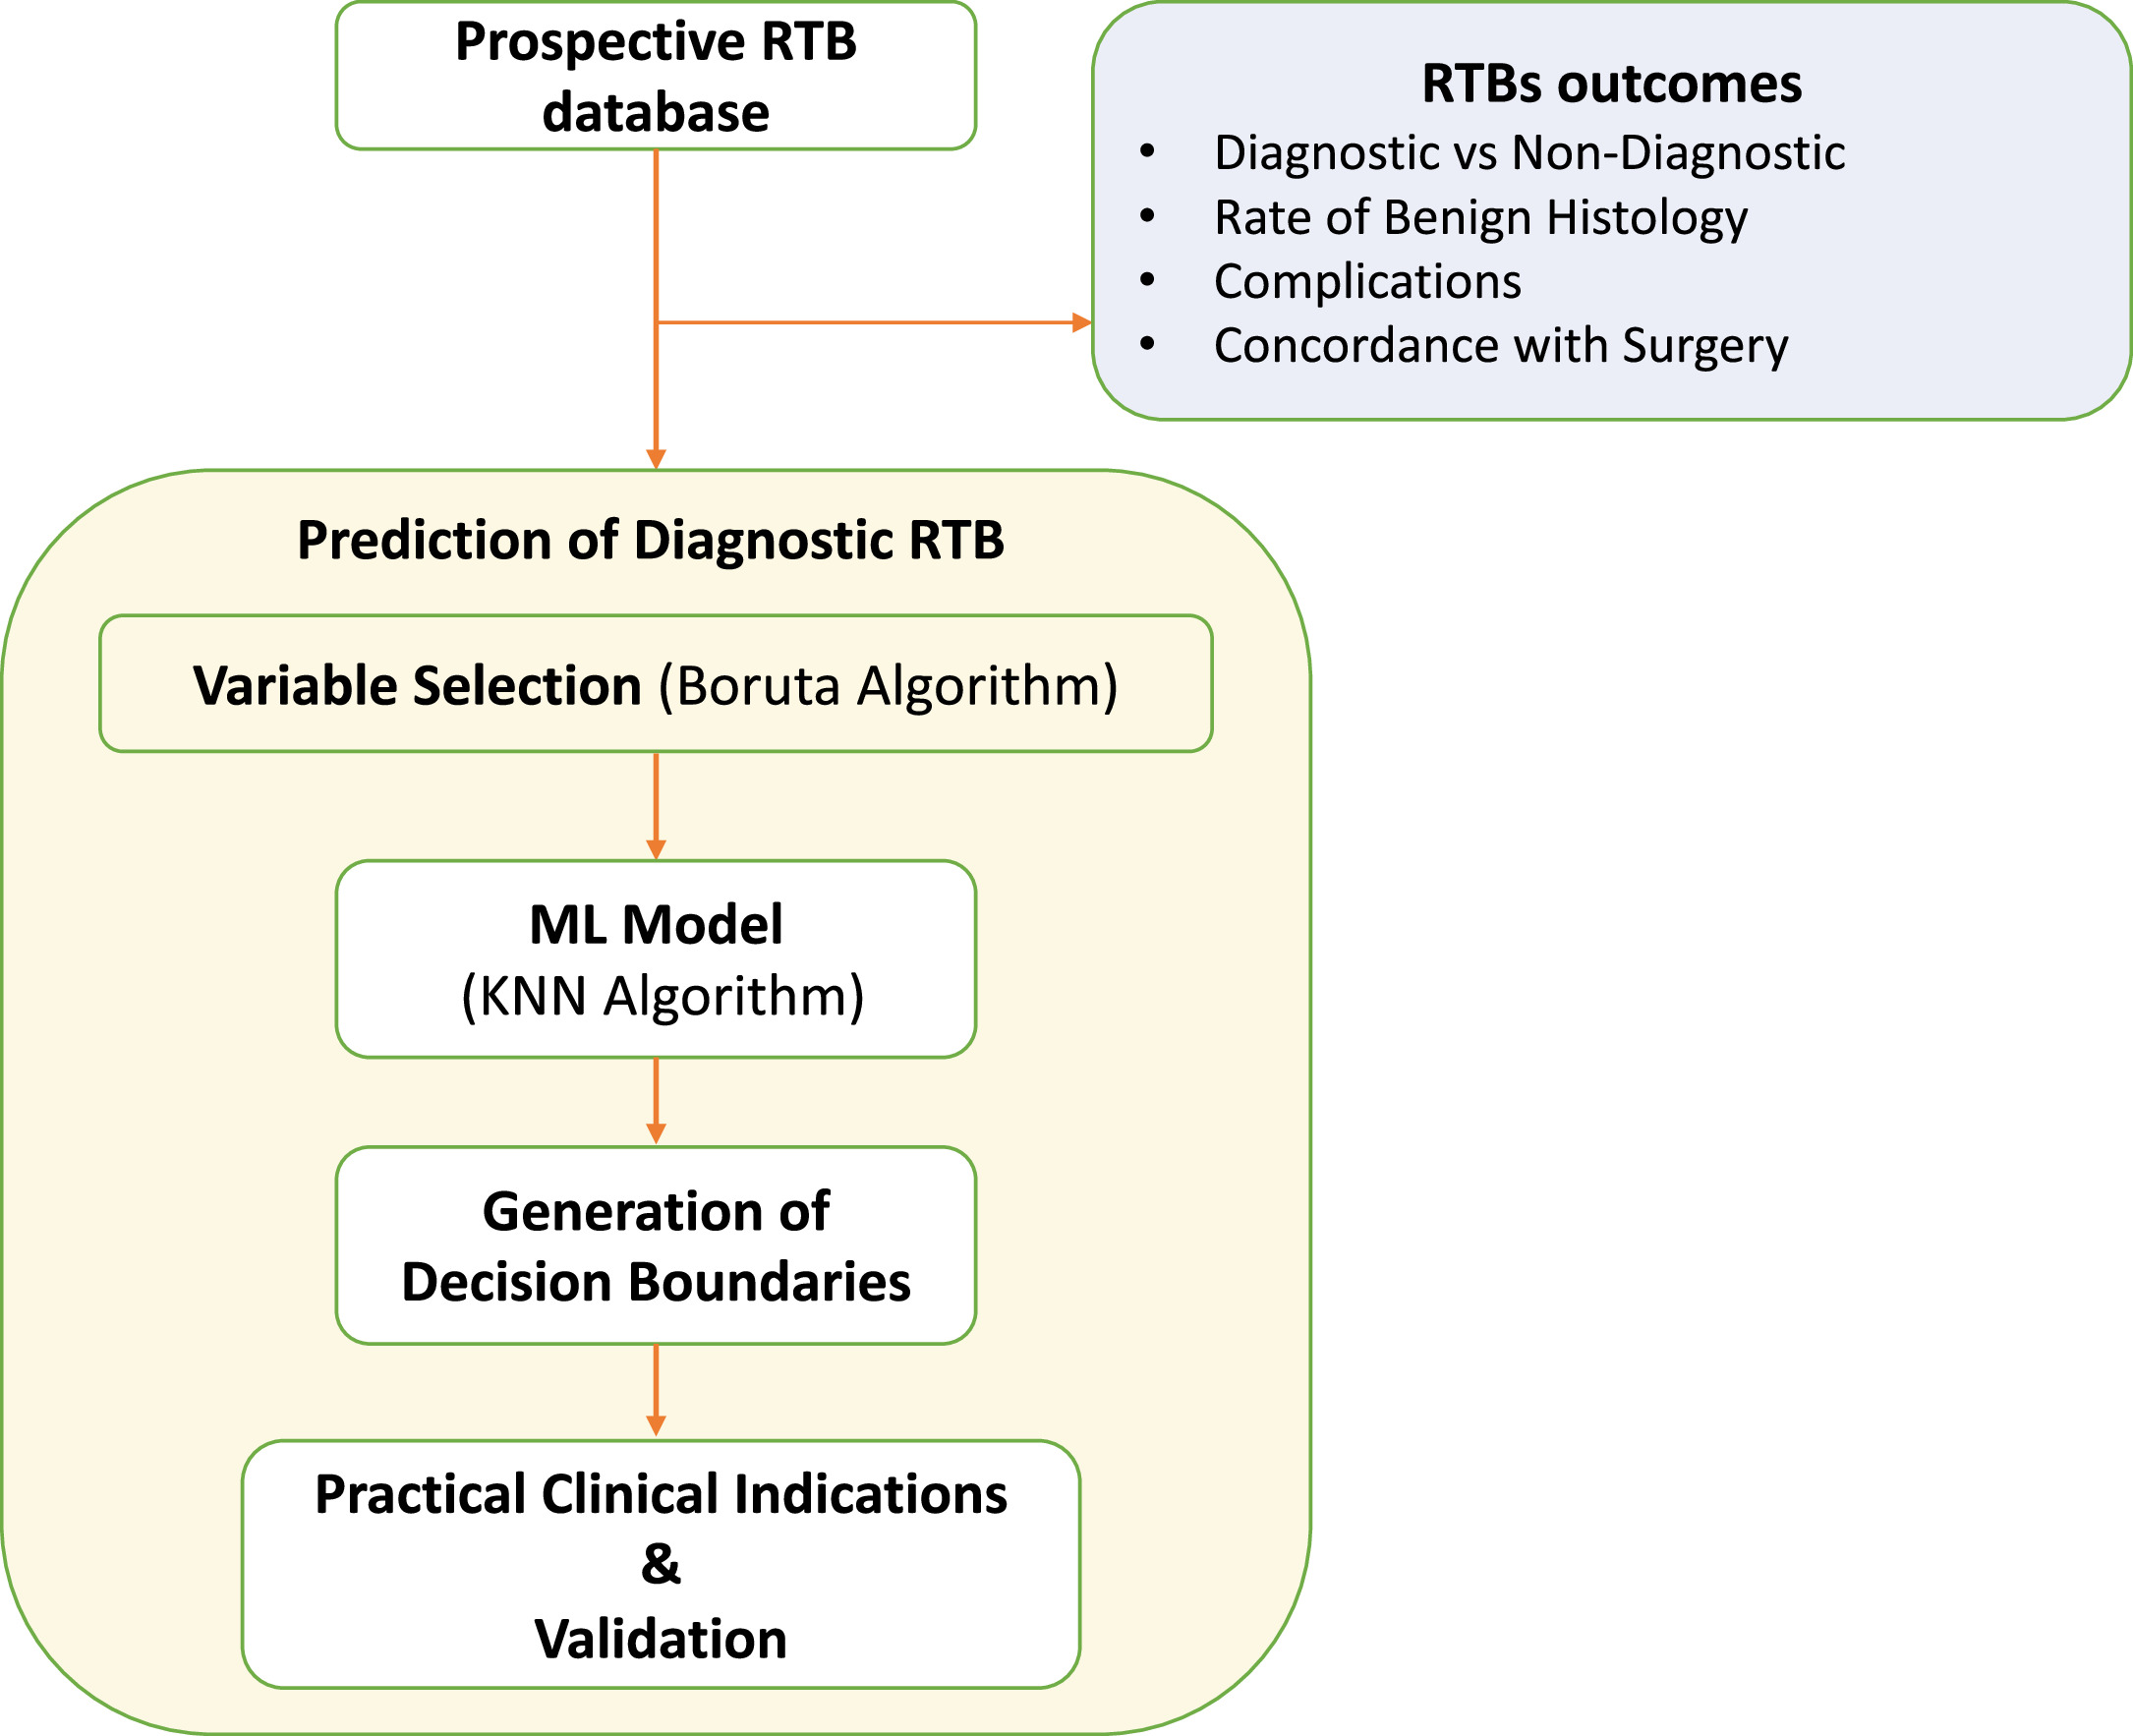
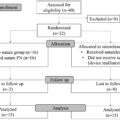
We have described study methodology in Fig. 1 . Statistical descriptive analyses were used to characterize the patient demographics and clinical features of those undergoing renal biopsies, as well as short-term and long-term outcomes. Additionally, a Sankey diagram was utilized to visually represent the subsequent clinical decisions after RTB.
RTBs that reached a thorough level of identification, covering both histology and grading, were considered diagnostic.
To predict diagnostic RTB, the Boruta algorithm was employed to ascertain the most significant features in predicting diagnostic RTB. The Boruta algorithm is an all-relevant feature selection method that identifies important variables by creating shadow features and comparing their importance to the original features, ensuring that only those that have a significant contribution to the predictive model are retained through a comparison of the Z-values of each feature with those of “shadow features.” This involved duplicating all actual features and shuffling them in sequence. In each iteration, the Z-value of each attribute was derived from a random forest model, while the Z-value of the shadow was created by randomly shuffling the actual features. A real feature was deemed “important” if its Z-value exceeded the maximum Z-value of shadow features in multiple independent trials [ , ]. Type of imaging used, NoC and LoC were used in the Boruta algorithm model. Subsequently, the K-Nearest Neighbors (KNN), a nonparametric supervised machine learning model, predicted the probability of obtaining a diagnostic RTB based on the chosen variables [ , ]. The KNN algorithm is a machine learning technique that classifies or predicts the category of a data point by considering the majority class among its k nearest neighbours in a feature space [ ]. The dataset was split into training and testing sets using a 90–10 ratio for the KNN model. Specifically, 90% of the data was allocated to the training set, which was utilized for building the predictive model. The remaining 10% constituted the testing set, serving as independent data for evaluating the model’s performance and assessing its ability to generalize to new, unseen observations. The KNN model was employed using a 5-fold cross-validation repeated 3 times, with the optimal K value being determined automatically during the modelling process. Decision boundaries from the KNN model guided the creation of diagnostic recommendations [ ], which were tested using multivariable logistic regression predicting the probability of diagnostic RTB, both in terms of histology and grade. The association between RTB’s complications and NoC, Loc, or the fact that the biopsies followed the final recommendations from this paper was investigated using a multivariate logistic regression.
3
Results
3.1
Population characteristics and RTB outcomes
Table 1 depicts patient and RTB characteristics. Of the 197 patients included in the study, 17% (n=33) proceeded to surgery. Overall, 89.8% (n=177) and 44.7% (n=88) of biopsies were diagnostic with respect to histotype and grading, respectively. In respect to specific histology results, ccRCC, papillary, and chromophobe were found in 42.1% (n=83), 15.7 (n=31), and 3.6% (n=7) patients and 35% (n=69) had a benign SRM. The median (IQR) NoC and LoC were 2 (1–3) and 1.2 (0.6–1.6) cm, respectively. Only 1% (n=2) of patients reported grade III complications and no grade IV-V complications were reported. The recorded grade III complications encompassed a pleural effusion, managed through thoracic drainage, and bleeding from a costal vessel, addressed through embolization. Table 1B
| Variable | levels | Value |
|---|---|---|
| Patients Demographic | ||
| Age at biopsy (Years) Median [IQR] | 68 [57, 76] | |
| Sex (N., %) | F | 60 (30.5) |
| M | 137 (69.5) | |
| CCI (%) | 0 | 20 (10.2) |
| 1 | 26 (13.2) | |
| 2 | 35 (17.8) | |
| 3+ | 116 (58.8) | |
| BMI (Kg/m 2 ) Median [IQR] | 25.6 [23.3, 29.0] | |
| Lesions and RTBs Characteristics | ||
| Lesion Side (%) | L | 100 (50.8) |
| R | 97 (49.2) | |
| Lesion size (Cm) Median [IQR] | 2.5 [2.0, 3.2] | |
| N. of biopsy cores (%) | 1 | 67 (34.0) |
| 2 | 57 (28.9) | |
| 3 | 36 (18.3) | |
| 4+ | 37 (18.8) | |
| Total Biopsy Length (Cm) Median [IQR] | 1.2 [0.6, 1.6] | |
| Type of Biopsy (%) | CT – guided | 82 (41.6) |
| US – guided | 115 (58.4) | |
Related posts:
 Tumor involvement of the trigone and urethra at the time of robot-assisted radical cystectomy is associated with adverse oncological outcomes
 Diet and the microbiome as mediators of prostate cancer risk, progression, and therapy response
 5α-reductase inhibitors with or without alpha-blockers and risk of incident upper tract urothelial carcinoma in men with benign prostatic hyperplasia: Analysis of US insurance claims data
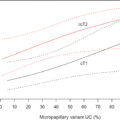 Quantification of micropapillary component on transurethral resection is associated with likelihood of occult lymph node metastasis at radical cystectomy
 Laparoscopic suture-free partial nephrectomy using argon-beam-coagulator: Surgical technique and outcomes of a single-center, open-label randomized controlled trial
 Causal relationship between bladder cancer and gut microbiota contributes to the gut-bladder axis: A two-sample Mendelian randomization study
Stay updated, free articles. Join our Telegram channel

Full access? Get Clinical Tree


