Highlights
- •
Since primary testicular lymphoma (PTL) is a rare malignancy, there is no perfect survival prognostic model.
- •
We developed an online prognostic model for predicting the overall survival and disease-specific survival of PTL patients.
- •
The age, tumor histological type, Abbe stage, degree of differentiation, and whether or not they had received radiotherapy and chemotherapy were significantly associated with the poor prognosis of PTL patients.
Abstract
Background
Primary testicular lymphoma (PTL) is a rare malignancy whose epidemiology and prognosis have not been studied.
Materials and methods
PTL patient data were collected from the SEER online database, and the data were divided into a training cohort and a validation cohort according to random assignment. The training cohort was subjected to a one-way COX regression analysis, and statistically significant differences were included in the multi-factor COX regression analysis and constructed nomograms. Forest plots were constructed based on risk factors. The validity of the nomograms was verified by observing the C-index size of the nomograms, the percentage of area under the ROC curve, and the degree of fit of the prediction curve in the calibration plot. The validation cohort verified the accuracy and applicability of the nomograms.
Result
The patient’s age, tumor histologic type, Ann Arbor stage, grade of differentiation, and whether or not they received radiation and chemotherapy were significantly associated with poor prognosis in PTL.
Conclusion
The nomogram constructed based on multivariate COX regression analysis can predict the prognosis of PTL patients. The online visualization nomogram can help clinicians calculate the survival rate of PTL tumor patients and conduct personalized prognostic assessments for PTL tumor patients.
1
Introduction
Primary testicular lymphoma (PTL) was first described by Malassez in 1877 and later defined as a stable clinical disease by Curling in 1878 [ ]. PTL is a malignancy occurring at immune-privileged sites [ ] and is an aggressive, rare extranodal lymphoma that accounts for approximately 9% of testicular tumors and 1-2% of non-Hodgkin lymphomas (NHL) [ ].PTL is the most common bilateral testicular tumor [ ]. The most common subtype is diffuse large B-cell lymphoma (DLBCL), and a minority is mantle cell, NK/T-cell, and other T-cell lymphomas [ , , ]. Primary PTL often occurs in older people, with the average age at diagnosis being 67 years [ ]. The annual incidence is 0.09–0.26/100,000 people [ ]. Currently, there is no standard treatment for primary PTL. Treatment of PTL mainly involves multimodality therapy, including orchiectomy, systemic chemotherapy, scrotal radiotherapy (RT), and preventive targeted CNS therapy [ ]. Orchiectomy offers a therapeutic advantage in treating primary PTL because it can control local tumor progression and eliminate the possibility of recurrence at this site [ ]. However, the overalls of patients with PTL who underwent orchiectomy alone or with local radiotherapy were poor.
There is no perfect predictive model for survival due to the rarity of testicular lymphoma. Ann Arbor clinical staging use to assess the prognosis of patients with PTL remains controversial [ , , ]. The International Lymphoma Prognostic Index, as a prognostic factor for treatment response, relapse, and survival, is not suitable for classifying the prognosis of testicular lymphoma. Therefore, to improve the validity and accuracy of predictive models for predicting the prognosis of PTL patients, clinical factors of PTL patients, such as tumor stage, age, histological type, degree of differentiation, and treatment should be considered.
A nomogram is a useful tool in medical oncology that does not require the classification of continuous variables, combines multiple probability scales based on overall scores, and ultimately displays regression models constructed based on risk factors in a visual format for assessing patient prognosis [ , ]. The National Cancer Institute database (SEER) is unparalleled in analyzing oncology data [ ]. Therefore, we extracted data on primary PTL from the SEER database to identify factors statistically significantly associated with patient survival and to develop predictive models to help healthcare providers estimate patient prognosis to inform clinical decisions.
2
Materials and methods
2.1
Data sources
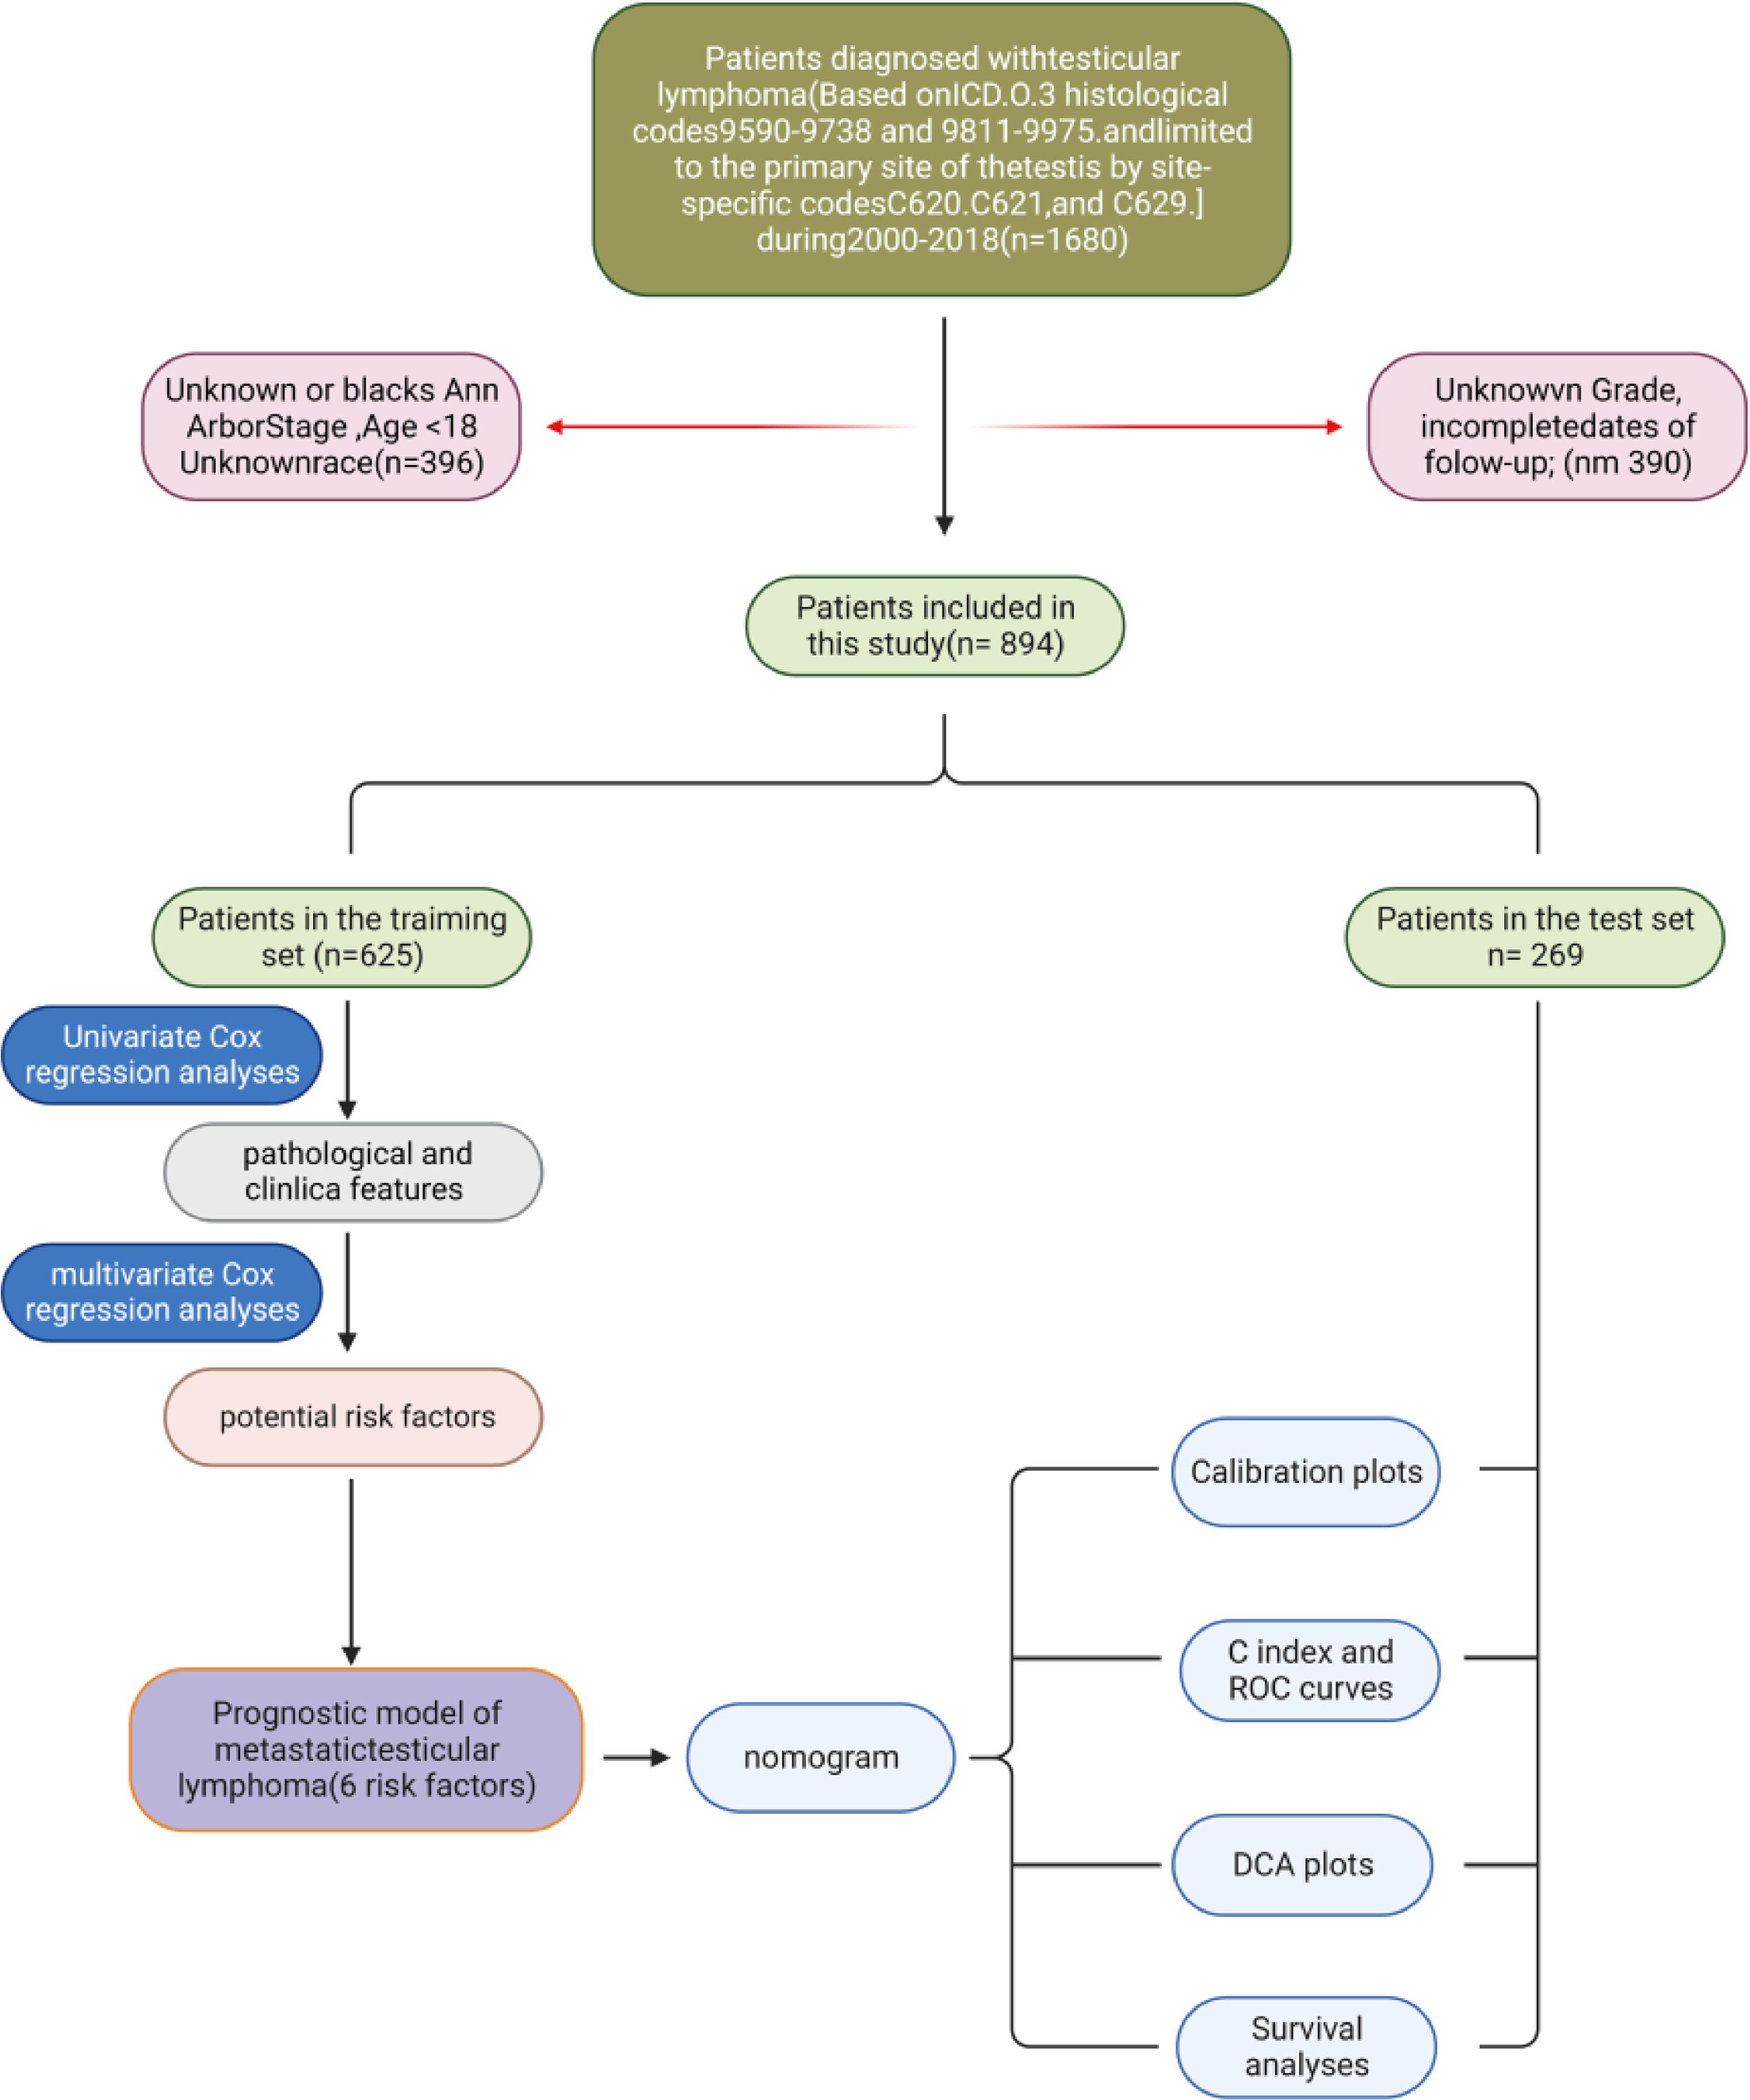
Data on PTL patients were obtained from the SEER database, including 18 registries. First, the annual incidence of PTL from 1975 to 2018 was extracted to examine incidence trends. Then, the data of PTL patients from 2000 to 2018 were extracted. All extracted data were retrieved and extracted using SEER Stat (version 8.4.2). The process of data inclusion and exclusion is shown in Fig. 1 .
2.2
Statistical analysis
Event rates per 1,000,000 persons were calculated with SEER stat (version 8.4.2), age-adjusted for the standard US population in 2000. Annual percentage change (APC) was calculated with SEER stat software. 95% confidence intervals (CIs) were calculated.
Referring to previous studies, we used Rstudio software (version 4.3.1) to randomly divide 894 patients with primary PTL into 2 groups with ratios of 0.7 and 0.3, respectively [ ]. The training cohort was used to generate nomograms ( n = 625), and the validation cohort group was used to validate the predictive ability of the models developed ( n = 269). A flowchart of the research process in this work is shown ( Fig. 1 ).
Overall survival (OS) and cancer-specific survival (CSS) were the endpoints of interest, defined as the time from diagnosis of PTL to time to death from any cause or time to death due to PTL, respectively.
Using the R-Studio packages rms, foreign, and survival, all variables were first subjected to univariate Cox analysis to identify statistically significant risk factors affecting prediction. Subsequently, a multivariate Cox regression analysis was performed to identify further significantly affecting OS/CSS risk factors. The resulting risk factors included a patient’s race, age, marital status, histologic tumor subtype, degree of differentiation, and radiotherapy/chemotherapy was performed. Statistically significant factors were then included in a multivariate Cox regression analysis, which yielded a hazard ratio (HR) with a 95% confidence interval (CI).
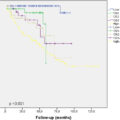
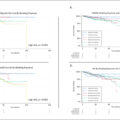
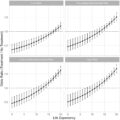
Finally, nomograms were constructed using the statistically significant variables in multivariate COX regression analysis. We summed the patient’s underlying factors concerning the score of each variable in the nomogram to obtain the probability of predicting 1-year, 3-year, 5-year, and 10-year survival OS/CSS, which represents the probability of the patient’s survival. Patients were divided into high-risk and low-risk groups based on their risk scores. The Kaplan-Meier survival curve was used to observe the difference in survival distribution between the high-risk and the low-risk. The log-rank test was used to determine whether there was a statistical difference between the 2 groups.
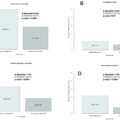
We used a validation cohort for verification to validate the accuracy and applicability of the prognostic nomogram. The area under the curve (AUC) of the ROC curve reflects the predictive ability of the prognostic model, and the consistency index (C index) is used to evaluate the accuracy of the model prediction results. The AUC ranges from 0 to 1, and the C-index ranges from 0.5 to 1, with values above 0.7 indicating excellent discrimination. The calibration plot is used to illustrate the model’s accuracy and consistency, and the calibration curve’s closeness to the standard curve is observed to demonstrate the predictive power of the prediction model. Decision curve analysis (DCA) is a method of evaluating clinical utility. The net benefit of the all-factor group compared with the all-factor group compared with the all-factor group is observed.
Dynamic column charts are used to predict a patient’s survival at a fixed point in time, such as 1 year, 3 years, 5 years, or ten years, based on a total score obtained by summing the scores of the included variables. However, the conventional nomogram must draw a vertical line corresponding to the total points after determining the total score. Therefore, this process is cumbersome, and manual calculation accuracy could be higher. Consequently, we have developed a dynamic online nomogram. After applying for an account at https://shinyapps.io/ , create the COX regression model and then use the arms, DynNom, and reconnect software packages to generate 4 files from the Rstudio software: UI.R, server. R, global. R, and functions R. After deployment to the shiny apps server, an online dynamic nomogram is created. (OS, https://zhanghaomd.shinyapps.io/dynnomapp/;CSS , https://zhanghaonom.shinyapps.io/dynnomapp/ ).
3
Result
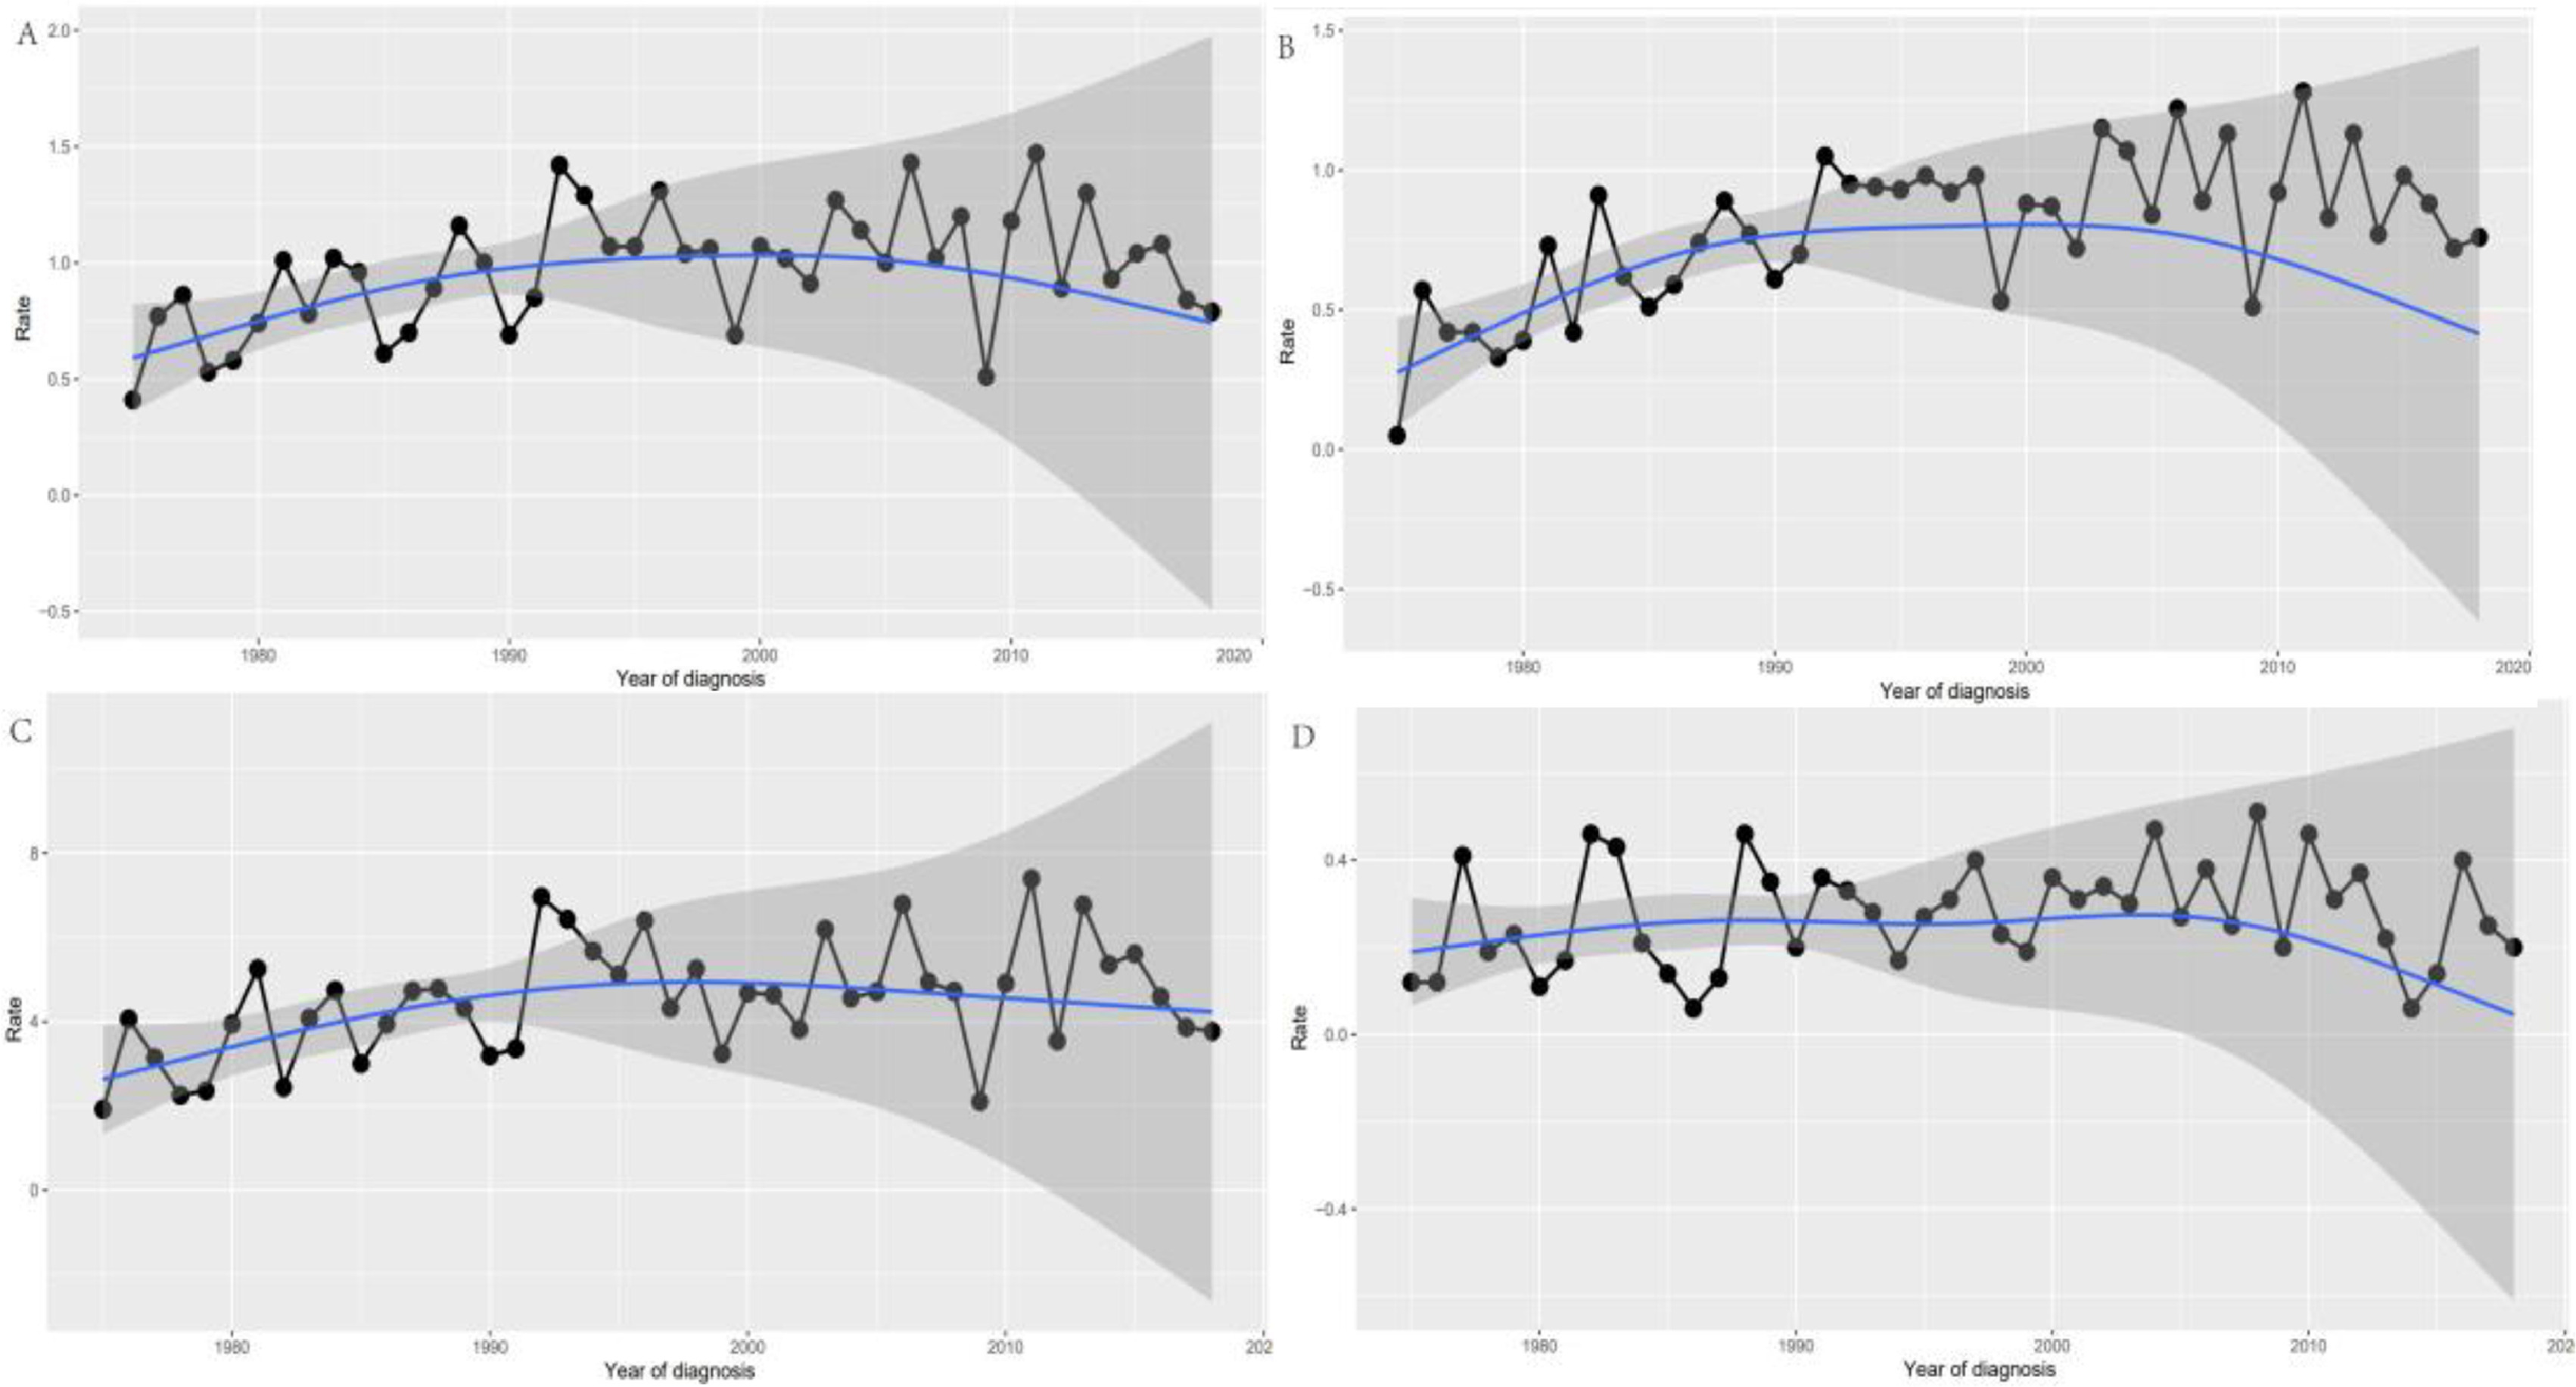
The overall incidence of primary PTL from 1975 to 2018 was 0.90/1,000,000 (2000 US standard population) (APC = 0.656; 95% CI, 0.037–1.279, P < 0.05), with a slight upward trend in incidence. The histologic subtype with the highest incidence (DLBCL) increased steadily over time (Fig. 2) . The APC for whites from 1975 to 2018 was 0.812 (95% CI, 0.122–1.507; P < 0.05). Across age groups, incidence was significantly higher in those over 60 years of age (0.73/1,000,000) than in those under 60 years of age (0.39/1,000,000). The APC was 0.73 (95% CI, 0.01–1.45, P < 0.05) for patients 60 years and older and 0.39 (95% CI; -0.69-1.47, P < 0.05) for patients younger than 60 years.
Based on the inclusion and exclusion criteria, 894 PTL patients were finally enrolled and randomly assigned to the training group ( N = 625), and validation group (N=269) in a ratio of 7:3. The clinicopathologic characteristics of the PTL patients are summarized in Table 1 . In patients diagnosed with PTL, 73.1% of the patients were older than 60 years old, 16.9% were ≥80 years old, most of them were white (85.92%), and the remainder were black or of other races (14.2%). Most patients were married ( n = 611, 68.3%). Tumor primary was predominantly unilateral (91.6%), with bilateral testicular involvement in only 68 cases (7.6%). In terms of treatment, 849 patients (95%) received surgery, 679 (76%) chemotherapy, and 342 (38.3%) fewer patients were treated with radiation. Ann Arbor staging stage I was the most common, with 59.4%. Stages II, III, and 4 had 18%, 5.1%, and 17.4% of patients, respectively. One of the most common pathological types was DLBCL ( N = 795, 88.9%), and most tumors differentiated as B-cell related ( N = 869, 97.2%).
| All patients N = 894 (%) | Training set N = 625 (%) | Validation set N = 269 (%) | P | |
|---|---|---|---|---|
| Age (years) | 0.504 | |||
| <50 | 106 (11.9) | 81 (13.0) | 25 (9.3) | |
| 50–60 | 135 (15.1) | 95 (15.2) | 40 (14.9) | |
| 61–69 | 216 (24.2) | 148 (23.7) | 68 (25.3) | |
| 70–79 | 286 (32.0) | 193 (30.9) | 93 (34.6) | |
| >80 | 151 (16.9) | 108 (17.3) | 43 (16.0) | |
| Marital status | 0.722 | |||
| Married | 611 (68.3) | 426 (68.2) | 185 (68.8) | |
| Widowed, divorced | 138 (15.4) | 98 (15.7) | 40 (14.9) | |
| Single, separated, unmarried | 121 (13.5) | 82 (13.1) | 39 (14.5) | |
| Unkonwn | 24 (2.7) | 19 (3.0) | 5 (1.9) | |
| Race | 0.819 | |||
| White | 767 (85.8) | 537 (85.9) | 230 (85.5) | |
| Black | 39 (4.4) | 25 (4.0) | 14 (5.2) | |
| Asian or Pacific Islander | 83 (9.3) | 59 (9.4) | 24 (8.9) | |
| American Indian/Alaska Nativer | 5 (0.6) | 4 (0.6) | 1 (0.4) | |
| Histologic_Type | 0.289 | |||
| Non-Hodgkin lymphoma | 44 (4.9) | 36 (5.8) | 8 (3.0) | |
| DLBCL | 795 (88.9) | 547 (87.5) | 248 (92.2) | |
| Other B-lymphoma | 14 (1.6) | 11 (1.8) | 3 (1.1) | |
| T-NHL | 9 (1.0) | 7 (1.1) | 2 (0.7) | |
| Burkitt lymphoma | 12 (1.3) | 7 (1.1) | 5 (1.9) | |
| Follicular lymphoma | 10 (1.1) | 9 (1.4) | 1 (0.4) | |
| Other | 10 (1.1) | 8 (1.3) | 2 (0.7) | |
| Grade | 0.707 | |||
| NK cell; natural killer cell | 8 (0.9) | 6 (1.0) | 2 (0.7) | |
| B-cell; pre-B; B-precursor | 869 (97.2) | 605 (96.8) | 264 (98.1) | |
| T-cell | 13 (1.5) | 10 (1.6) | 3 (1.1) | |
| Poorly differentiated; Grade III | 1 (0.1) | 1 (0.2) | 0 (0.0) | |
| Undifferentiated; anaplastic; Grade IV | 3 (0.3) | 3 (0.5) | 0 (0.0) | |
| Ann Arbor stage | 0.297 | |||
| I | 531 (59.4) | 361 (57.8) | 170 (63.2) | |
| II | 161 (18.0) | 115 (18.4) | 46 (17.1) | |
| III | 46 (5.1) | 31 (5.0) | 15 (5.6) | |
| IV | 156 (17.4) | 118 (18.9) | 38 (14.1) | |
| Laterality | 0.246 | |||
| side unspecified | 7 (0.8) | 4 (0.6) | 3 (1.1) | |
| Right | 425 (47.5) | 287 (45.9) | 138 (51.3) | |
| Left | 394 (44.1) | 281 (45.0) | 113 (42.0) | |
| Bilateral | 68 (7.6) | 53 (8.5) | 15 (5.6) | |
| Radiation | 0.087 | |||
| None/Unknown | 552 (61.7) | 374 (59.8) | 374 (66.1) | |
| Yes | 342 (38.3) | 251 (40.2) | 91 (33.8) | |
| Chemotherapy | 0.412 | |||
| None/Unknown | 215 (24.0) | 145 (23.2) | 70 (26.0) | |
| Yes | 679 (76.0) | 480 (76.8) | 199 (74.0) | |
| Surgery | 0.178 | |||
| None/Unknown | 45 (5.0) | 36 (5.58) | 9 (3.3) | |
| yes | 849 (95.0) | 589 (94.2) | 260 (96.7) |
3.1
Prognostic factors affecting OS and CSS identified by univariate and multivariate analyses
We used univariate COX regression analysis to screen for prognostic factors affecting patients with PTL, which were then included in multivariate COX regression analysis with the results shown in Table 2 . Ultimately, we identified age, histologic type, Ann Arbor staging, chemotherapy, radiotherapy, and differentiation grade as independent prognostic factors for OS and CSS. We found that nearly all tumors were B-cell related and were poor prognostic factors for patients with PTL. We performed a subgroup analysis of B-cell-associated PTL versus other types of PTL ( Supplementary Table 1 ). There was no statistical difference in clinical factors between the 2 groups, except for age differences.
| Variable | OS | CSS | ||||||
|---|---|---|---|---|---|---|---|---|
| Univariate analysis | Multivariate analysis | Univariate analysis | Multivariate analysis | |||||
| HR (95% CI) | P | HR (95% CI) | P | HR (95% CI) | P | HR (95% CI) | P | |
| Age | ||||||||
| <50 | Ref | Ref | Ref | |||||
| 50–60 | 0.81 (0.49–1.35) | 0.437 | 0.71 (0.4211–1.20) | 0.206872 | 0.67 (0.38–1.17) | 0.168 | 6.077e-01 (0.34–1.07) | 0.089189 |
| 61–69 | 1.71 (1.11–2.64) | 0.014 | 1.61 (1.01–2.52) | 0.033605 | 0.90 (0.55–1.49) | 0.7015 | 8.592e-01 (0.51–1.43) | 0.561031 |
| 70–79 | 2.75 (1.83–4.12) | < 0.001 | 2.761 (1.81–4.22) | < 0.001 | 1.57 (1.01–2.44) | 0.0441 | 1.757e+00 (1.10–2.80) | 0.017787 |
| >80 | 5.41 (0.18–8.25) | < 0.001 | 4.641 (2.97–7.21) | < 0.001 | 3.01 (1.88–4.78) | < 0.001 | 2.725e+00 (1.66–4.47) | < 0.001 |
| Marital status | ||||||||
| Married | Ref | Ref | ||||||
| widowed,Divorced | 1.57 (1.19–2.05) | 0.251 | NA | NA | 1.51 (1.06–2.14) | 0.0196 | NA | NA |
| Single,Separated,Unmarried | 0.95 (0.68–1.33) | 0.003 | NA | NA | 1.23 (0.83–1.80) | 0.2903 | NA | NA |
| Unkonwn | 1.10 (0.62–1.98) | 0.72721 | NA | NA | 1.09 (0.51–2.34) | 0.8138 | NA | NA |
| Race | ||||||||
| White | Ref | Ref | ||||||
| Black | 0.84 (0.49–1.44) | 0.545 | NA | NA | 0.90 (0.46–1.76) | 0.764 | NA | NA |
| Asian or Pacific Islander | 0.90 (0.62–1.3) | 0.586 | NA | NA | 1.23 (0.81–1.80) | 0.851 | NA | NA |
| American Indian/Alaska Nativer | 0.70 (0.17–2.81) | 0.616 | NA | NA | 0.61 (0.08–4.36) | 0.623 | NA | NA |
| Histologic_Type | ||||||||
| Non-Hodgkin lymphomas | Ref | Ref | Ref | |||||
| DLBCL | 0.65 (0.42–0.99) | 0.0471 * | 1.07 (0.62–1.83) | 0.805131 | 0.77 (0.43–1.39) | 0.4032 | 1.575e+00 (0.70–3.51) | 0.267088 |
| Other B-lymphoma | 1.00 (0.46–2.17) | 0.9868 | 1.40 (0.60–3.26) | 0.434772 | 1.50 (0.59–3.82) | 0.3912 | 2.215e+00 (0.74–6.60) | 0.153356 |
| T-NHL | 2.23 (0.90–5.48) | 0.0809 | 1.77 (0.47–6.66) | 0.392084 | 2.64 (0.84–8.20) | 0.0932 | 1.863e+00 (0.25–13.62) | 0.540071 |
| Burkitt lymphoma | 1.63 (0.66–4.01) | 0.2837 | 5.82 (2.16–15.66) | < 0.001 | 3.30 (1.23–8.80) | 0.0169 | 1.088e+01 (3.42–34.55) | < 0.001 |
| Follicular lymphoma | 0.62 (0.23–1.64) | 0.3423 | 1.40 (0.50–3.95) | 0.513652 | 1.17 (0.41–3.33) | 0.7625 | 3.053e+00 (0.92–10.03) | 0.065998 |
| Other | 0.24 (0.05–1.05) | 0.0599 | 0.65 (0.14–2.90) | 0.57346 | 0.27 (0.03–2.09) | 0.2105 | 7.473e–01 (0.08–6.23) | 0.787814 |
| Grade | ||||||||
| NK cell; natural killer cell | Ref | Ref | Ref | |||||
| B-cell;pre-B;B-precursor | 0.14 (0.06–0.31) | < 0.001 | 0.09 (0.032–0.25) | < 0.001 | 1.220e–01 (0.04–0.30) | < 0.001 | 6.733e–02 (0.01–0.23) | < 0.001 |
| T-cell | 0.39 (0.13–1.10) | 0.0771 | 0.20 (0.050–0.82) | 0.025239 | 2.921e-01 (0.08–1.01) | 0.0532 | 1.508e-01 (0.01–1.14) | 0.067108 |
| Poorly differentiated;Grade III | 0.15 (0.01–1.32) | 0.089 | 0.05 (0.01–0.50) | 0.010397 | NA | 0.9894 | 4.675e-08 (0.00–Inf) | 0.989432 |
| Undifferentiated;anaplastic;Grade IV | 0.69 (0.17–2.79) | 0.6121 | 0.37 (0.084–1.65) | 0.195965 | 2.674e–01 (0.03–2.29) | 0.03121 | 1.698e-01 (0.01–1.67) | 0.128758 |
| Ann Arbor stage | ||||||||
| I | Ref | Ref | Ref | |||||
| II | 1.12 (0.86–1.46) | 0.39 | 1.41 (1.05–1.91) | 0.021656 | 1.57 (1.10–2.23) | 0.0111 | 1.81 (1.29–2.54) | <0.001 |
| III | 1.58 (1.09–2.29) | 0.015 | 1.28 (0.71–2.28) | 0.404342 | 1.64 (0.92–2.92) | 0.0923 | 1.81 (1.29–2.54) | 0.02457 |
| IV | 2.08 (1.64–2.64) | < 0.001 | 2.41 (1.83–3.17) | < 0.001 | 2.86 (2.09–3.9) | < 0.001 | 1.81 (1.29–2.54) | < 0.001 |
| Laterality | ||||||||
| side unspecified | Ref | Ref | ||||||
| Right | 2.15 (0.30–15.41) | 0.444 | NA | NA | 3285031 (0–Inf) | 0.992 | NA | NA |
| Left | 2.10 (0.29–15.05) | 0.458 | NA | NA | 3140002 (0–Inf) | 0.992 | NA | NA |
| Bilateral | 3.63 (0.49–26.49) | 0.203 | NA | NA | 5314749 (0–Inf) | 0.992 | NA | NA |
| Radiation | ||||||||
| None/Unknown | Ref | Ref | Ref | |||||
| Yes | 0.47 (0.37–0.59) | < 0.001 | 0.67 (0.52–0.87) | 0.00243 | 0.45 (0.3377–0.60) | < 0.001 | 6.022e–01 (0.43–0.82) | 0.001672 |
| Chemotherapy | ||||||||
| None/Unknown | Ref | Ref | Ref | |||||
| Yes | 0.44 (0.35–0.56) | < 0.001 | 0.59 (0.45–0.76) | < 0.001 | 0.49 (0.36–0.65) | < 0.001 | 5.944e-01 (0.42–0.82) | 0.00174 |
| Surgery | ||||||||
| None/Unknown | Ref | Ref | Ref | |||||
| yes | 0.44 (0.29–0.66) | < 0.001 | 0.73 (0.47–1.14) | 0.177515 | 0.37 (0.23–0.59) | < 0.001 | 7.053e-01 (0.42–1.17) | 0.180671 |
Related posts:
 Is primary retroperitoneal lymph node dissection the way forward for patients with testicular seminoma and limited retroperitoneal metastases?
 Critical care therapy and in-hospital mortality after radical nephroureterectomy for nonmetastatic upper urinary tract carcinoma
 The clinical relevance of cut-off percentage for high-grade urothelial carcinoma within low-grade urothelial carcinoma: A determining factor?
 Cumulative smoking exposure impacts oncologic outcomes of upper tract urothelial carcinoma
Multicenter study of active surveillance for small renal masses: Real world practice pattern
Cumulative smoking exposure impacts oncologic outcomes of upper tract urothelial carcinoma
Multicenter study of active surveillance for small renal masses: Real world practice pattern
 Patient preferences for life expectancy cutoffs for aggressive treatment in clinically localized prostate cancer
Stay updated, free articles. Join our Telegram channel

Full access? Get Clinical Tree


